Type 2 diabetes and remission: practical management guided by pathophysiology
- PMID: 33289165
- PMCID: PMC8247294
- DOI: 10.1111/joim.13214
Type 2 diabetes and remission: practical management guided by pathophysiology
Abstract
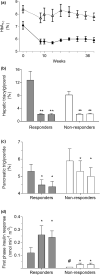
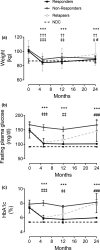
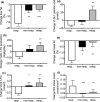
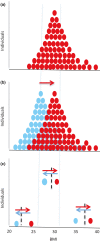
The twin cycle hypothesis postulated that type 2 diabetes was a result of excess liver fat causing excess supply of fat to the pancreas with resulting dysfunction of both organs. If this was so, the condition should be able to be returned to normal by calorie restriction. The Counterpoint study tested this prediction in short-duration type 2 diabetes and showed that liver glucose handling returned to normal within 7 days and that beta-cell function returned close to normal over 8 weeks. Subsequent studies have demonstrated the durability of remission from type 2 diabetes. Remarkably, during the first 12 months of remission, the maximum functional beta-cell mass returns completely to normal and remains so for at least 24 months, consistent with regain of insulin secretory function of beta cells which had dedifferentiated in the face of chronic nutrient oversupply. The likelihood of achieving remission after 15% weight loss has been shown to be mainly determined by the duration of diabetes, with responders having better beta-cell function at baseline. Remission is independent of BMI, underscoring the personal fat threshold concept that type 2 diabetes develops when an individual acquires more fat than can be individually tolerated even at a BMI which in the nonobese range. Observations on people of South Asian or Afro-American ethnicity confirm that substantial weight loss achieves remission in the same way as in the largely White Europeans studied in detail. Diagnosis of type 2 diabetes can now be regarded as an urgent signal that weight loss must be achieved to avoid a progressive decline of health.
Keywords: aetiology; liver fat; pancreas fat; personal fat threshold; remission; type 2 diabetes; weight loss.
© 2020 The Authors. Journal of Internal Medicine published by John Wiley & Sons Ltd on behalf of Association for Publication of The Journal of Internal Medicine.
Conflict of interest statement
RT reports lecture fees from Lilly and Novartis, consultancy fees from Wilmington Healthcare, membership of the UK Government Scientific Committee on Nutrition working group on low‐carbohydrate diets and is author of the book ‘Life Without Diabetes’.
Figures


Similar articles
-
Remission of Human Type 2 Diabetes Requires Decrease in Liver and Pancreas Fat Content but Is Dependent upon Capacity for β Cell Recovery.Cell Metab. 2018 Oct 2;28(4):547-556.e3. doi: 10.1016/j.cmet.2018.07.003. Epub 2018 Aug 2. Cell Metab. 2018. PMID: 30078554 Clinical Trial.
-
Calorie restriction for long-term remission of type 2 diabetes.Clin Med (Lond). 2019 Jan;19(1):37-42. doi: 10.7861/clinmedicine.19-1-37. Clin Med (Lond). 2019. PMID: 30651243 Free PMC article. Review.
-
Aetiology of Type 2 diabetes in people with a 'normal' body mass index: testing the personal fat threshold hypothesis.Clin Sci (Lond). 2023 Aug 31;137(16):1333-1346. doi: 10.1042/CS20230586. Clin Sci (Lond). 2023. PMID: 37593846 Free PMC article.
-
Banting Memorial lecture 2012: reversing the twin cycles of type 2 diabetes.Diabet Med. 2013 Mar;30(3):267-75. doi: 10.1111/dme.12039. Diabet Med. 2013. PMID: 23075228 Free PMC article.
-
Understanding the mechanisms of reversal of type 2 diabetes.Lancet Diabetes Endocrinol. 2019 Sep;7(9):726-736. doi: 10.1016/S2213-8587(19)30076-2. Epub 2019 May 13. Lancet Diabetes Endocrinol. 2019. PMID: 31097391 Review.
Cited by
-
Navigating the Predictive Landscape: DiaRem's Role in Unveiling Outcomes for Diabetes Remission following ESG.Obes Surg. 2024 Sep;34(9):3358-3365. doi: 10.1007/s11695-024-07408-w. Epub 2024 Aug 8. Obes Surg. 2024. PMID: 39117857
-
Pioglitazone Reverses Markers of Islet Beta-Cell De-Differentiation in db/db Mice While Modulating Expression of Genes Controlling Inflammation and Browning in White Adipose Tissue from Insulin-Resistant Mice and Humans.Biomedicines. 2021 Sep 10;9(9):1189. doi: 10.3390/biomedicines9091189. Biomedicines. 2021. PMID: 34572374 Free PMC article.
-
The research progress and future directions in the pathophysiological mechanisms of type 2 diabetes mellitus from the perspective of precision medicine.Front Med (Lausanne). 2025 Mar 5;12:1555077. doi: 10.3389/fmed.2025.1555077. eCollection 2025. Front Med (Lausanne). 2025. PMID: 40109716 Free PMC article.
-
Role of weight loss-induced prediabetes remission in the prevention of type 2 diabetes: time to improve diabetes prevention.Diabetologia. 2024 Aug;67(8):1714-1718. doi: 10.1007/s00125-024-06178-5. Epub 2024 May 23. Diabetologia. 2024. PMID: 38780785 Free PMC article. No abstract available.
-
Pancreatic islet protection at the expense of secretory function involves serine-linked mitochondrial one-carbon metabolism.Cell Rep. 2023 Jun 27;42(6):112615. doi: 10.1016/j.celrep.2023.112615. Epub 2023 Jun 8. Cell Rep. 2023. PMID: 37294632 Free PMC article.
References
-
- Himsworth HP. Diet in the aetiology of human diabetes. Proc Royal Soc Med 1949; 42: 323–6.
-
- Franco M, Bilal U, Ordunez P et al. Population‐wide weight loss and regain in relation to diabetes burden and cardiovascular mortality in Cuba 1980–2010: repeated cross sectional surveys and ecological comparison of secular trends. Brit Med J 2013; 346: f1515. - PubMed
-
- Schulz LO, Bennett PH, Ravussin E et al. Effects of traditional and western environments on prevalence of type 2 diabetes in Pima Indians in Mexico and the U.S. Diabetes Care 2006; 29: 1866–71. - PubMed
-
- Taylor R. Pathogenesis of Type 2 diabetes: Tracing the reverse route from cure to cause. Diabetologia 2008; 51: 1781–9. - PubMed
-
- Sattar N, McConnachie A, Ford I et al. Serial metabolic measurements and conversion to type 2 diabetes in the west of Scotland coronary prevention study: specific elevations in alanine aminotransferase and triglycerides suggest hepatic fat accumulation as a potential contributing factor. Diabetes 2007; 56: 984–91. - PubMed
Publication types
MeSH terms
Substances
LinkOut - more resources
Full Text Sources
Medical

