. 2020 Dec 18;9(12):3267-3287.
doi: 10.1021/acssynbio.0c00326. Epub 2020 Dec 8.

Analysis of Complex DNA Rearrangements during Early Stages of HAC Formation

Affiliations

Analysis of Complex DNA Rearrangements during Early Stages of HAC Formation

Elisa Pesenti et al. ACS Synth Biol. .

Abstract

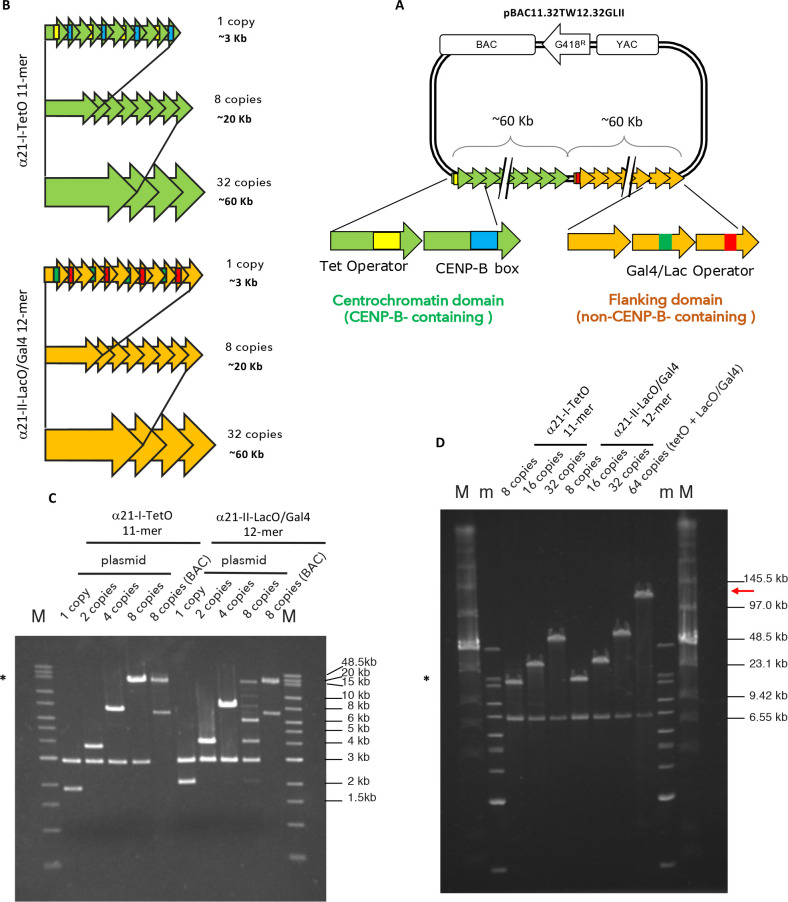
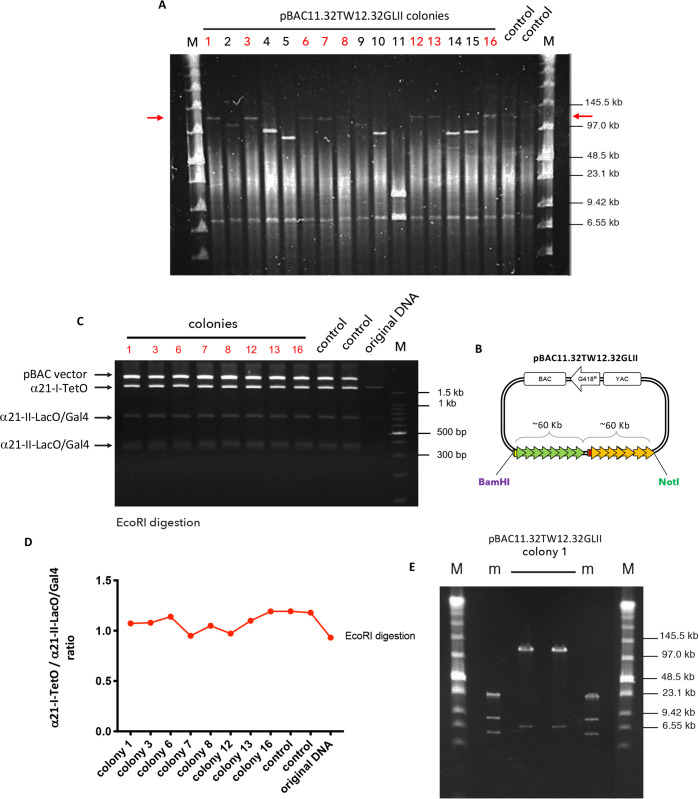
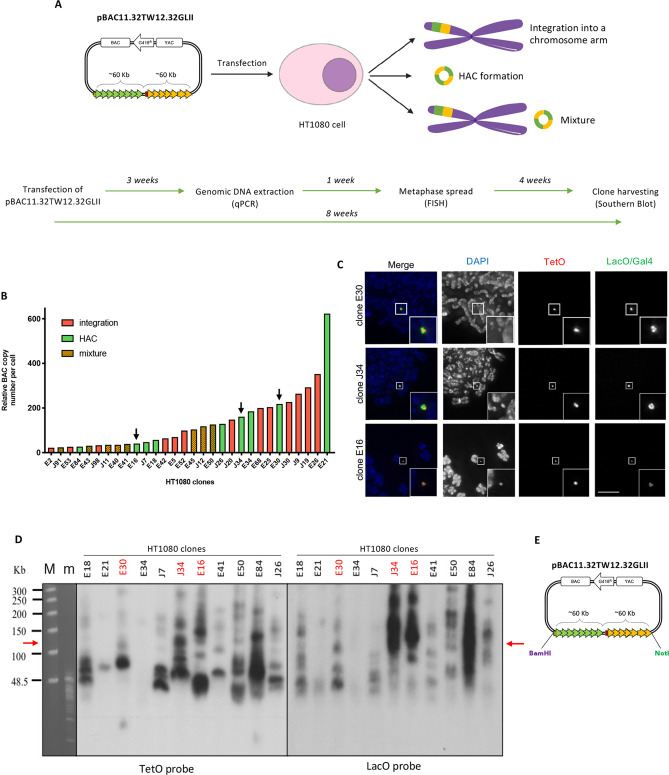
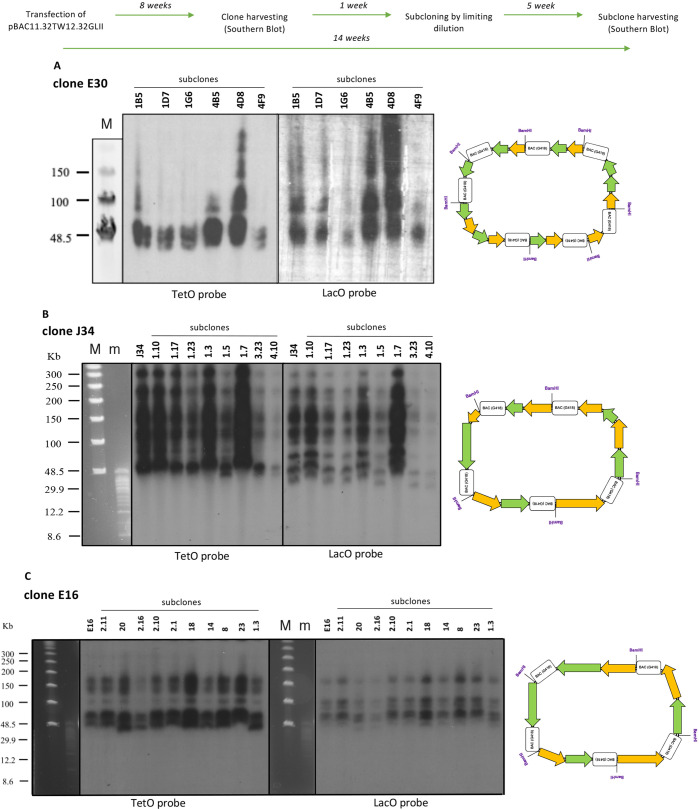
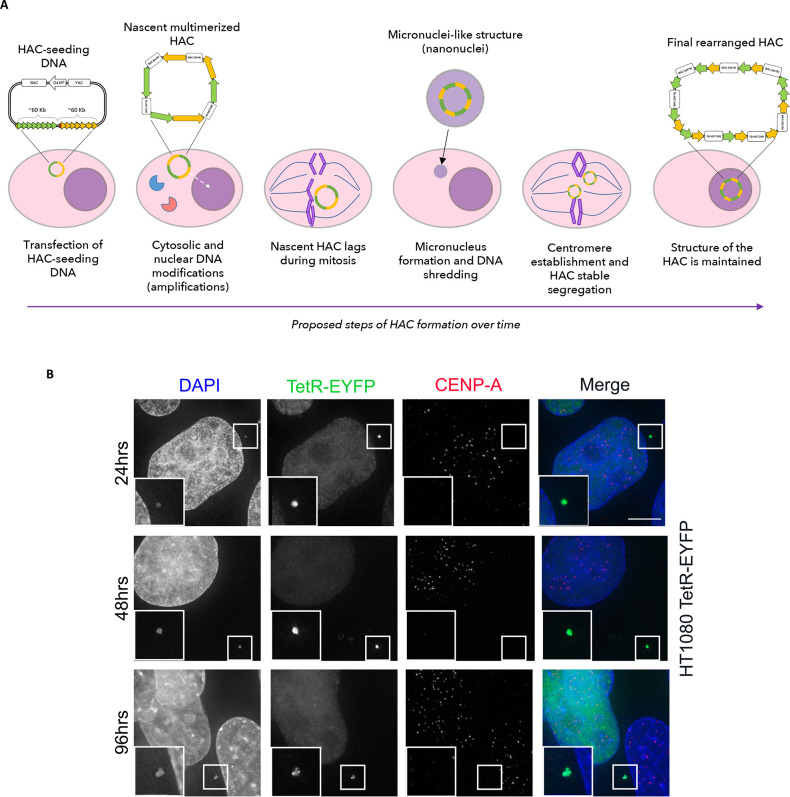
Human artificial chromosomes (HACs) are important tools for epigenetic engineering, for measuring chromosome instability (CIN), and for possible gene therapy. However, their use in the latter is potentially limited because the input HAC-seeding DNA can undergo an unpredictable series of rearrangements during HAC formation. As a result, after transfection and HAC formation, each cell clone contains a HAC with a unique structure that cannot be precisely predicted from the structure of the HAC-seeding DNA. Although it has been reported that these rearrangements can happen, the timing and mechanism of their formation has yet to be described. Here we synthesized a HAC-seeding DNA with two distinct structural domains and introduced it into HT1080 cells. We characterized a number of HAC-containing clones and subclones to track DNA rearrangements during HAC establishment. We demonstrated that rearrangements can occur early during HAC formation. Subsequently, the established HAC genomic organization is stably maintained across many cell generations. Thus, early stages in HAC formation appear to at least occasionally involve a process of DNA shredding and shuffling that resembles chromothripsis, an important hallmark of many cancer types. Understanding these events during HAC formation has critical implications for future efforts aimed at synthesizing and exploiting synthetic human chromosomes.

Keywords: CENP-A; centromere; epigenetic engineering; human artificial chromosome; kinetochore; mitosis.


Conflict of interest statement

The authors declare no competing financial interest.

Figures

Figure 1
Figure 1
Generation of synthetic α21-ITetO and α21-IILacO/Gal4 arrays. (A) Scheme of the pBAC11.32TW12.32GLII containing BAC and YAC cassettes, G418 resistance cassette, and synthetic DNA: α21-ITetO formed by high ordered repeats (HOR) monomers (green arrows) containing CENP-B boxes (blue) alternating with monomers containing TetO (yellow); α21-IILacO/Gal4 formed by high ordered repeats (HOR) monomers (yellow arrows) containing Gal4 binding sequence (green) alternating with LacO (red). (B) Schematic of the assembly of the α21-ITetO and α21-IILacO/Gal4 arrays. (C,D) PFGE analysis of the nascent α21-ITetO and α21-IILacO/Gal4 arrays, cut with BamHI/NotI after each cycles of tandem ligation array amplification as described in Figure S2A (C) and Figure S2B (D). Expected sizes: α21-ITetO11-mer 1 copy (1.9 kb), 8 copies (15.2 kb), 32 copies (60.8 kb); α21-IILacO/Gal412-mer 1 copy (2 kb), 8 copies (16 kb), 32 copies (64 kb). Plasmid vector is 2.9 kb, BAC vector is 7.1 kb. The asterisk (*) indicates the fragments that have been cloned into BAC vector (8 copies, 16 kb); red arrow in D indicates the size of the final pBAC11.32TW12.32GLII (∼120 kb) (m and M, markers).
Figure 2
Figure 2
Formation of input pBAC11.32TW12.32GLII DNA. (A) CHEF analysis of 16 bacterial DNA after transformation with pBAC11.32TW12.32GLII and NotI and BamHI digestion: red arrows indicate the size of the final vector (∼120 kb); colonies labeled in red contain the inset of the desired length. DNA used for transfection as a control (in duplicate) (M marker). (B) Scheme of the pBAC11.32TW12.32GLII input DNA showing restriction sites for NotI and BamHI used to release the synthetic DNA. (C) PFGE analysis of selected bacterial colonies (in red) digested with EcoRI: each fragment originates from a different array (label on the left). DNA used for transfection as a control (in duplicate); original DNA as uncut sample (M marker). (D) α21-ITetO and α21-IILacO/Gal4DNA ratio calculated with ImageJ on the intensity of the bands shown in C for each bacterial colony. Control and original DNA as in C. (E) CHEF analysis of bacterial colony #1 DNA (in duplicate) digested with NotI and BamHI to release the synthetic DNA (m and M, markers).
Figure 3
Figure 3
Screening of HT1080 colonies after transfection with pBAC11.32TW12.32GLII. (A) Scheme showing the possible fates of the pBAC11.32TW12.32GLII HAC seeding DNA after transfection in HT1080: in yellow and green (as integration or HAC) is represented the synthetic DNA. Timeline of the experiments performed from transfection into HT1080 cells. (B) BAC copy number (y axis) analyzed by qPCR in each HT1080 clone (x axis): only HT1080 clones containing >20 BAC copies are represented in the graph. HT1080 clones are represented in green (HAC), red (integration), or mixture (both) according to the results of the FISH screening, as shown in C. Black arrows indicate the clones shown in C and analyzed further. (C) Representative pictures of oligo-FISH staining of HT1080 clones: slides have been hybridized with DNA probes (TetO-dig/rhodamine α-dig antibody, Gal4-biotin and LacO-biotin/Fitc-streptavidin). DAPI stains DNA. Scale bar = 10 μm. (D) Southern blot of selected HT1080 clonal DNA (as labeled on top of the panel) digested with BamHI and separated by CHEF; the transferred membrane was hybridized with radioactively labeled TetO (left) or LacO (right) specific probes. Red arrows indicate the expected size of the band without rearrangements. Clones labeled in red have been screened further (M and m, markers). (E) Cartoon of the pBAC11.32TW12.32GLII input DNA showing restriction sites for NotI and BamHI.
Figure 4
Figure 4
Analysis of rearrangements of the pBAC11.32TW12.32GLII arrays. Timeline of the experiments performed from transfection into HT1080 clones and subclones. (A,B,C) Southern blot of subclones from clone E30 (A), J34 (B) and E16 (C): DNA was digested with BamHI and separated by CHEF. The transferred membrane was hybridized with radioactively labeled TetO (left) or LacO (right) specific probes. Cartoons on the right represent the outcome of rearrangements in the corresponding clone: green arrows represent α21-ITetO array, yellow arrows represent α21-IILacO/Gal4 array, boxes represent the BAC vector (M and m, markers).
Figure 5
Figure 5
Visualization of α21-ITetO and α21-IILacO/Gal4 arrays on chromatin fibers and mitotic stability of the HAC. (A) Representative pictures of IF staining on fibers of subclone J34 1.10: slides have been incubated with TetR-eYFP and LacI-eYFP expressed in E. coli and stained with α-CENP-A mouse or α-H3K9me3 mouse/TRITC α-mouse antibody. DAPI stains the DNA. Scale bar = 5 μm. (B) Number of metaphases (%) containing 0, 1, or ≥2 (2 or 3) HACs for subclones E30 1B5, J34 1.10 and E16 23, after spreading metaphases and hybridizing with TetO and LacO/Gal4 specific probes; total of 2 biological repeats, 50 metaphases for each condition were analyzed. ± Gen indicates treatment for 30 days from day 0 with (+) or without (−) Geneticin. Error bars denote SEM. Statistical test: unpaired t test (*P < 0.05, **P < 0.01).
Figure 6
Figure 6
CENP-A accumulates preferentially on the α21-ITetO array. (A,B,C) ChIP-qPCR analysis of CENP-A and indicated histone marks modifications in HT1080 subclones E30 1B5 (A), J34 1.10 (B), and E16 23 (C). The α21-ITetO array (TetO), α21-IILacO/Gal4 array (LacOGal4), satellite D17Z1 (chr17), and degenerate satellite II (sat2) repeats were assessed. Values have been normalized against satellite D17Z1 (chr17). Total of 2 biological repeats, n ≈ 5 × 10⁶ cells each. Error bars denote SEM. Statistical test: Mann–Whitney test (*P < 0.05). (D) Cartoon showing the localization of primers used in qPCR on the HAC and on endogenous corresponding chromosomes.
Figure 7
Figure 7
α21-ITetO and α21-IILacO/Gal4 arrays are not functionally independent. (A,B) Quantification of HAC-associated CENP-A staining (A) and H3K9me3 staining (B) in individual cells of each indicated HT1080 subclone 48 h after transfection with the indicated fusion proteins; values plotted as A.F.U. (arbitrary forming units). Solid bars indicate the medians, and error bars represent the SD; n = two independent experiments for each staining; ∼30 cells analyzed in each experiment. Asterisks indicate a significant difference (*P < 0.05, **P < 0.01, ***P < 0.001, ****P < 0.0001; Mann–Whitney test). (C) Number of interphase nuclei (%) showing correct segregation (1 HAC) or mis-segregation (0 or 2 HACs) of each indicated HT1080 subclone 48 h after transfection with the indicated fusion proteins; the presence of the HAC was detected by GFP signal. n = 500 cells analyzed per condition (****P < 0.001; Fisher’s exact test).
Figure 8
Figure 8
Early stages of alphoid2domain HAC formation. (A) Scheme representing how HAC-seeding DNA rearranges to form the alphoid2domain HAC. HAC-seeding DNA formed by α21-ITetO (green) and α21-IILacO/Gal4 (yellow) arrays is transfected in HT1080 cells; under the effect of proteins of the DNA-sensing pathways (elements in red and blue), the nascent HAC gets initially rearranges and it increases in size due to “slippage” during replication (dashed arrow indicates nascent HAC entering the nucleus). During mitosis, the nascent HAC lags and it gets therefore incorporated into a micronucleus, resulting in additional massive rearrangements which lead to the final structure of the alphoid2domain HAC. (B) Indirect immunofluorescence of HT1080 cells constitutively expressing TetR-EYFP at indicated time points after transfection with HAC-seeding DNA. After fixation, cells were stained for CENP-A; DAPI stains the nuclei. Enlargements show nanonuclei containing HACs (green bright spots). Scale bar = 10 μm.

References

    1. Harrington J. J.; Van Bokkelen G.; Mays R. W.; Gustashaw K.; Willard H. F. (1997) Formation of de Novo Centromeres and Construction of First-Generation Human Artificial Microchromosomes. Nat. Genet. 15, 345.10.1038/ng0497-345. - DOI - PubMed
    1. Nakano M.; Cardinale S.; Noskov V. N.; Gassmann R.; Vagnarelli P.; Kandels-Lewis S.; Larionov V.; Earnshaw W. C.; Masumoto H. (2008) Inactivation of a Human Kinetochore by Specific Targeting of Chromatin Modifiers. Dev. Cell 14, 507.10.1016/j.devcel.2008.02.001. - DOI - PMC - PubMed
    1. Kouprina N.; Samoshkin A.; Erliandri I.; Nakano M.; Lee H. S.; Fu H.; Iida Y.; Aladjem M.; Oshimura M.; Masumoto H.; Earnshaw W. C.; Larionov V. (2012) Organization of Synthetic Alphoid DNA Array in Human Artificial Chromosome (HAC) with a Conditional Centromere. ACS Synth. Biol. 1, 590.10.1021/sb3000436. - DOI - PMC - PubMed
    1. Pesenti E.; Kouprina N.; Liskovykh M.; Aurich-Costa J.; Larionov V.; Masumoto H.; Earnshaw W. C.; Molina O. (2018) Generation of a Synthetic Human Chromosome with Two Centromeric Domains for Advanced Epigenetic Engineering Studies. ACS Synth. Biol. 7, 1116.10.1021/acssynbio.8b00018. - DOI - PMC - PubMed
    1. Lee N. C. O.; Kim J. H.; Petrov N. S.; Lee H. S.; Masumoto H.; Earnshaw W. C.; Larionov V.; Kouprina N. (2018) Method to Assemble Genomic DNA Fragments or Genes on Human Artificial Chromosome with Regulated Kinetochore Using a Multi-Integrase System. ACS Synth. Biol. 7, 63.10.1021/acssynbio.7b00209. - DOI - PMC - PubMed

Publication types

Substances