

Stratification of athletes' gut microbiota: the multifaceted hubs associated with dietary factors, physical characteristics and performance
- PMID: 33289609
- PMCID: PMC7734118
- DOI: 10.1080/19490976.2020.1842991
Stratification of athletes' gut microbiota: the multifaceted hubs associated with dietary factors, physical characteristics and performance
Abstract
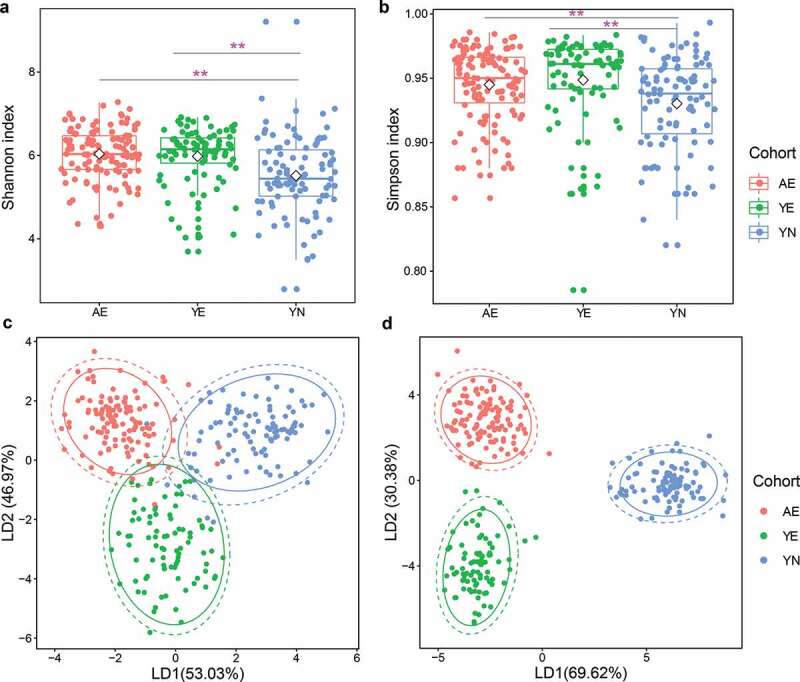
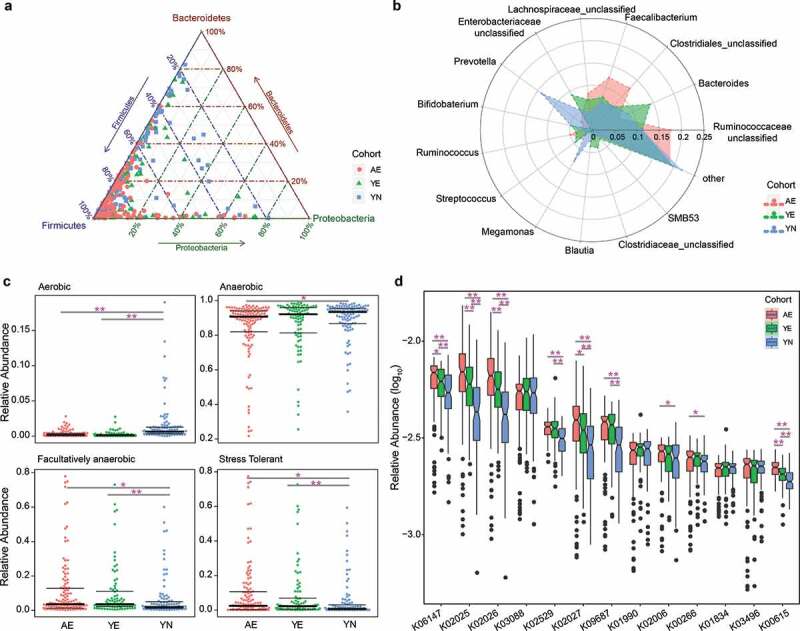
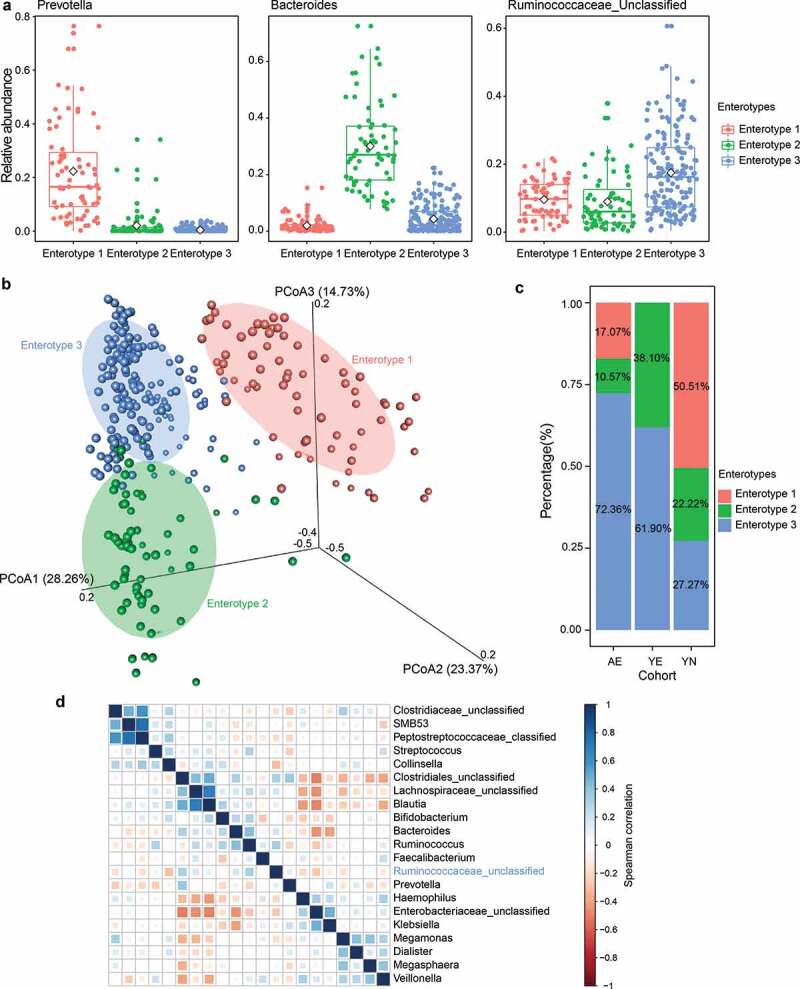
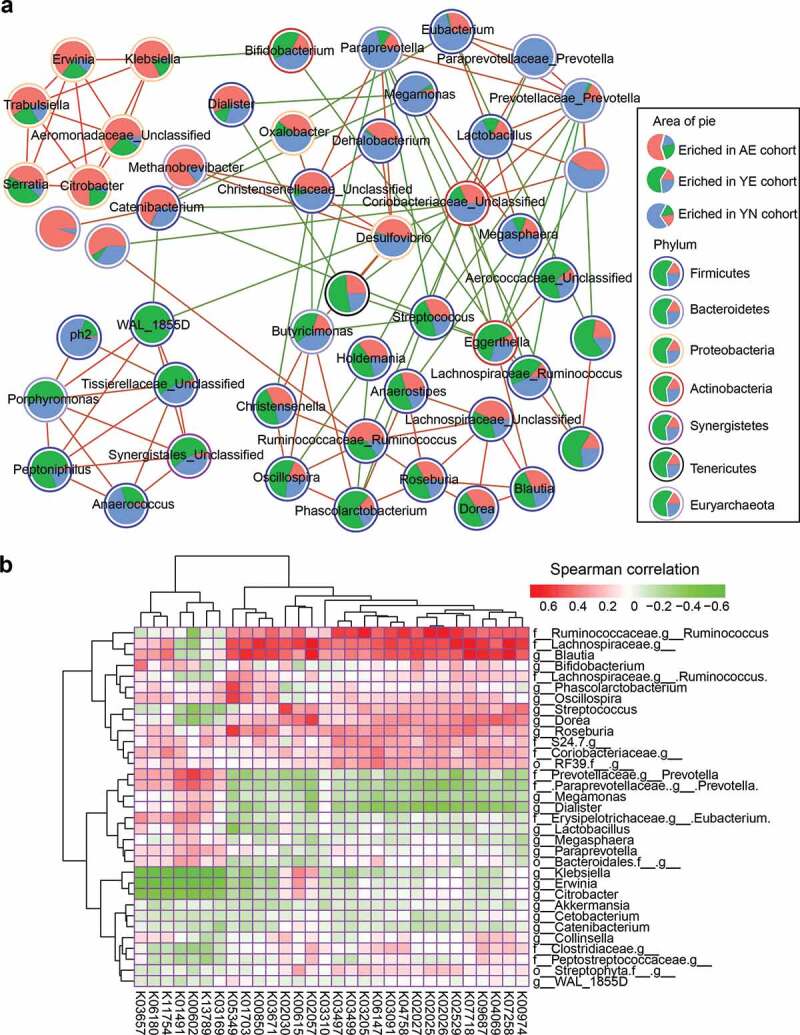
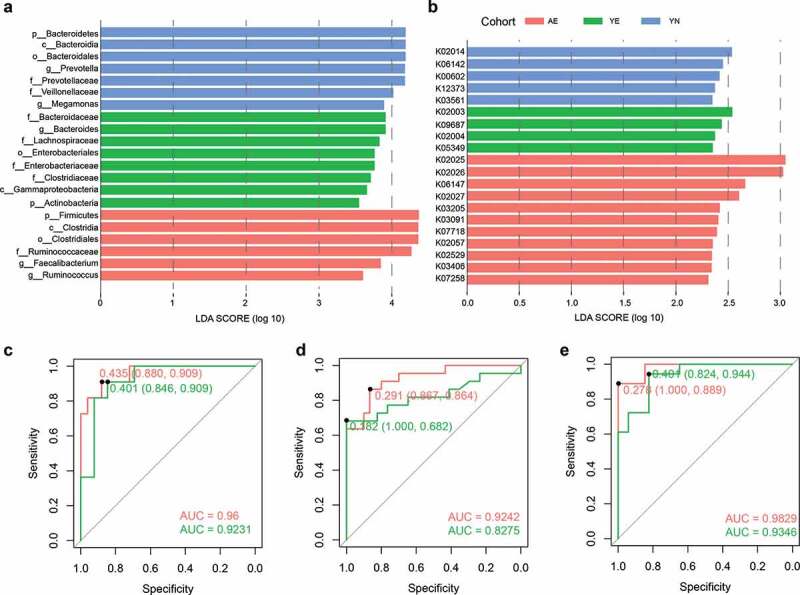
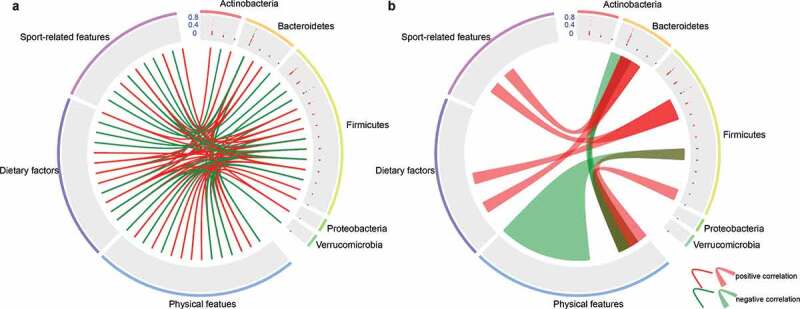
Gut microbial communities of athletes differ from that of sedentary persons in both diversity and the presence of certain taxa. However, it is unclear to what degree elite athletes and non-elite athletes harbor different gut microbial community patterns and if we can effectively monitor the potential of athletes based on microbiota. A team of professional female rowing athletes in China was recruited and 306 fecal samples were collected from 19 individuals, which were separated into three cohorts: adult elite athlete's (AE), youth elite athlete's (YE), and youth non-elite athlete's (YN). The differences in gut microbiome among different cohorts were compared, and their associations with dietary factors, physical characteristics, and athletic performance were investigated. The microbial diversities of elite athletes were higher than those of youth non-elite athletes. The taxonomical, functional, and phenotypic compositions of AE, YE and YN were significantly different. Additionally, three enterotypes with clear separation were identified in athlete's fecal samples, with majority of elite athletes stratified into enterotype 3. And this enterotype-dependent gut microbiome is strongly associated with athlete performances. These differences in athlete gut microbiota lead to establishment of a random forest classifier based on taxonomical and functional biomarkers, capable of differentiating elite athletes and non-elite athletes with high accuracy. Finally, these versatilities of athlete microbial communities of athletes were found to be associated with dietary factors and physical characteristics, which can in concert explain 41% of the variability in gut microbiome.
Keywords: Athlete gut microbiota; athletic performances; dietary factors; enterotype; physical characteristics; random forest classifier.
Figures
Similar articles
-
Gut microbiota and inflammation patterns for specialized athletes: a multi-cohort study across different types of sports.mSystems. 2023 Aug 31;8(4):e0025923. doi: 10.1128/msystems.00259-23. Epub 2023 Jul 27. mSystems. 2023. PMID: 37498086 Free PMC article.
-
The combination of sport and sport-specific diet is associated with characteristics of gut microbiota: an observational study.J Int Soc Sports Nutr. 2019 May 3;16(1):21. doi: 10.1186/s12970-019-0290-y. J Int Soc Sports Nutr. 2019. PMID: 31053143 Free PMC article.
-
Dietary Patterns, Gut Microbiota and Sports Performance in Athletes: A Narrative Review.Nutrients. 2024 May 26;16(11):1634. doi: 10.3390/nu16111634. Nutrients. 2024. PMID: 38892567 Free PMC article. Review.
-
The athlete gut microbiota: state of the art and practical guidance.Benef Microbes. 2024 Apr 26;15(2):97-126. doi: 10.1163/18762891-bja00007. Benef Microbes. 2024. PMID: 38659188 Review.
-
Intestinal Microbiota Interventions to Enhance Athletic Performance-A Review.Int J Mol Sci. 2024 Sep 19;25(18):10076. doi: 10.3390/ijms251810076. Int J Mol Sci. 2024. PMID: 39337561 Free PMC article. Review.
Cited by
-
Impacts of Maternal Diet and Alcohol Consumption during Pregnancy on Maternal and Infant Gut Microbiota.Biomolecules. 2021 Mar 1;11(3):369. doi: 10.3390/biom11030369. Biomolecules. 2021. PMID: 33804345 Free PMC article.
-
Expanded catalogue of metagenome-assembled genomes reveals resistome characteristics and athletic performance-associated microbes in horse.Microbiome. 2023 Jan 12;11(1):7. doi: 10.1186/s40168-022-01448-z. Microbiome. 2023. PMID: 36631912 Free PMC article.
-
The effect of Phyllanthus emblica (Amla) fruit supplementation on the rumen microbiota and its correlation with rumen fermentation in dairy cows.Front Microbiol. 2024 May 13;15:1365681. doi: 10.3389/fmicb.2024.1365681. eCollection 2024. Front Microbiol. 2024. PMID: 38803380 Free PMC article.
-
Microbial Champions: The Influence of Gut Microbiota on Athletic Performance via the Gut-Brain Axis.Open Access J Sports Med. 2024 Dec 13;15:209-228. doi: 10.2147/OAJSM.S485703. eCollection 2024. Open Access J Sports Med. 2024. PMID: 39691802 Free PMC article. Review.
-
Summatory Effects of Anaerobic Exercise and a 'Westernized Athletic Diet' on Gut Dysbiosis and Chronic Low-Grade Metabolic Acidosis.Microorganisms. 2024 Jun 3;12(6):1138. doi: 10.3390/microorganisms12061138. Microorganisms. 2024. PMID: 38930520 Free PMC article. Review.
References
Publication types
MeSH terms
LinkOut - more resources
Full Text Sources