. 2020 Dec 8;83(1):1.
doi: 10.1007/s11538-020-00834-8.

Sequential Data Assimilation of the Stochastic SEIR Epidemic Model for Regional COVID-19 Dynamics

Affiliations

Sequential Data Assimilation of the Stochastic SEIR Epidemic Model for Regional COVID-19 Dynamics

Ralf Engbert et al. Bull Math Biol. .

Abstract

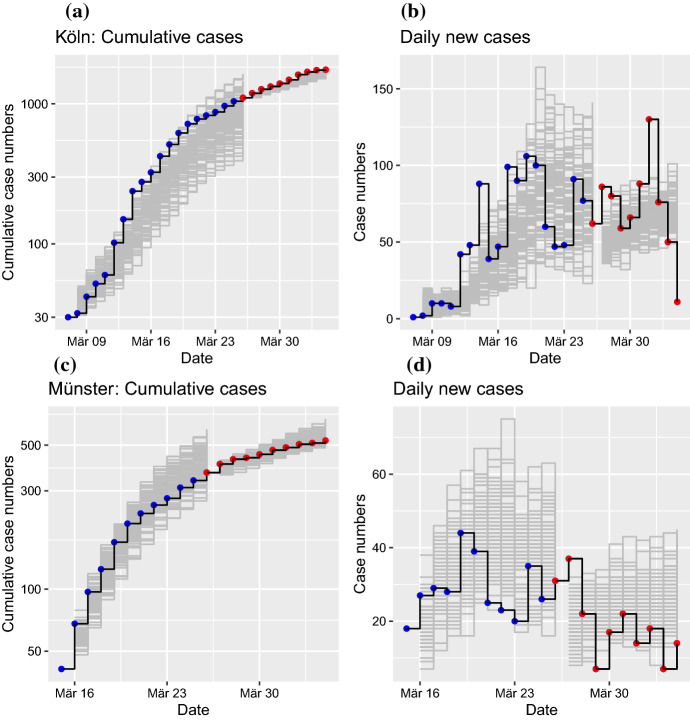
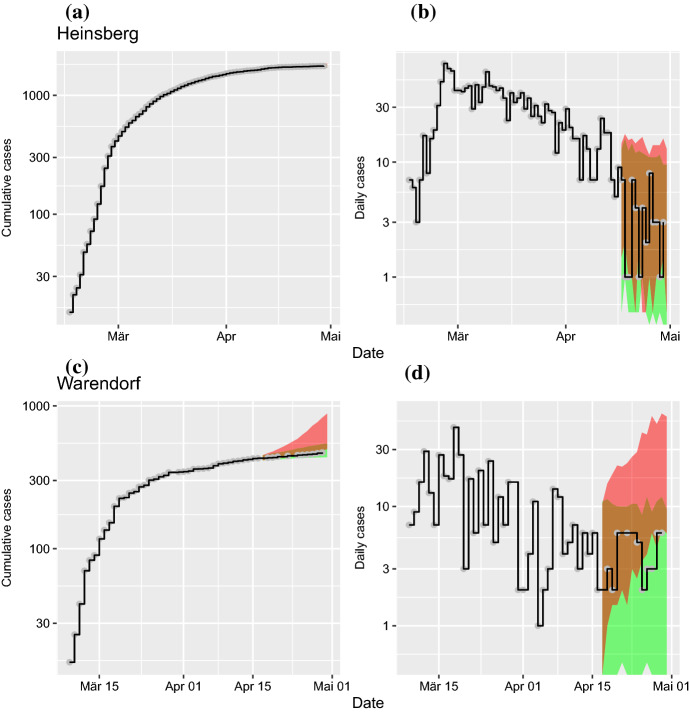
Newly emerging pandemics like COVID-19 call for predictive models to implement precisely tuned responses to limit their deep impact on society. Standard epidemic models provide a theoretically well-founded dynamical description of disease incidence. For COVID-19 with infectiousness peaking before and at symptom onset, the SEIR model explains the hidden build-up of exposed individuals which creates challenges for containment strategies. However, spatial heterogeneity raises questions about the adequacy of modeling epidemic outbreaks on the level of a whole country. Here, we show that by applying sequential data assimilation to the stochastic SEIR epidemic model, we can capture the dynamic behavior of outbreaks on a regional level. Regional modeling, with relatively low numbers of infected and demographic noise, accounts for both spatial heterogeneity and stochasticity. Based on adapted models, short-term predictions can be achieved. Thus, with the help of these sequential data assimilation methods, more realistic epidemic models are within reach.

Keywords: COVID-19; Ensemble Kalman filter; Sequential data assimilation; Stochastic epidemic model.


Figures

Fig. 1
Fig. 1
The SEIR model. The population is divided into four compartments that represent susceptible, exposed, infectious, and recovered individuals. The contact parameter β is critical for disease transmission, and 1/a and 1/g are the average durations of exposed and infectious periods, respectively. Unlike in the standard model, the birth and death processes are neglected in short-term simulations discussed throughout the current study
Fig. 2
Fig. 2
(Color figure online)Parameter recovery analysis. a Simulated data with b=0.6. b Negative log-likelihood Lcum(β) indicates a minimum at about the true parameter value
Fig. 3
Fig. 3
(Color figure online)Contact parameter estimates for real data. a Data for Köln; date refers to report of case at RKI. b Negative log-likelihood Lcum(β) for Köln give a minimum at β0.7
Fig. 4
Fig. 4
(Color figure online) Analysis of best fit time-dependent contact parameters β(tk); date refers to report of case at RKI. a For two regions (LK Köln and LK Münster), the cumulative numbers show a strong increase after different disease onset times. b Semi-logarithmic scaling suggests approximate exponential growth in early as well as later regimes. c The time-dependent contact parameter β(tk) indicates a small decrease over time due to social distancing interventions (black: average for 320 regions; red, blue: contact parameter for the examples above; gray shading: standard deviation across regions. d Scatter plot of the time averaged contact parameter βpre before intervention and βpost after intervention. Note that the critical value for disease containment is βcrit=1/3 per day in our model (red lines)
Fig. 5
Fig. 5
(Color figure online) Simulations of the stochastic SEIR model for two example regions. Simulations I indicate an ensemble of 100 runs of the model with initial conditions from the first epidemic day with number of cases greater than or equal to 30 (gray: ensemble of trajectories; blue: observations). Simulations II start at March 26, using an ensemble size of 100 after data assimilation (gray: ensemble of trajectories; red: observations). a Cumulative cases of infected individuals over time for LK Köln. b Daily reported new cases for Köln. c Cumulative cases for LK Münster. d Daily new cases for Münster. Date refers to report of case at RKI
Fig. 6
Fig. 6
(Color figure online) Model predictions for COVID-19 after data assimilation in comparison to data (black lines). In scenario I (green area), an assimilated ensemble of internal model states starts the forecast with contact parameter βpost (continuation of social distancing interventions). In scenario II (red area), the equivalent forecast is generated with contact parameter βpre (termination of interventions). a Predictions for cumulative case numbers in Heinsberg. b Predictions of daily new cases in Heinsberg. c Predictions of cumulative cases for Warendorf. d Predictions of daily new cases for Warendorf. Date refers to report of case at RKI

References

    1. Anderson RM, Anderson B, May RM. Infectious diseases of humans: dynamics and control. Oxford: Oxford University Press; 1992.
    1. Anderson RM, Heesterbeek H, Klinkenberg D, Hollingsworth TD. How will country-based mitigation measures influence the course of the COVID-19 epidemic? Lancet. 2020;395(10228):931–934. doi: 10.1016/S0140-6736(20)30567-5. - DOI - PMC - PubMed
    1. Arenas A, Cota W, Gomez-Gardenes J, Gómez S, Granell C, Matamalas JT, Soriano-Panos D, Steinegger B (2020) A mathematical model for the spatiotemporal epidemic spreading of COVID19. medRxiv:2020.03.21.20040022
    1. Bauer P, Thorpe A, Brunet G. The quiet revolution of numerical weather prediction. Nature. 2015;525(7567):47–55. doi: 10.1038/nature14956. - DOI - PubMed
    1. Bittihn P, Golestanian R (2020) Containment strategy for an epidemic based on fluctuations in the sir model. preprint arXiv:2003.08784

Publication types