

Phosphoproteomics identifies microglial Siglec-F inflammatory response during neurodegeneration
- PMID: 33289969
- PMCID: PMC7722784
- DOI: 10.15252/msb.20209819
Phosphoproteomics identifies microglial Siglec-F inflammatory response during neurodegeneration
Abstract
Alzheimer's disease (AD) is characterized by the appearance of amyloid-β plaques, neurofibrillary tangles, and inflammation in brain regions involved in memory. Using mass spectrometry, we have quantified the phosphoproteome of the CK-p25, 5XFAD, and Tau P301S mouse models of neurodegeneration. We identified a shared response involving Siglec-F which was upregulated on a subset of reactive microglia. The human paralog Siglec-8 was also upregulated on microglia in AD. Siglec-F and Siglec-8 were upregulated following microglial activation with interferon gamma (IFNγ) in BV-2 cell line and human stem cell-derived microglia models. Siglec-F overexpression activates an endocytic and pyroptotic inflammatory response in BV-2 cells, dependent on its sialic acid substrates and immunoreceptor tyrosine-based inhibition motif (ITIM) phosphorylation sites. Related human Siglecs induced a similar response in BV-2 cells. Collectively, our results point to an important role for mouse Siglec-F and human Siglec-8 in regulating microglial activation during neurodegeneration.
Keywords: Alzheimer's disease; Siglec-8; Siglec-F; microglia; phosphoproteomics.
© 2020 The Authors. Published under the terms of the CC BY 4.0 license.
Conflict of interest statement
The authors declare that they have no conflict of interest.
Figures
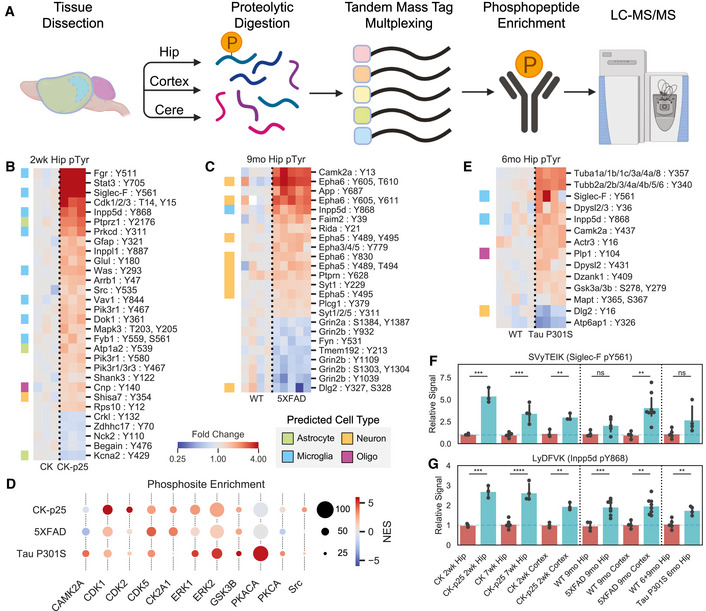
- A
Workflow showing phosphopeptide enrichment strategy. Brain regions were dissected from mice and then processed into proteolytic peptide digests and labeled for quantification with TMT. Phosphopeptides were then enriched and analyzed by liquid chromatography followed by tandem mass spectrometry.
- B, C
Heatmaps of enriched hippocampus phosphotyrosine peptides in hippocampus tissue from (B) CK‐p25 and (C) 5XFAD animal mice. Colors indicate fold change relative to control animals on a log2‐scale. Row colors (left) indicate peptides from predicted cell‐type‐specific proteins. Green = Astrocyte, Orange = Neuron, Blue = Microglia, Purple = Oligodendrocyte.
- D
Phosphosite enrichment analysis of phosphopeptides from CK‐p25, 5XFAD, and Tau mice. Circle colors indicate normalized enrichment scores (NES), and sizes indicate the number of observed sites in each substrate phospho‐set within each mouse model. Kinases enriched in at least one model are shown.
- E
Heatmap showing enriched hippocampus phosphotyrosine peptides from 6‐month‐old Tau P301S animals. Legend is same as (B).
- F, G
Relative abundances across all tissues for phosphotyrosine peptides: (F) SVyTEIK (Siglec‐F pY561); (G) LyDFVK (Inpp5d pY868). Bars indicate mean ± 95% confidence interval (CI); n = 3–8 samples; *P < 5e‐2, **P < 1e‐2, ***P < 1e‐3, ****P < 1e‐4; ns: not significant, using unpaired Student’s t‐test, two‐sided.
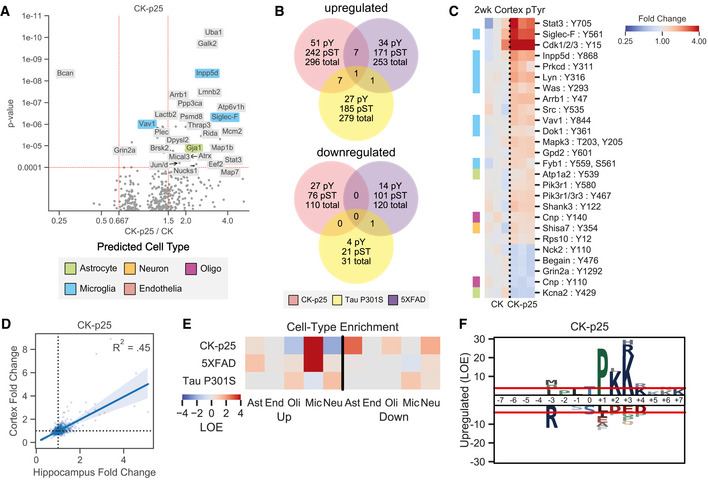
- A
Volcano plots showing changed phosphopeptides in CK‐p25 mice. All tissues and time points are considered together for fold change and p‐value calculations. Protein names are shown for changed peptides. Labels are only shown for peptides with maximum directional change from each protein. Labels are colored by predicted cell‐type specific protein. Green = Astrocyte, Orange = Neuron, Blue = Microglia, Purple = Oligodendrocyte, Salmon = Endothelia.
- B
Unique and overlapping peptides that are upregulated (FC > 1.25, P < 1e‐2) or downregulated (FC > .8, P < 1e‐2) within each mouse model. Venn colors are: Red = CK‐p25, Purple = 5XFAD, Yellow = Tau P301S.
- C
Heatmap showing phosphotyrosine peptides from the cortex of CK‐p25 animals. Colors indicate fold change relative to control animals on a log2‐scale. Row colors (left) indicate peptides from predicted cell‐type specific proteins using the same scheme as (A).
- D
Correlation between phosphopeptide fold changes in the hippocampus and cortex of 2wk CK‐p25 mice. Linear regression R2 value is shown on plot.
- E
Cell‐type enrichment analysis of phosphopeptides from CK‐p25, 5XFAD, and Tau animals. Heatmap colors indicate LOE of cell‐type specific proteins in the set of upregulated or downregulated phosphopeptides for each animal. Cell types are: Ast = Astrocyte; End = Endothelia; Oli = Oligodendrocyte, Mic = Microglia, Neu = Neuron.
- F
Phosphorylation motif logos for enriched peptides from the upregulated (FC > 1.25, P < 1e‐2) pSer/pThr phosphoproteome of CK‐p25 mice. Y‐axis shows log‐odds enrichment (LOE) of amino acids proximal to phosphorylation sites.
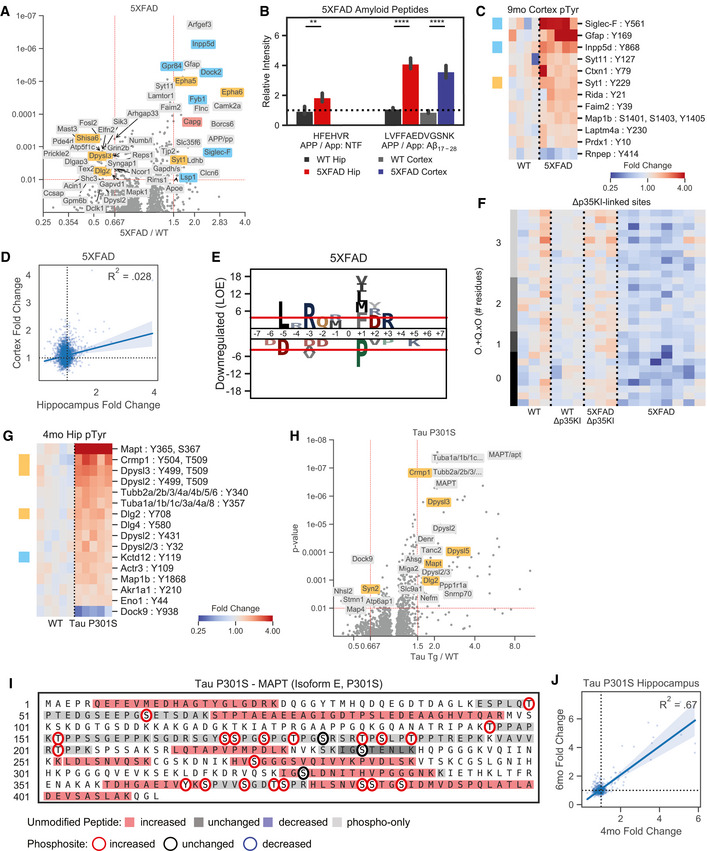
- A
Volcano plots showing changed phosphopeptides in 5XFAD animals. All tissues and time points are considered together for fold change and p‐value calculations. Protein names are shown for changed peptides. Labels are only shown for peptides with maximum directional change from each protein. Labels are colored by predicted cell=type specific protein. Orange–Neuron, Blue = Microglia, Salmon = Endothelia.
- B
Quantification of transgenic amyloid precursor protein peptides identified in the hippocampus and cortex from 5XFAD and WT mice: HFEHVR and LVFFAEDVGSNK. APP / App indicates peptides mapped to both transgenic and native protein. NTF: N‐terminal Fragment, Aβn‐m: peptide mapped within A.
- C
Heatmap showing enriched phosphotyrosine peptides in the cortex of 9 mo 5XFAD mice. Colors indicate fold change relative to control animals on a log2-scale. Row colors (left) indicate peptides from predicted cell-type specific proteins using the same scheme as (A).
- D
Correlation between phosphopeptide fold changes in the hippocampus and cortex of 9mo 5XFAD mice. Linear regression R2 value is shown on plot.
- E
Phosphorylation motif logos for enriched peptides from the downregulated (FC < .8, p < 1e‐2) pSer/pThr phosphoproteome of 5XFAD mice. Y‐axis shows log‐odds enrichment (LOE) of amino acids proximal to phosphorylation sites.
- F
Phosphopeptides associated with Δp35KI mutation in 5XFAD mice. Heatmap colors indicate log2 fold changes from hippocampus tissue. Row colors (left) indicate the number of residue positions for which peptides match the CaMKII motif: O.+Q.xO ‐, where ‘O’ indicates hydrophobic residues (FLMVI), ‘+’ indicates positively charged residues (KR), ‘×’ indicates a phosphosite, and ‘.’ indicates any residue. ‘×’ and ‘.’ are uncounted for motif scores.
- G
Volcano plots showing changed phosphopeptides in Tau P301S mice. All tissues and time points are considered together for fold change and p‐value calculations. Protein names are shown for changed peptides. Labels are only shown for peptides with maximum directional change from each protein. Labels are colored by predicted cell‐type specific protein. Orange = Neuron, Blue = Microglia.
- H
Heatmap showing enriched phosphotyrosine peptides in Tau P301S 4mo hippocampus tissues. Colors indicate fold change relative to control animals on a log2‐scale. Row colors (left) indicate peptides from predicted cell‐type specific proteins using the same scheme as (A).
- I
Transgenic MAPT peptides identified in Tau P301S mice. Colored bars indicate directional changes for non‐phosphorylated peptides. Red = increased, blue = decreased, grey = unchanged, light‐grey = only phosphopeptides were seen in that region. Colored circles indicate phosphorylation sites that were quantified. Red circle = increased, blue circle = decreased, black circle = unchanged.
- J
Correlation between phosphopeptide fold changes in hippocampus tissues of 4mo and 6mo Tau P301S mice. Linear regression R2 value is shown on plot.
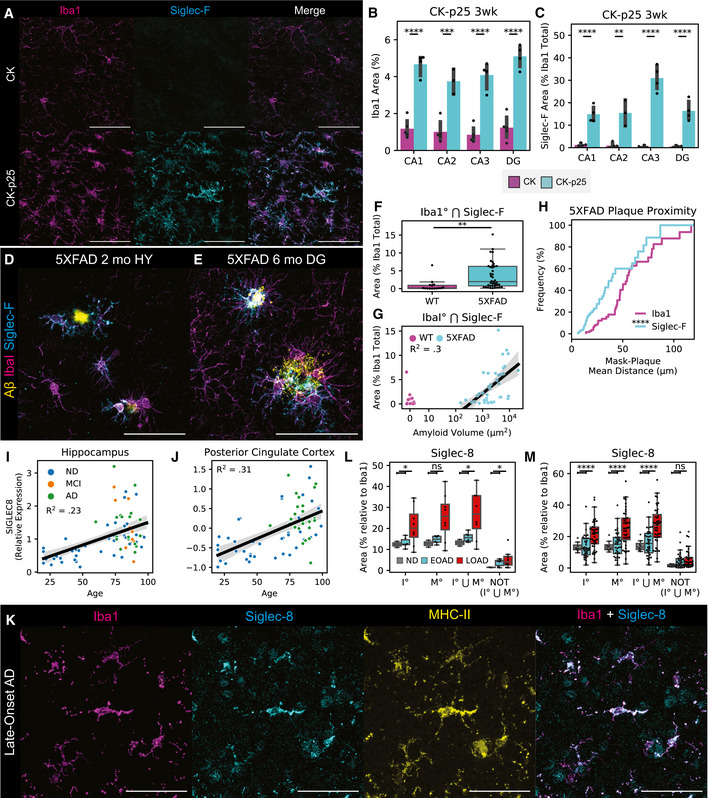
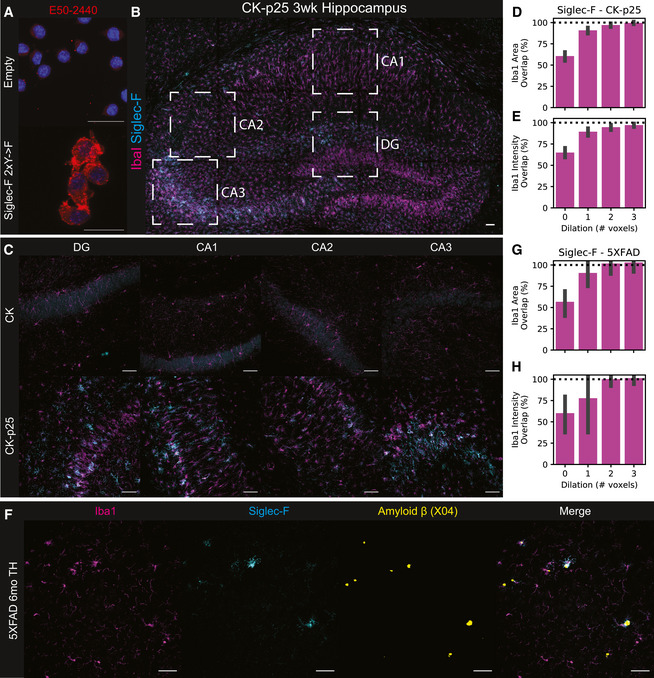
- A
Immunofluorescence (IF) staining showing Siglec‐F and Iba1 localization in hippocampus CA3 region of 3wk induced CK (top) or CK‐p25 (bottom) mice. Scale bars = 50 μm. Colors are: Magenta = Iba1, Cyan = Siglec‐F. Images are 60× super‐resolution max z‐stack projections taken from coronal slices.
- B, C
Percent area coverage of (B) Iba1 and (C) Iba1‐proximal Siglec‐F between CK and CK‐p25 mice across hippocampal regions. Bars indicate mean ± 95% CI; n = 3‐4 animals; *P < 5e‐2, **P < 1e‐2, ***P < 1e‐3, ****P < 1e‐4; ns: not significant, using unpaired Student’s t‐test, two‐sided.
- D, E
IF staining of Siglec‐F and Iba1 in (D) 5XFAD 2 month hypothalamus (HY) and (E) 5XFAD 6 month dentate gyrus (DG). Yellow = Aβ from methoxy X04 (D) or D54D2 (E). Scale bars = 50 μm.
- F
Percent area coverage of Iba1‐proximal Siglec‐F relative to total Iba1 across all analyzed thalamic, cortical, and hippocampal regions of 6‐month WT (non‐Tg) and 5XFAD mice. Box indicates quartiles, and whiskers indicate the last datum within 1.5 inter‐quartile range; n = 15‐40 images (3‐5 animals); *P < 5e‐2, **P < 1e‐2, ***P < 1e‐3, ****P < 1e‐4; ns: not significant, using unpaired Student’s t‐test, two‐sided.
- G
Percent area coverage of Siglec‐F localized to Iba1 compared to total Aβ plaque volume in each field of view across all analyzed images from 5XFAD and non‐Tg control mice. Linear regression R2 value is shown for images with ≥ 10 μm2 total amyloid volume.
- H
Cumulative distribution function (CDF) of the distance between Siglec‐F+ and Iba1+ mask voxels and nearest Aβ plaques in 6‐month 5XFAD mice. Each value in the CDF represents the mean distance calculated from a single z‐stack of a ROI containing ≥ 1 plaque of size ≥ 10 μm2. n = 55 images (4 animals).
- I, J
Relative RNA abundances for Siglec‐8 in (H) hippocampus and (I) posterior cingulate cortex postmortem patient tissue. Linear regression R2 values are shown on plots.
- K
IF staining showing Siglec‐8 and Iba1, and MHC‐II in cortical white matter tissue from a patient with late‐onset AD (20× wide‐field; Case ID: 01‐43). Scale bars = 50 μm. Images are 60× super‐resolution max z‐stack projections.
- L, M
Percent area coverage of Siglec‐8 localized to Iba1 or MHC in individuals with non‐AD or AD. In (K), each point represents one WM or GM region average from each individual. In (L), values and statistics are shown for each image analyzed. Boolean mask operators indicate: ° = mask dilation, ⋂ = intersection, ⋃ = union, NOT = inverse mask. Box indicates quartiles, and whiskers indicate the last datum within 1.5 inter‐quartile range; n = 8‐43 images (n = 1 ND, 3 early‐onset AD, 4 late‐onset AD); *P < 5e‐2, **P < 1e‐2, ***P < 1e‐3, ****P < 1e‐4; ns: not significant, using unpaired Student’s t‐test, two‐sided.
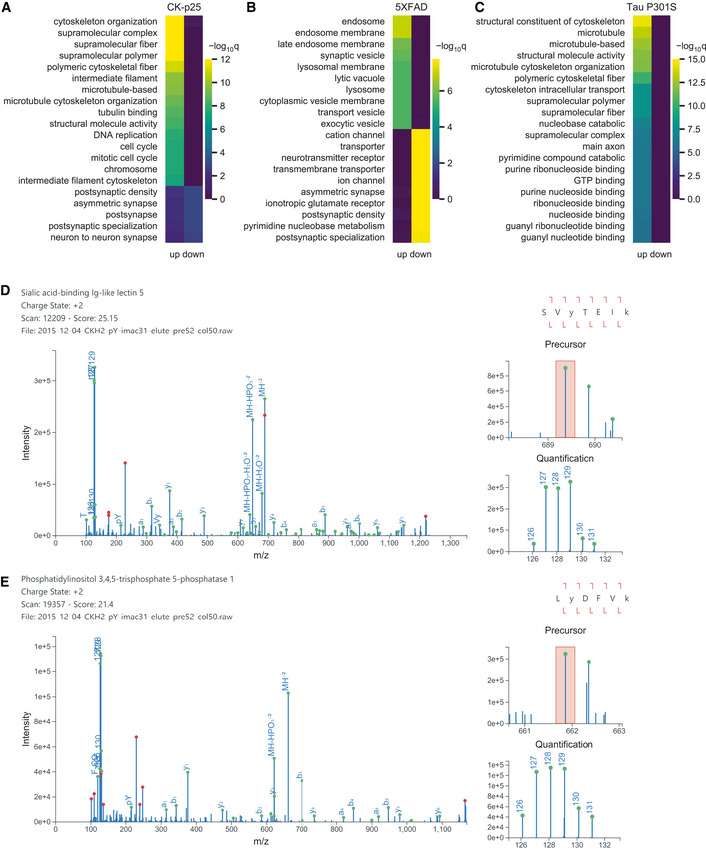
- A–C
Top 25 enriched gene ontologies from the phosphoproteome of (A) CK‐p25 mice, (B) 5XFAD mice, and (C) Tau P301S mice.
- D–E
Validated peptide‐spectrum matches for (D) Siglec‐F pY561 (SVyTEIK) and (E) Inpp5d pY868 (LyDFVK) in CK‐p25 mice. Green circles indicate predicted fragment ions. Red circles indicate abundant peaks that were not assigned a fragment ion. Orange box indicate precursor isolation window.
- A
Validation of E50‐2440 antibody on BV‐2 with stable Siglec‐F expression. Top: Empty vector; Bottom: Siglec‐F 2×Y‐>F. Blue = 33342, Red = E50‐2440. Scale bars = 20 m.
- B
Immunofluorescence (IF) staining showing Siglec‐F and Iba1 localization in CK‐p25 3wk hippocampus tile scan view. Boxed regions indicate analyzed regions: DG, CA1, CA2, and CA3. Scale bars = 50 μm. Colors are: Magenta = Iba1, Cyan = Siglec‐F. Images are max z‐stack projections taken from coronal slices.
- C
Individual wide‐field images of DG, CA1, CA2, and CA3 regions from CK (top) and CK-p25 mice (bottom).
- D–E
Percent of total Siglec‐F mask (D) area and (E) signal intensity that overlaps with Iba1 masks that have been dilated by a variable number of pixels. ° indicates Iba1 mask was dilated prior to Boolean overlap calculation. 1 voxel 2.4 μm. Values are calculated from CA1, CA2, CA3, and DG image regions from CK‐p25 animals using the same image set as Figure 1C.
- F
Wide‐field image of Siglec‐F, Iba1, and Aβ (Methoxy X04) signal across in the thalamus (TH) of 6 m.o. 5XFAD mice.
- G–H
Percent of total Siglec‐F mask (G) area and (H) signal intensity that overlaps with Iba1 masks that have been dilated by a variable number of pixels. Legend is same as (D‐E). Values are calculated from thalamic, cortical, and hippocampal regions from 5XFAD animals using the same image set as Figure 2F.
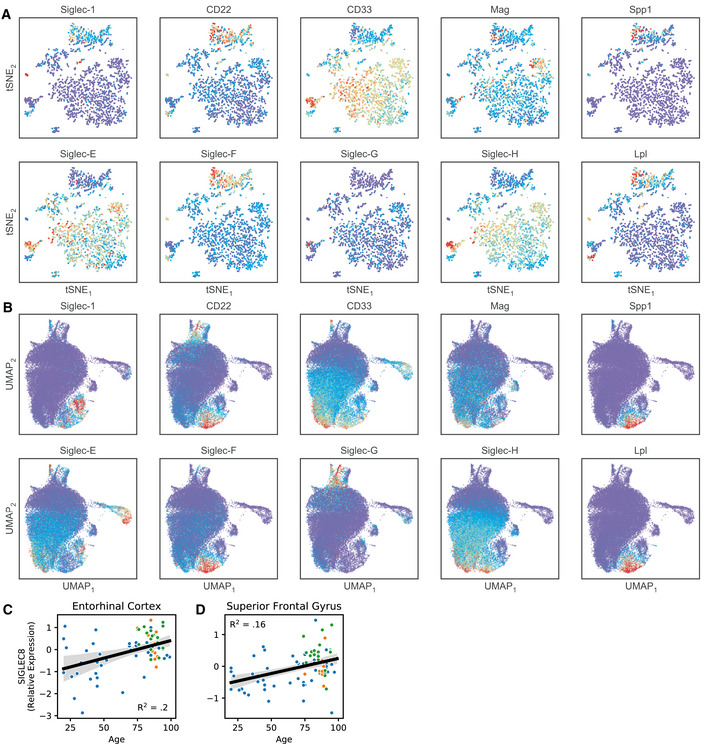
- A
Reanalysis of Siglec expression patterns in CK‐p25 microglia. Expression levels were imputing using MAGIC and plotted using the tSNE coordinates from the original publication. Late response MHC‐II+ microglia (top cluster, marker genes: Spp1, Lpl) show increased Siglec‐F expression compared with homeostatic microglia (lower right cluster).
- B
Reanalysis of Siglec expression patterns in 5XFAD microglia. Expression levels were projected onto two dimensions using UMAP and imputed using MAGIC. Disease‐associated microglia (lower center, marker genes: Spp1, Lpl) show increased Siglec‐F expression compared with homeostatic microglia (center).
- C–D
Relative RNA abundances for Siglec‐8 in (C) entorhinal cortex and (D) superior frontal gyrus post‐mortem patient tissue. Blue = ND; Yellow = MCI; Green = AD. Linear regression R2 and p‐values are shown on plots.
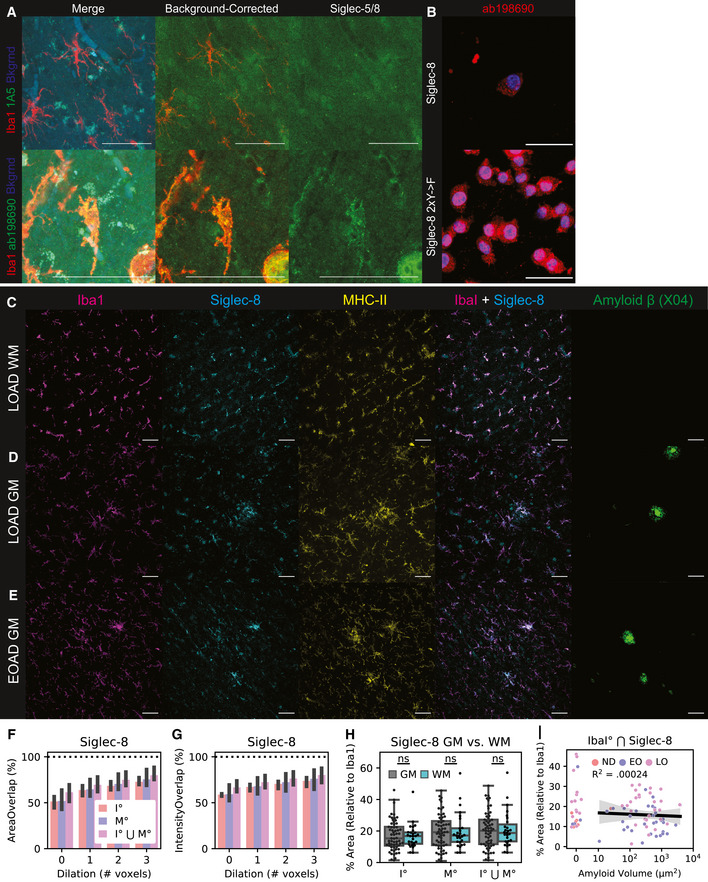
- A
IF staining for Siglec‐5 (top) and Siglec‐8 (bottom) in late‐onset AD patient tissue (LOAD; Case ID: 03–06). Show are merge (Left; Red = Iba1, Green = Siglec, Blue = 488 background autofluorescence), background‐corrected merge (Middle; Red = Iba1, Green == Siglec / 488 background), and background‐corrected Siglec alone (Right). Scale bars = 50 μm.
- B
Antibody validation of ab198690 on BV‐2 with induced Siglec‐8 (48 hours dox). Top: Siglec‐8; Bottom: Siglec‐8 2×YF. Blue = Hoechst 33342, Red = ab198690. Scale bar = 20 m.
- C–E
Representative IF images for Iba1, Siglec-8, MHC-II, and A (Methoxy X04) in tissue from patients. Shown are: (C) white matter (WM) region of a LOAD patient (Case ID: 01–43); (D) grey matter (GM) region from a LOAD patient (Case ID: 03–06); and (E) GM region from an early‐onset AD patient (Case ID: 00–22).
- F–G
Percent of total Siglec‐8 mask (F) area and (G) signal intensity that overlaps with Iba1, MHC, and the union (⋃) of Iba1 and MHC. ° indicates mask were dilated in by a given number of pixels prior to Boolean overlap calculation. 1 voxel ~ 2.4 μm. Values are median stack values from n = 3 selected 20× wide‐field images.
- H
Percent area coverage of Siglec‐8 localized to Iba1 or MHC in grey matter (GM) and white matter (WM) across all analyzed images.
- I
Percent area coverage of Siglec‐8 localized to Iba1 compared to total Aβ volume in each field of view across all analyzed images. Linear regression R2 value is shown for images with ≥10 μm2 total amyloid volume.
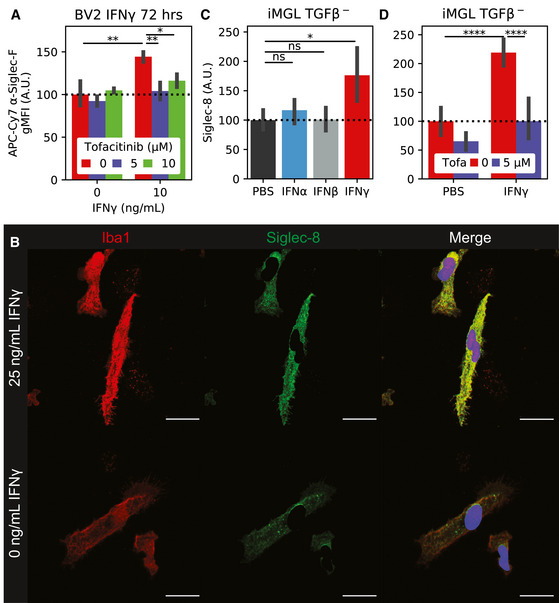
Flow cytometry quantification of BV‐2 Siglec‐F expression levels. Cells were co‐treated with 0‐10 ng/ml IFNγ and 0‐10 μM tofacitinib. Values are geometric mean fluorescence intensities (gMFI). Bars indicate mean ± 95% CI; n = 2‐4 replicates; *P < 5e‐2, **P < 1e‐2, ***P < 1e‐3, ****P < 1e‐4; ns: not significant, using unpaired Student’s t‐test, two‐sided. Dotted line indicates mean of untreated group.
IF staining of iMGLs treated with IFNγ. Siglec‐8 fluorescence is only shown on non‐nuclear (Hoechst 33342‐) regions. Images are 60× super‐resolution max z‐stack projections. Colors are as follows: Red = Iba1, Green = Siglec‐8, Blue = 33342. Scale bars = 20 μm.
Quantification of Siglec‐8 on iMGLs treated with PBS or 25 ng/ml IFNα, IFNβ, or IFNγ. Values are mean Siglec‐8 intensity values from Iba1+;33342‐ regions. Bars indicate mean ± 95% CI; n = 8 images (2 replicates); *P < 5e‐2, **P < 1e‐2, ***P < 1e‐3, ****P < 1e‐4; ns: not significant, using unpaired Student’s t‐test, two‐sided. Dotted line indicates mean of untreated group.
Quantification of Siglec‐8 on iMGLs treated ± 25 ng/ml IFNγ and 5 μM tofacitinib. Legend is same as (C). Bars indicate mean ± 95% CI; n = 5‐20 images (2 replicates); *P < 5e‐2, **P < 1e‐2, ***P < 1e‐3, ****P < 1e‐4; ns: not significant, using unpaired Student’s t‐test, two‐sided. Dotted line indicates mean of untreated group.
- A–C
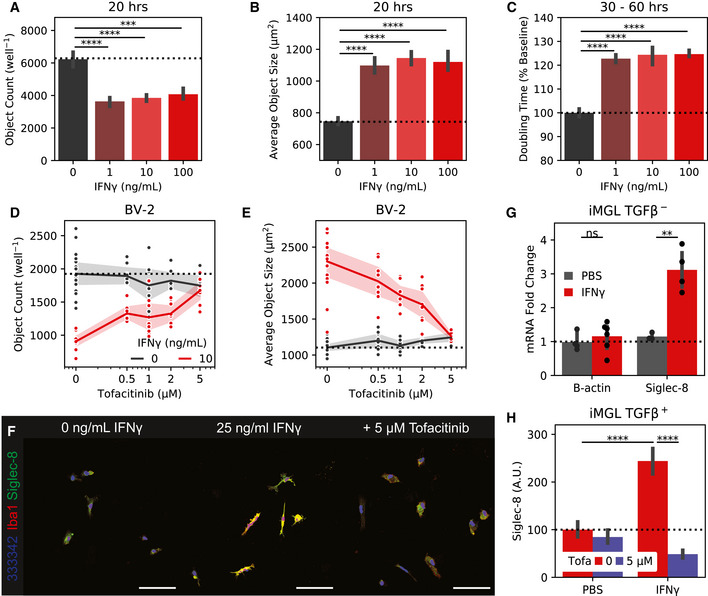
Incucyte (A) object count, (B) object size, and (C) doubling time for BV‐2 cells treated with 1–100 ng/mL IFNγ. (A+B) are calculated at 20 hours while (C) is calculated from confluency changes between 30 and 60 hours.
- D–E
Incucyte (D) object count and (E) object size for BV‐2 cells co‐treated with 10 ng/mL IFNγ and 0–5 μM to facitinib.
- F
20x wide‐field images of iMGLs treated with IFNγ or PBS and tofacitinib. Siglec‐8 fluorescence is only show on non‐nuclear regions. Colors are: Red = Iba1, Green = Siglec‐8, Blue = Hoechst 33342. Scale bars = 100 μm.
- G
qPCR quantification of Siglec‐8 from iMGLs treated with 25 ng/mL IFNγ or PBS.
- H
Quantification of Siglec‐8 on iMGLs treated with IFNγ or PBS and tofacitinib. iMGLs were matured with TGFβ before IFNγ stimulation.
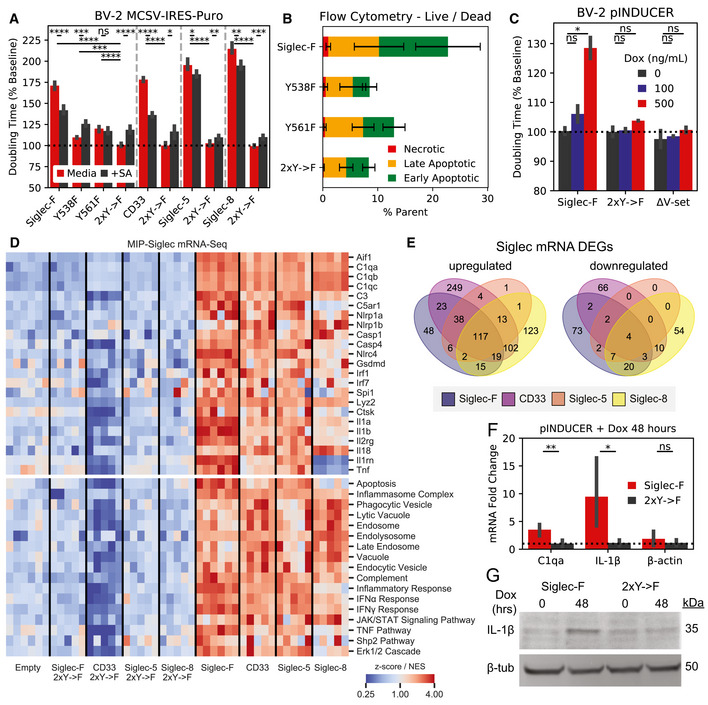
Confluency doubling times quantified from BV‐2 cells with stable retroviral expression of Siglec‐F and related human Siglec constructs. Plots indicating doubling time (normalized to 2xY‐>F constructs) estimated from Incucyte brightfield images. Cells grown in media alone or + 50 mU sialidase (+SA). Bars indicate mean ± 95% CI; n = 3‐12 replicates; *P < 5e‐2, **P < 1e‐2, ***P < 1e‐3, ****P < 1e‐4; ns: not significant, using unpaired Student’s t‐test, two‐sided. Dotted line indicates mean of 2xY‐>F groups.
Flow cytometry quantification of cell live/ dead markers Annexin‐V and propidium iodide on BV‐2 cells with stable retrovirus expression of Siglec‐F constructs. % parent values are shown for early apoptotic (Annexin‐V+;PI–), late apoptotic (Annexin‐V+;PI–), and necrotic (Annexin‐V–;PI+) populations. Bars indicate mean ± SD; n = 8 replicates.
Confluency doubling times quantified from BV‐2 cells with dox‐inducible expression of Siglec‐F constructs. Plots indicating doubling time (normalized to 2xY‐>F constructs) estimated from Incucyte brightfield images. Bars indicate mean ± SD; n = 8 replicates; *P < 5e‐2, **P < 1e‐2, ***P < 1e‐3, ****P < 1e‐4; ns: not significant, using unpaired Student’s t‐test, two‐sided. Dotted line indicates mean of 2xY‐>F group.
Selected gene expression changes (top) and enriched gene sets (bottom) taken from RNA‐seq analysis of BV‐2 cells with stable retroviral expression of Siglec constructs, 2xY‐>F, and empty vector controls. Heatmaps share a color map range of 0.25 to 4 for z‐score values (top), normalized enrichment scores (NES, bottom).
Quantification and overlap of differentially expressed genes (DEGs) between each Siglec‐expressing BV‐2 cell line. DEGs were calculated for each Siglec gene compared to respective 2xY‐>F mutants (upregulated P < 1e‐8, FC> 1.5; downregulated P < 1e‐8, FC < 0.66).
Expression levels of C1qa, IL‐1β, and β‐actin by qPCR analysis in BV‐2 cells with inducible Siglec‐F expression after 48 h of treatment with 500 ng/ml doxycycline. Fold Change values are equal to normalized relative to GADPH mRNA levels. Bars indicate mean ± 95% CI; n = 6 replicates; *P < 5e‐2, **P < 1e‐2, ***P < 1e‐3, ****P < 1e‐4; ns: not significant, using unpaired Student’s t‐test, two‐sided. Dotted line indicates mean of 2xY‐>F group.
Western blot showing pro‐IL‐1β and β‐tubulin in BV‐2 cells induced to express Siglec‐F at 0 and 48 h.
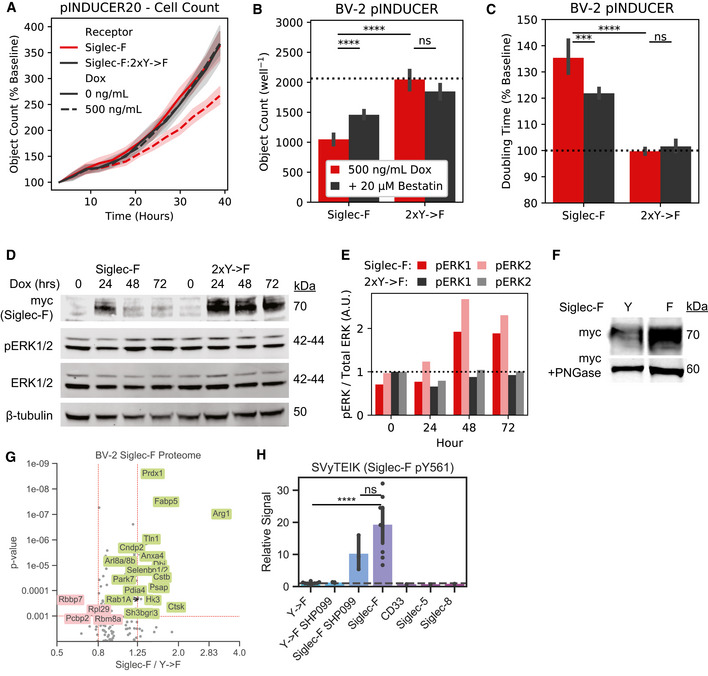
- A
Incucyte object count for BV‐2 cells expressing inducible Siglec‐F constructs. Cell counts for are normalized to the starting count in each imaging region.
- B–C
Incucyte quantification of (B) object count and (C) confluency doubling time for BV‐2 cells expressing inducible Siglec‐F and optionally co‐treated with 20‐μM Bestatin.
- D
Western blot detection of Siglec‐F‐myc, pERK1/2, total ERK, and ‐tubulin in BV‐2 cells induced to express Siglec‐F for 0‐72 hours.
- E
Quantification of Erk1, Erk2, pErk1/total Erk1, and pErk2/total Erk2 for bands shown in (D).
- F
Western blot detection of myc‐tagged Siglec‐F ± PNGase.
- G
Volcano plot showing proteomic changes induced by stable Siglec‐F expression in BV‐2 cells. Only proteins with ≥ 2 unique peptides that each were seen in ≥ 2 scans are shown.Volcano plot showing proteomic changes induced by stable Siglec‐F expression in BV‐2 cells. Only proteins with ≥ 2 unique peptides that each were seen in ≥ 2 scans are shown.
- H
Quantification of Siglec‐F pY561 (SVyTEIK) across BV‐2 lines analyzed.
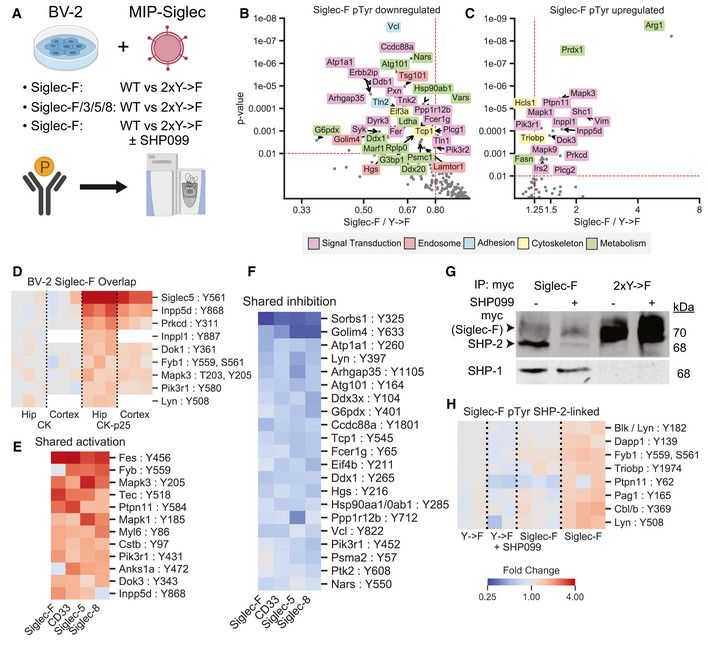
- A
Experimental design for phosphotyrosine analysis of BV‐2 cells with stable expression of Siglec and corresponding 2xY‐>F mutants. Samples were run as three 10‐plex experiments: (1) Siglec‐F: WT vs. 2xY‐>F; (2) Siglec‐F, CD33, Siglec‐5, and Siglec‐8: WT vs 2xY‐>F; (3) Siglec‐F: WT vs. 2xY‐>F ± 1 μM SHP099. Phosphotyrosine peptides were enriched and analyzed by LC‐MS/MS.
- B, C
Volcano plots showing phosphotyrosine peptides that were (B) increased or (C) decreased after Siglec‐F expression. Plots show Siglec‐F compared to 2xY‐>F mutant data integrated across all three runs. Protein names are shown for altered peptides. Labels are only shown for peptides with maximum directional change from each protein. Labels colored according to GO terms: magenta = signal transduction, red = endosome, cyan = cell adhesion, yellow = cytoskeleton, green = metabolism.
- D
Heatmap showing phosphosites in CK‐p25 which overlapped in their directional change with BV‐2 Siglec‐F‐associated sites. Colors indicate fold change relative to 2xY‐>F controls.
- E, F
Heatmap showing phosphosites from CD33, Siglec‐5, and Siglec‐8 overexpression that were (E) increased or (F) decreased with Siglec expression and shared their directional change with Siglec‐F. Siglec‐F column indicates average of all untreated Siglec‐F replicates. Color scale is same as (D).
- G
Western blot quantification of myc, SHP‐2, and SHP‐1 from myc co‐IP eluates. Co‐IP lysates were prepared from BV‐2 cells stably expressing Siglec‐F and optionally treated with 1 μM SHP099.
- H
Heatmap showing phosphosites that were perturbed by SHP099 treatment. Color scale is same as (D).
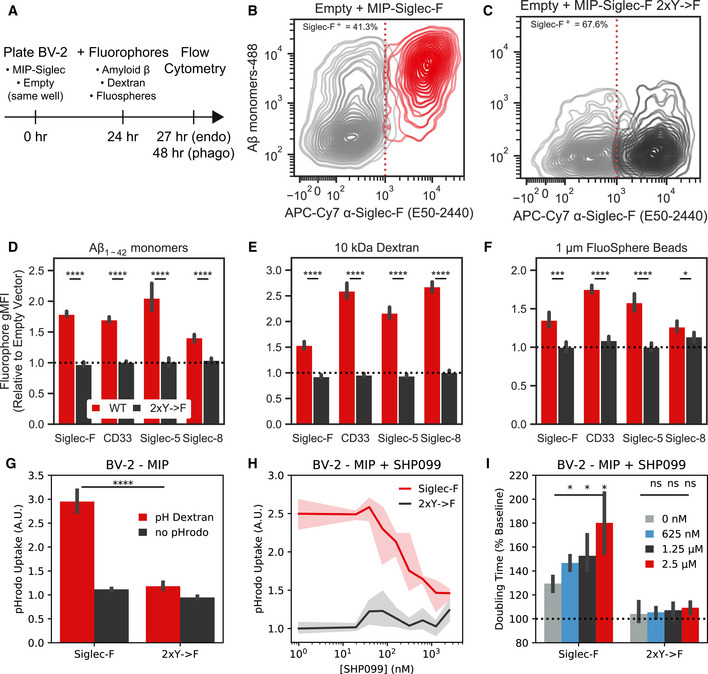
- A
Schematic showing experimental setup to measure rates endocytosis in BV‐2 cells. Control (MIP empty vector) cells were plated together with cells stably expressing different Siglec constructs. Cells are allowed to adapt to the same media environment for 24 h, and then, fluorophores are added to media. Cells with endocytosis substrates (Aβ, Dextran) were assayed after 3 h, while phagocytosis substrates (FluoSpheres) were assayed after 24 h. Populations are separated, and relative uptake is measured using flow cytometry.
- B, C
Flow cytometry quantification of fluorescent monomeric Aβ uptake and Siglec‐F expression for (B) Siglec‐F and (C) Siglec‐F 2xY‐>F. Siglec‐expressing cells were plated with empty vector control cells in the same well alongside fluorescent substrates.
- D–F
Quantification of relative mean fluorescence intensities (MFI) between empty vector and Siglec‐expressing populations. Relative values are shown for each mouse and human Siglec construct for uptake of (D) monomeric Aβ, (E) 10,000 MW Dextran, and (F) 1 μm FluoSpheres. Bars indicate mean ± 95% CI; n = 6 replicates; *P < 5e‐2, **P < 1e‐2, ***P < 1e‐3, ****P < 1e‐4; ns: not significant, using unpaired Student’s t‐test, two‐sided. Dotted line indicates mean of 2xY‐>F group.
- G
pHrodo Dextran uptake in BV‐2 cells with stable expression of Siglec‐F estimated by Incucyte measurements. Bars indicate mean ± 95% CI; n = 6 replicates; *P < 5e‐2, **P < 1e‐2, ***P < 1e‐3, ****P < 1e‐4; ns: not significant, using unpaired Student’s t‐test, two‐sided.
- H
pHrodo dextran uptake in BV‐2 cells stably expressing Siglec‐F with 0 ‐ 2.5 μM SHP099 treatment. Data is from the same experiment as (G).
- I
Confluency doubling times for BV‐2 cells with stable expression of Siglec‐F with 0 ‐ 2.5 μM SHP099 treatment. Data is from the same experiment as (G). Bars indicate mean ± 95% CI; n = 4 replicates; *P < 5e‐2, **P < 1e‐2, ***P < 1e‐3, ****P < 1e‐4; ns: not significant, using unpaired Student’s t‐test, two‐sided. Dotted line indicates mean of untreated 2xY‐>F group.
References
-
- Aizawa H, Zimmermann N, Carrigan PE, Lee JJ, Rothenberg ME, Bochner BS (2003) Molecular analysis of human Siglec‐8 orthologs relevant to mouse eosinophils: Identification of mouse orthologs of Siglec‐5 (mSiglec‐F) and Siglec‐10 (mSiglec‐G). Genomics 82: 521–530 - PubMed
-
- Angata T (2014) Associations of genetic polymorphisms of Siglecs with human diseases. Glycobiology 24: 785–793 - PubMed
-
- Angata T, Hingorani R, Varki NM, Varki A (2001) Cloning and characterization of a novel mouse siglec, mSiglec‐F: differential evolution of the mouse and human (CD33) Siglec‐3‐related gene clusters. J Biol Chem 276: 45128–45136 - PubMed
Publication types
MeSH terms
Substances
Grants and funding
LinkOut - more resources
Full Text Sources
Other Literature Sources
Molecular Biology Databases
Research Materials
