. 2021 Jan 25;6(2):e134218.
doi: 10.1172/jci.insight.134218.

MicroRNA miR-24-3p reduces DNA damage responses, apoptosis, and susceptibility to chronic obstructive pulmonary disease

Affiliations

MicroRNA miR-24-3p reduces DNA damage responses, apoptosis, and susceptibility to chronic obstructive pulmonary disease

Jessica Nouws et al. JCI Insight. .

Abstract

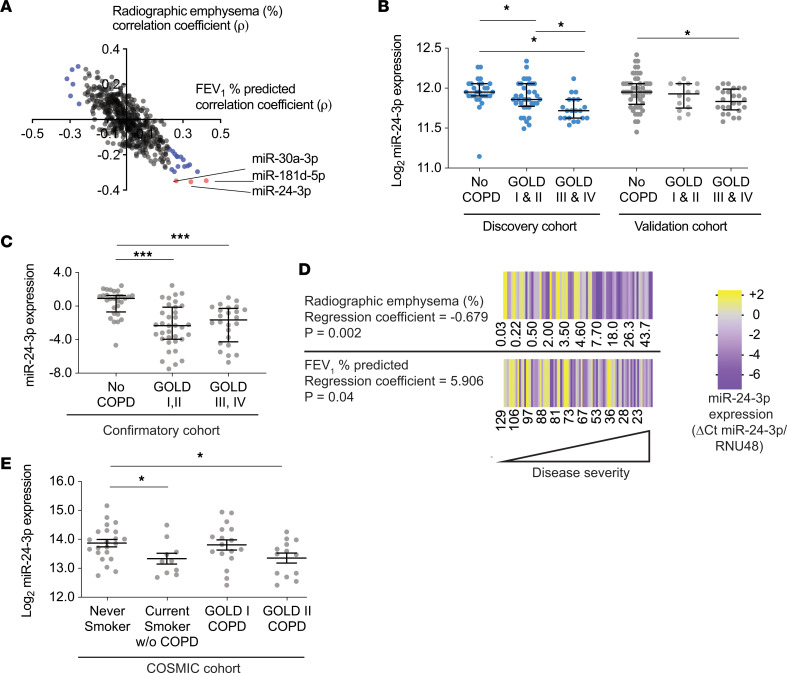
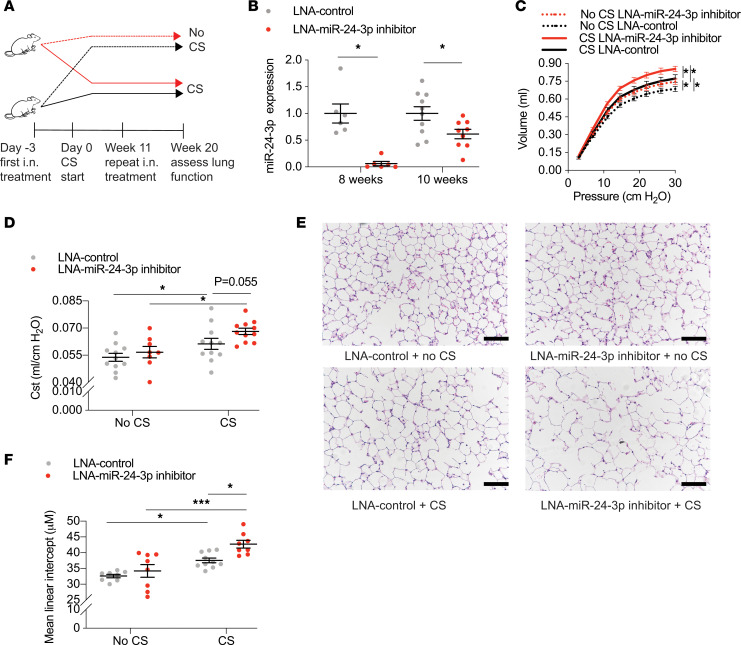
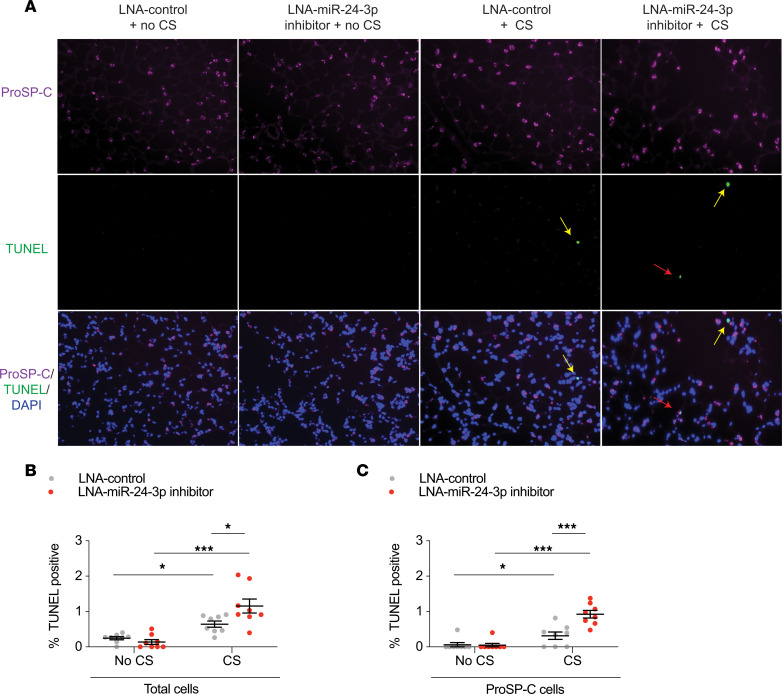
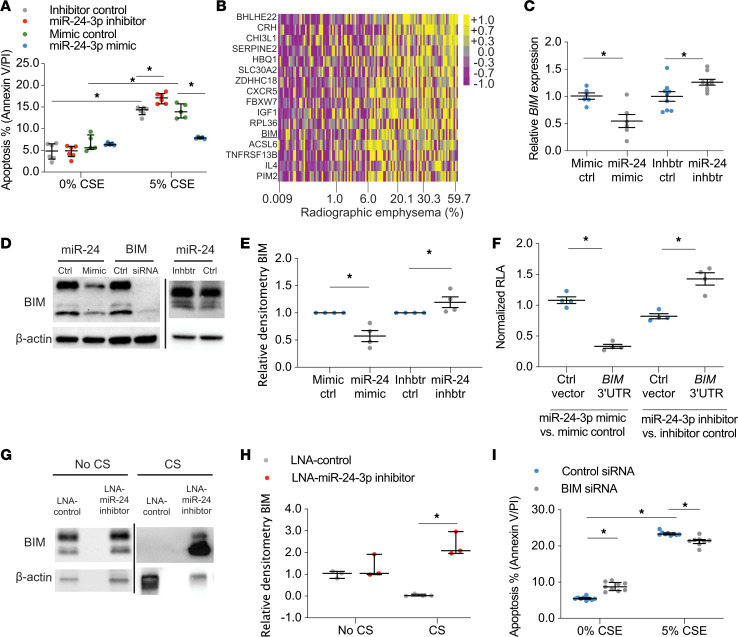
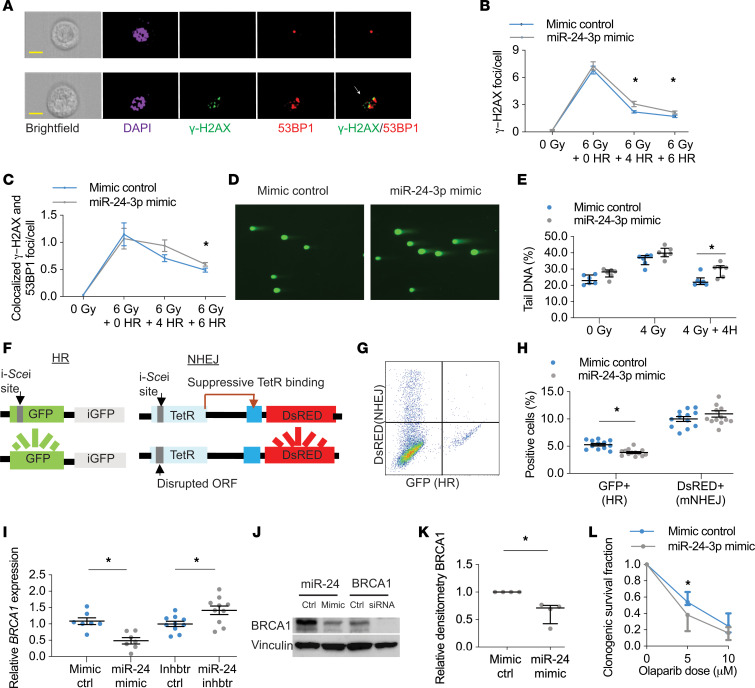
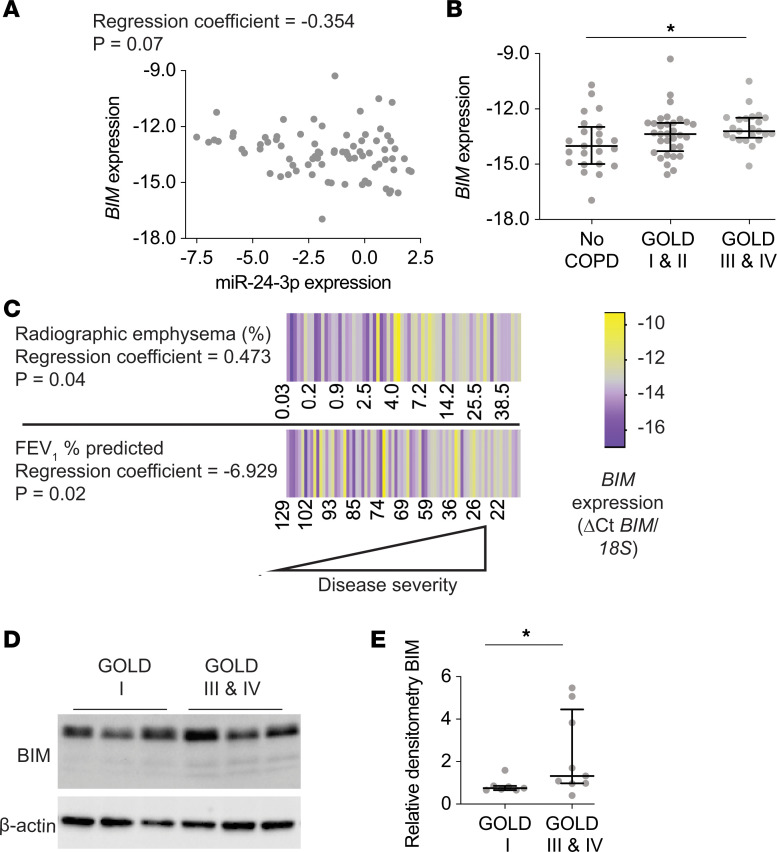
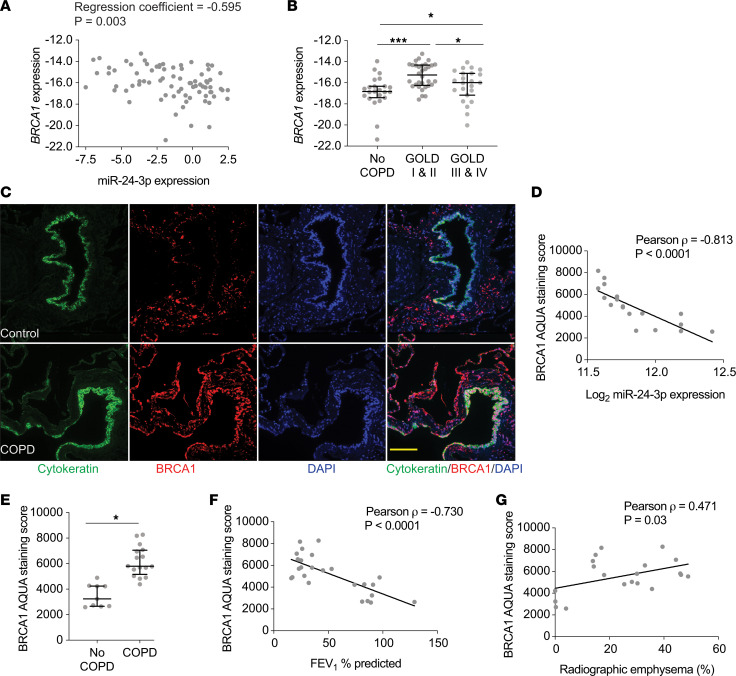
The pathogenesis of chronic obstructive pulmonary disease (COPD) involves aberrant responses to cellular stress caused by chronic cigarette smoke (CS) exposure. However, not all smokers develop COPD and the critical mechanisms that regulate cellular stress responses to increase COPD susceptibility are not understood. Because microRNAs are well-known regulators of cellular stress responses, we evaluated microRNA expression arrays performed on distal parenchymal lung tissue samples from 172 subjects with and without COPD. We identified miR-24-3p as the microRNA that best correlated with radiographic emphysema and validated this finding in multiple cohorts. In a CS exposure mouse model, inhibition of miR-24-3p increased susceptibility to apoptosis, including alveolar type II epithelial cell apoptosis, and emphysema severity. In lung epithelial cells, miR-24-3p suppressed apoptosis through the BH3-only protein BIM and suppressed homology-directed DNA repair and the DNA repair protein BRCA1. Finally, we found BIM and BRCA1 were increased in COPD lung tissue, and BIM and BRCA1 expression inversely correlated with miR-24-3p. We concluded that miR-24-3p, a regulator of the cellular response to DNA damage, is decreased in COPD, and decreased miR-24-3p increases susceptibility to emphysema through increased BIM and apoptosis.

Keywords: Apoptosis; COPD; DNA repair; Pulmonology.


Conflict of interest statement

Conflict of interest: EF is currently employed by Rubius Therapeutics; VN is currently employed by Akoya Bioscience; RB is cofounder and consultant for Cybrexa Therapeutics; NK reports personal fees from Biogen, Boehringer Ingelheim, Third Rock Ventures, miRagen, Pliant, Samumed, NuMedii, Indaloo, Theravance, LifeMax, Optikira, and Three Lake Partners. MS and PJL are co-inventors on a patent describing the therapeutic utility of MIF20 in lung disease (WO2020123610A1); NK has filed patents related to the use of thyroid hormone as an antifibrotic agent (US10792265B2) and biomarkers in pulmonary fibrosis (US20120045395A1, US20140335547A1, US8568996B2, US20180101642A1). NK and PJL have filed patents related to the use of thyroid hormone to prevent or treat acute lung injury (WO2019178023A1).

Figures

Figure 1
Figure 1. miR-24-3p is decreased in COPD and inversely correlates with disease severity.
(A) Coefficients of Spearman correlations (ρ) between microRNAs versus percent radiographic emphysema (y axis) (n = 121) and microRNAs versus FEV1 percent predicted (x axis) (n = 172) in the LGRC cohort. Blue indicates microRNAs correlated with FEV1 percent predicted (FDR < 0.05). Red indicates microRNAs correlated with percent radiographic emphysema and FEV1 percent predicted (FDR < 0.05). (B) Log2-transformed microarray expression of miR-24-3p in the discovery and validation LGRC cohorts. discovery cohort: n = 28 for No COPD, n = 36 for GOLD I & II, n = 20 for GOLD III & IV. validation cohort: n = 50 for No COPD, n = 14 for GOLD I & II, n = 24 for GOLD III & IV. (C) miR-24-3p expression (ΔCt miR-24-3p/RNU48) measured by RT-PCR in lung tissue samples from the confirmatory cohort. n = 28 for No COPD, n = 35 for GOLD I & II COPD, and n = 24 for GOLD III & IV COPD. (D) Heatmap of miR-24-3p expression (ΔCt miR-24-3p/RNU48) measured by RT-PCR in lung tissue samples from the confirmatory cohort versus FEV1 percent predicted (n = 87) and percent radiographic emphysema (n = 75). The regression coefficients and P values are adjusted for the effects of age, sex, and smoking status. Yellow denotes increase above the sample median, and purple denotes decrease below the sample median. (E) Log2-transformed microarray expression of miR-24-3p in airway brushings from the COSMIC cohort. n = 22 for never smokers, n = 10 for current smokers without COPD, n = 17 for current and former smokers with COPD (GOLD I), and n = 13 for current and former smokers with COPD (GOLD II). Error bars represent median ± interquartile range (B and C) or mean ± SEM (E). ***P ≤ 0.0001, *P < 0.05, Kruskal-Wallis 1-way ANOVA (B and C) or ordinary 1-way ANOVA (E), correcting for multiple comparisons using the 2-stage linear step-up procedure of Benjamini, Krieger, and Yekutieli.
Figure 2
Figure 2. miR-24-3p inhibition increases susceptibility to CS-induced emphysema.
(A) Study design for mice treated with intranasal (i.n.) LNA–miR-24-3p inhibitor or LNA control ± CS. (B) Relative expression of miR-24-3p (ΔΔCt miR-24-3p/snoRNA202) measured by RT-PCR in mouse lungs at 8 or 10 weeks following i.n. administration with LNA-miR-24-3p inhibitor or LNA control (n = 6/group for 8 weeks and 9–10/group for 10 weeks). (CF) Lung function and histologic assessments of emphysema in mice exposed to CS (n = 11/LNA control and n = 11/LNA–miR-24-3p inhibitor) and mice exposed to no CS (n = 13/LNA control and n = 8/LNA–miR-24-3p inhibitor). (C) Lung compliance assessed using a flexiVent by the slope of the pressure-volume deflation limb. (D) FlexiVent measurements of static lung compliance (Cst). (E and F) Representative hematoxylin and eosin lung histology and measurements of mean linear intercept (μM) from mice treated with LNA–miR-24-3p inhibitor versus LNA control ± CS. Black scale bar: 200 μm. Error bars represent mean ± SEM. ***P ≤ 0.0001, *P < 0.05, ordinary 1-way ANOVA correcting for multiple comparisons using the 2-stage linear step-up procedure of Benjamini, Krieger, and Yekutieli.
Figure 3
Figure 3. miR-24-3p inhibition increases susceptibility to CS-induced apoptosis.
(A) Immunofluorescence staining for pro-surfactant protein C (proSP-C) and TUNEL and composite images with DAPI staining in lungs from mice treated with LNA–miR-24-3p inhibitor versus LNA control ± CS exposure. Yellow arrows show TUNEL+proSP-C cells. Red arrows show TUNEL+proSP-C+ cells. Original magnification, ×20. (B) Quantification of TUNEL+ cells as a percentage of all cells (n = 8/group). (C) Quantification of TUNEL+proSP-C+ cells as a percentage of all proSP-C+ cells (n = 8/group). Error bars represent mean ± SEM. ***P ≤ 0.0001, *P < 0.05, ordinary 1-way ANOVA correcting for multiple comparisons using the 2-stage linear step-up procedure of Benjamini, Krieger, and Yekutieli.
Figure 4
Figure 4. miR-24-3p inhibits apoptosis through BIM.
(A) Percentage apoptotic cells determined by flow cytometry for annexin V/PI in miR-24-3p mimic versus mimic control (n = 5/group) and miR-24-3p inhibitor versus inhibitor control (n = 6/group) transfected primary HAECs exposed to 0% or 5% CSE. (B) Heatmap of miR-24-3p target genes’ z scores, as measured by microarray expression in the LGRC cohort, correlated with percent radiographic emphysema (Spearman ρ, FDR < 0.05) (n = 121 subjects). Yellow denotes increase above sample median, and purple denotes decrease below sample median. (C) BIM expression (ΔΔCt BIM/18S) measured by RT-PCR in BEAS-2B cells treated with miR-24-3p mimic versus mimic control (n = 6/group) and miR-24-3p inhibitor versus inhibitor control (n = 9/group). (D and E) Sample immunoblotting and relative densitometry of BIM/β-actin in BEAS-2B cells treated with miR-24-3p mimic versus mimic control or miR-24-3p inhibitor versus inhibitor control (n = 4/group). Sample immunoblotting includes siRNA against BIM and siRNA control. (F) Relative luciferase activity (RLA) (firefly luciferase/Renilla luciferase) normalized as a ratio of miR-24-3p mimic versus mimic control in BEAS-2B or miR-24-3p inhibitor versus inhibitor control cells cotransfected with BIM 3′UTR luciferase reporter plasmid or control plasmid (n = 4/group). (G and H) Sample immunoblotting and relative densitometry of BIM/β-actin performed on lung tissue lysates from mice treated with LNA–miR-24-3p inhibitor or LNA control ± exposure to CS (n = 3/group for CS and 4/group for no CS). (I) Percentage apoptotic cells determined by flow cytometry for annexin V/PI in BEAS-2B cells treated with siRNA against BIM or siRNA control and exposed to 0% or 5% CSE (n = 9/group). Error bars represent median ± IQR. *P < 0.05, Kruskal-Wallis correcting for multiple comparisons using the 2-stage linear step-up procedure of Benjamini, Krieger, and Yekutieli. See complete unedited blots in the supplemental material.
Figure 5
Figure 5. miR-24-3p inhibits HR and BRCA1.
(A) Imaging flow cytometry of cells exposed to 0 or 6 Gy of IR. Representative images of DAPI, γ-H2AX, and 53BP1 immunofluorescence staining. Colocalized γ-H2AX/53BP1 foci (yellow) are shown (arrow). Yellow scale bar: 10 μm. (B and C) Primary HAECs exposed to 0 Gy or 6 Gy with 0–6 hours (H) recovery (n = 7/group). (D and E) Comet assay in BEAS-2B cells exposed to 0 Gy, 4 Gy, or 4 Gy with 4H recovery. Percentage tail DNA reflects DNA damage (n = 6/group), with sample images following 4 Gy with 4H of recovery (original magnification, ×20). (F) Schema of DNA reporter cell assay with 2 integrated loci for measuring HR and mutagenic nonhomologous end joining (mNHEJ). (G) Representative flow cytometry demonstrating DsRED+ (mNHEJ) and GFP+ (HR) expression. (H) DNA reporter cells transfected with miR-24-3p mimic (n = 13/group) versus mimic control (n = 12/group). (I) BRCA1 expression (ΔΔCt of BRCA1/18S) measured by RT-PCR in BEAS-2B cells treated with miR-24-3p mimic versus mimic control (n = 7/group) and miR-24-3p inhibitor versus inhibitor control (n = 10/group). (J and K) Sample immunoblotting and relative densitometry of BRCA1/Vinculin in BEAS-2B cells treated with miR-24-3p mimic versus mimic control (n = 4/group). Sample immunoblotting includes siRNA against BRCA1 and siRNA control. (L) BEAS-2B cells transfected with miR-24-3p mimic versus mimic control and treated with olaparib at indicated dosages (n = 5/group). Error bars represent mean ± SEM (B, C, H, and I) or median ± IQR (E, K, and L). *P < 0.05 ordinary 1-way ANOVA (B, C, H, and I), Mann-Whitney (K), or Kruskal-Wallis (E and L) correcting for multiple comparisons using the 2-stage linear step-up procedure of Benjamini, Krieger, and Yekutieli. See complete unedited blots in the supplemental material.
Figure 6
Figure 6. BIM expression inversely correlates with miR-24-3p expression and BIM is increased in COPD.
(A) Correlation of BIM expression (ΔCt BIM/18S) with miR-24-3p expression (ΔCt miR-24-3p/RNU48) measured by RT-PCR in lung tissue samples from the confirmatory cohort (n = 78). The regression coefficient and P value are adjusted for the effects of age, sex, and smoking. (B) BIM expression (ΔCt BIM/18S) measured by RT-PCR in lung tissue samples from the confirmatory cohort. n = 23 for no COPD, n = 32 for GOLD I & II COPD, and n = 23 for GOLD III & IV COPD. (C) Heatmap of FEV1 percent predicted (n = 78) and percent radiographic emphysema (n = 68) correlated with BIM expression (ΔCt BIM/18S) measured by RT-PCR in lung tissue samples from the confirmatory cohort. The regression coefficients and P values are adjusted for the effects of age, sex, and smoking status. Yellow denotes increase above the sample median, and purple denotes decrease below the sample median. (D and E) Sample immunoblotting and relative densitometry of BIM/β-actin performed on lung tissue samples from individuals with GOLD I (n = 7/group) or GOLD III & IV COPD (n = 9/group). Error bars represent median ± IQR. *P < 0.05 Kruskal-Wallis (B) or Mann-Whitney (E) correcting for multiple comparisons using the 2-stage linear step-up procedure of Benjamini, Krieger, and Yekutieli. See complete unedited blots in the supplemental material.
Figure 7
Figure 7. BRCA1 expression inversely correlates with miR-24-3p expression and BRCA1 is increased in COPD.
(A) Correlation of BRCA1 expression (ΔCt BRCA1/18S) and miR-24-3p expression (ΔCt miR-24-3p/RNU48) measured by RT-PCR in lung tissue samples from the confirmatory cohort (n = 78). The regression coefficients and P values are adjusted for the effects of age, sex, and smoking status. (B) BRCA1 expression (ΔCt BRCA1/18S) measured by RT-PCR in lung tissue samples from the confirmatory cohort. n = 23 for no COPD, n = 32 for GOLD I & II COPD, and n = 23 for GOLD II & IV COPD. (C) Representative images showing in situ detection of BRCA1, cytokeratin, and DAPI nuclear stain. BRCA1 staining intensity within the image mask generated from the cytokeratin and DAPI-positive staining was used to generate a quantitative score of BRCA1 staining using automated quantitative analysis (AQUA). Yellow scale bar: 50 μm. (D) Pearson correlation between miR-24-3p expression and BRCA1 AQUA staining scores (n = 19). (E) BRCA1 AQUA staining scores from control (n = 9/group) and COPD subjects (n = 16/group). (F) Pearson correlation between FEV1 percent predicted and BRCA1 AQUA staining scores (n = 25). (G) Pearson correlation between percent radiographic emphysema and BRCA1 AQUA staining scores (n = 21). Error bars represent median ± IQR (B) or mean ± SEM (E). ***P ≤ 0.0001, *P < 0.05 Kruskal-Wallis (B) or Student’s t test (E) correcting for multiple comparisons using the 2-stage linear step-up procedure of Benjamini, Krieger, and Yekutieli.

Similar articles

Cited by

References

    1. GBD 2015 Chronic Respiratory Disease Collaborators Global, regional, and national deaths, prevalence, disability-adjusted life years, and years lived with disability for chronic obstructive pulmonary disease and asthma, 1990-2015: a systematic analysis for the Global Burden of Disease Study 2015. Lancet Respir Med. 2017;5(9):691–706. doi: 10.1016/S2213-2600(17)30293-X. - DOI - PMC - PubMed
    1. Castaldi PJ, et al. Do COPD subtypes really exist? COPD heterogeneity and clustering in 10 independent cohorts. Thorax. 2017;72(11):998–1006. doi: 10.1136/thoraxjnl-2016-209846. - DOI - PMC - PubMed
    1. Rangasamy T, et al. Genetic ablation of Nrf2 enhances susceptibility to cigarette smoke-induced emphysema in mice. J Clin Invest. 2004;114(9):1248–1259. doi: 10.1172/JCI21146. - DOI - PMC - PubMed
    1. Sauler M, et al. The DNA repair transcriptome in severe COPD. Eur Respir J. 2018;52(4):1701994. doi: 10.1183/13993003.01994-2017. - DOI - PMC - PubMed
    1. Aoshiba K, et al. DNA damage as a molecular link in the pathogenesis of COPD in smokers. Eur Respir J. 2012;39(6):1368–1376. doi: 10.1183/09031936.00050211. - DOI - PubMed

Publication types

MeSH terms