. 2021 Feb 1;131(3):e139927.
doi: 10.1172/JCI139927.

Biomarkers of inflammation and repair in kidney disease progression

Affiliations

Biomarkers of inflammation and repair in kidney disease progression

Jeremy Puthumana et al. J Clin Invest. .

Abstract

INTRODUCTIONAcute kidney injury and chronic kidney disease (CKD) are common in hospitalized patients. To inform clinical decision making, more accurate information regarding risk of long-term progression to kidney failure is required.METHODSWe enrolled 1538 hospitalized patients in a multicenter, prospective cohort study. Monocyte chemoattractant protein 1 (MCP-1/CCL2), uromodulin (UMOD), and YKL-40 (CHI3L1) were measured in urine samples collected during outpatient follow-up at 3 months. We followed patients for a median of 4.3 years and assessed the relationship between biomarker levels and changes in estimated glomerular filtration rate (eGFR) over time and the development of a composite kidney outcome (CKD incidence, CKD progression, or end-stage renal disease). We paired these clinical studies with investigations in mouse models of renal atrophy and renal repair to further understand the molecular basis of these markers in kidney disease progression.RESULTSHigher MCP-1 and YKL-40 levels were associated with greater eGFR decline and increased incidence of the composite renal outcome, whereas higher UMOD levels were associated with smaller eGFR declines and decreased incidence of the composite kidney outcome. A multimarker score increased prognostic accuracy and reclassification compared with traditional clinical variables alone. The mouse model of renal atrophy showed greater Ccl2 and Chi3l1 mRNA expression in infiltrating macrophages and neutrophils, respectively, and evidence of progressive renal fibrosis compared with the repair model. The repair model showed greater Umod expression in the loop of Henle and correspondingly less fibrosis.CONCLUSIONSBiomarker levels at 3 months after hospitalization identify patients at risk for kidney disease progression.FUNDINGNIH.

Keywords: Chronic kidney disease; Clinical practice; Inflammation; Molecular diagnosis; Nephrology.


Conflict of interest statement

Conflict of interest: SGC reports personal income and equity and stock options from RenaltyixAI and pulseData; he also reports personal income from 3ive, Bayer, Boehringer-Ingelheim, CHF Solutions, inRegen, Quark, Relypsa, and Takeda. JH reports personal income from Akebia Therapeutics, Chinook Therapeutics, Maze Therapeutics, Pfizer, RenalytixAI, and Seattle Genetics. EDS reports personal income from Akebia Therapeutics, Da Vita, and UpToDate; he also serves as an associate editor for the Clinical Journal of the American Society of Nephrology. LBW reports personal incoime from Bayer, Boehringer Ingelheim, Citius, CSL Behring, Foresee, Merck, and Quark; she also received research funding from CSL Behring and Genentech. KDL reports personal income from Astra Zeneca, Baxter, Biomerieux, Durect, Potrero Med, Quark, Theravance, and UpToDate; she also holds stock in Amgen and is an associate editor at the American Thoracic Society. PLK reports being an editor of the textbook Chronic Renal Disease. LGC reports personal income from MPM Capital and Vivace Therapeutics. CRP reports personal income and equity and stock options from RenaltyixAI; he also reports personal income from Genfit Biopharmaceutical Company and Akebia Therapeutics.

Figures

Figure 1
Figure 1. Levels of biomarkers and change in eGFR from baseline study visit 3 months after discharge.
Adjusted for AKI and CKD status at index hospitalization, gender, black race, Hispanic ethnicity, smoking status, diabetes, sepsis during index hospitalization, body mass index at 3-month in-person visit, log2-transformed urine creatinine and albumin at the 3-month in-person visit, and eGFR determined at 3-month in-person visit.
Figure 2
Figure 2. Kaplan-Meier curves of the proportion of patients reaching the composite kidney outcome relative to time from baseline by biomarker quartiles.
Figure 3
Figure 3. Kaplan-Meier curves of the proportion of patients surviving relative to time from baseline by biomarker quartiles.
Figure 4
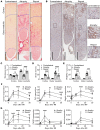
Figure 4. Kidney fibrosis and atrophy are preceded by upregulation of Ccl2 and Chi3l1.
Wild-type mice were subjected to 27 minutes of unilateral IRI with contralateral kidney intact (atrophy model) or unilateral IRI with contralateral nephrectomy (repair model). The mice were sacrificed on days 1, 7, 14, and 30 after injury. Contralateral, atrophy, and repair kidneys were harvested at 30 days after injury, and kidney sections were stained with Picrosirius red to detect collagen deposition and immunostained with anti-PDGFRβ antibody to detect interstitial myofibroblasts. (A and B) Representative images of kidney sections. Scale bars: 500 μm. (CE) Quantification of cortical and medullary thickness, Picrosirius red area, and PDGFRβ-positive area, respectively. n = 10 kidneys/model. P < 0.0001 among group means and ***P < 0.001, ****P < 0.0001 by 2-way ANOVA in the indicated subgroup analyses. (F and G) Quantitative RT-PCR analysis for Col1a1, Fn1, Pdgfrb, Ccl2, Chi3l1, and Umod was performed on whole-kidney RNA harvested on days 0, 1, 7, 14, and 30 after injury. n = 10 kidneys/time point/model. Two-way ANOVA summarized in Supplemental Table 5. *P < 0.05, **P < 0.01, ***P < 0.001, ****P < 0.0001 at the indicated time point. NS, not significant.
Figure 5
Figure 5. Single-cell RNA sequencing analysis of kidneys from atrophy and repair models for biomarker gene expression.
Atrophy and repair kidneys were harvested at 14 days after injury for cell isolation followed by single-cell RNA sequencing analysis. Cell clustering and data analysis were performed using Seurat v3.1.5 R package. Relevant biomarker gene expression is shown as a dot plot. PT, proximal tubule; TAL, thick ascending limb of the loop of Henle; DCT, distal convoluted tubule; CD, collecting duct; DC, dendritic cells.

References

    1. Chawla LS, et al. Acute kidney injury and chronic kidney disease as interconnected syndromes. N Engl J Med. 2014;371(1):58–66. doi: 10.1056/NEJMra1214243. - DOI - PMC - PubMed
    1. Ishani A, et al. Acute kidney injury increases risk of ESRD among elderly. J Am Soc Nephrol. 2009;20(1):223–228. doi: 10.1681/ASN.2007080837. - DOI - PMC - PubMed
    1. Wald R, et al. Chronic dialysis and death among survivors of acute kidney injury requiring dialysis. JAMA. 2009;302(11):1179–1185. doi: 10.1001/jama.2009.1322. - DOI - PubMed
    1. Ferenbach DA, Bonventre JV. Mechanisms of maladaptive repair after AKI leading to accelerated kidney ageing and CKD. Nat Rev Nephrol. 2015;11(5):264–276. doi: 10.1038/nrneph.2015.3. - DOI - PMC - PubMed
    1. Xu K, et al. Unique transcriptional programs identify subtypes of AKI. J Am Soc Nephrol. 2017;28(6):1729–1740. doi: 10.1681/ASN.2016090974. - DOI - PMC - PubMed

Publication types