. 2020 Dec 8:26:e927476.
doi: 10.12659/MSM.927476.

Molecular Mechanisms Underlying Intestinal Ischemia/Reperfusion Injury: Bioinformatics Analysis and In Vivo Validation

Affiliations

Molecular Mechanisms Underlying Intestinal Ischemia/Reperfusion Injury: Bioinformatics Analysis and In Vivo Validation

Fengshou Chen et al. Med Sci Monit. .

Abstract

BACKGROUND Intestinal ischemia/reperfusion (I/R) injury is a serious clinical complication. This study aimed to explore the hub genes and pathways of intestinal I/R injury. MATERIAL AND METHODS GSE96733 from the GEO website was extracted to analyze the differentially expressed genes (DEGs) of intestinal I/R injured and sham-operated mice at 3 h and 6 h after surgery. The DAVID and STRING databases were used to construct functional enrichment analyses of DEGs and the protein-protein interaction (PPI) network. In Cytoscape software, cytoHubba was used to identify hub genes, and MCODE was used for module analysis. Testing by qRT-PCR detected the expression of hub genes in intestinal I/R injury. Western blot analysis detected the key proteins involved with the important pathways of intestinal I/R injury. RESULTS IL-6, IL-10, CXCL1, CXCL2, and IL-1ß were identified as critical upregulated genes, while IRF7, IFIT3, IFIT1, Herc6, and Oasl2 were identified as hub genes among the downregulated genes. The qRT-PCR testing showed the expression of critical upregulated genes was significantly increased in intestinal I/R injury (P<0.05), while the expression of hub downregulated genes was notably reduced (P<0.05). The proteins of CXCL1 and CXCR2 were upregulated following intestinal I/R injury (P<0.05) and the CXCL1/CXCR2 axis was involved with intestinal I/R injury. CONCLUSIONS The results of the present study identified IL-6, IL-10, CXCL1, CXCL2, IL-1ß, IRF7, IFIT3, IFIT1, Herc6, and Oasl2 as hub genes in intestinal I/R injury and identified the involvement of the CXCL1/CXCR2 axis in intestinal I/R injury.


Conflict of interest statement

Conflicts of interest

None.

Figures

Figure 1
Figure 1
Data normalization. Box plots of gene expression in the post intestinal ischemia/reperfusion injury and sham groups at 3 h or 6 h (A) before and (B) after normalization.
Figure 2
Figure 2
The volcano plot of differentially expressed genes (DEGs). (A) The volcano plot of 1171 DEGs at 3 h post intestinal I/R. (B) The volcano plot of 1885 DEGs at 6 h post intestinal I/R injury. The red dots represent upregulated DEGs and the green dots indicate downregulated DEGs.
Figure 3
Figure 3
Hierarchical clustering analysis included DEGs between the sham control and intestinal ischemia/reperfusion (I/R) injury groups. Relative levels of gene expression are represented using a color scale: blue represents downregulated gene levels and red represents upregulated gene levels. (A) 3 h post intestinal I/R injury vs. sham. GSM2539097/2539098/2539099/2539100 refers to the intestine samples from the sham control group, and GSM2539106/2539105/2539108/2539107 refers to the intestine samples from the intestinal I/R group. (B) 6 h post intestinal I/R vs. sham. GSM2539097/2539098/2539099/2539100 refers to the intestine samples from the sham control group, and GSM2539116/2539113/2539115/2539114 refers to the intestine samples from the intestinal I/R group.
Figure 4
Figure 4
The Gene Ontology (GO) annotations for biological process of the 10 most significant GO enrichment terms. The vertical axis represents enriched GO categories and the horizontal axis represents the ratio of enriched genes in the selected category to all genes analyzed in the GO enrichment analyses. (A) Dot plot shows the upregulated differentially expressed genes (DEGs) at 3 h post intestinal ischemia/reperfusion (I/R) injury; (B) Dot plot shows the downregulated DEGs at 3h post intestinal I/R; (C) Dot plot shows the upregulated DEGs at 6 h post intestinal I/R; (D) Dot plot shows the downregulated DEGs at 6 h post intestinal I/R.
Figure 5
Figure 5
The Kyoto Encyclopedia of Genes and Genomes (KEGG) pathway analysis of the 10 most significant KEGG enrichment terms. The vertical axis represents enriched KEGG categories, whereas the horizontal axis represents the ratio of enriched genes in the selected category to all genes analyzed in the KEGG enrichment analyses. (A) Dot plot shows the upregulated differentially expressed genes (DEGs) at 3 h post intestinal ischemia/reperfusion (I/R) injury; (B) Dot plot shows the downregulated DEGs at 3 h post intestinal I/R; (C) Dot plot shows the upregulated DEGs at 6 h post intestinal I/R; (D) Dot plot shows the downregulated DEGs at 6 h post intestinal I/R.
Figure 6
Figure 6
Venn diagrams of differentially expressed genes (DEGs) at 3 h and 6 h post intestinal ischemia/reperfusion (I/R) injury, including (A) upregulated DEGs following intestinal I/R. (B) Downregulated DEGs following intestinal I/R injury.
Figure 7
Figure 7
Protein–protein interaction network of upregulated differentially expressed genes. Higher degree nodes had larger size.
Figure 8
Figure 8
Protein–protein interaction network of downregulated differentially expressed genes. Higher degree nodes had larger size.
Figure 9
Figure 9
Validation of the mRNA expression levels of hub genes in the mice model of intestinal ischemia/reperfusion (I/R) injury and sham-operated samples. (A) The hub genes identified for common upregulated differentially expressed genes (DEGs) at 3 h and 6 h post intestinal I/R injury. (B) The hub genes identified for common downregulated DEGs at 3 h and 6 h post intestinal I/R injury. * P<0.05.
Figure 10
Figure 10
The modules a (A), b (B), c (C), d (D), and e (E) obtained from the protein–protein interaction (PPI) network. (A–D) The visualized genes of modules in the upregulated differentially expressed genes (DEGs) PPI network. (E) The visualized genes of modules in the downregulated DEGs PPI network.
Figure 11
Figure 11
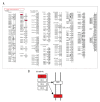
CXCR2 and CXCL1 in the Cytokine-cytokine receptor interaction pathway. (A) Map of the Cytokine-cytokine receptor interaction pathway. (B) CXCR2 and CXCL1 are indicated by a red rectangle in the Cytokine-cytokine receptor interaction pathway.
Figure 12
Figure 12
Protein expression levels of CXCR2 and CXCL1 in the mice model of intestinal ischemia/reperfusion (I/R) injury. (A) Western blot analysis showed that I/R increased CXCR2 protein expression at 3 h and 6 h post intestinal I/R injury. (B) Western blot analysis showed high protein expression of CXCL1 induced by I/R at 3 h and 6 h post intestinal I/R injury. * P<0.05 compared to sham-operated group.

Similar articles

Cited by

References

    1. Corcos O, Nuzzo A. Gastro-intestinal vascular emergencies. Best Pract Res Clinl Gastroenterol. 2013;27(5):709–25. - PubMed
    1. Kalogeris T, Baines CP, Krenz M, Korthuis RJ. Cell biology of ischemia/reperfusion injury. Int Rev Cell Mol Biol. 2012;298:229–317. - PMC - PubMed
    1. Meszaros AT, Buki T, Fazekas B, et al. Inhalation of methane preserves the epithelial barrier during ischemia and reperfusion in the rat small intestine. Surgery. 2017;161(6):1696–709. - PubMed
    1. Oldenburg WA, Lau LL, Rodenberg TJ, et al. Acute mesenteric ischemia – A clinical review. Arch Intern Med. 2004;164(10):1054–62. - PubMed
    1. Berlanga J, Prats P, Remirez D, et al. Prophylactic use of epidermal growth factor reduces ischemia/reperfusion intestinal damage. Am J Pathol. 2002;161(2):373–79. - PMC - PubMed

MeSH terms