Clinical Trial
. 2020 Dec 8;16(12):e1009101.
doi: 10.1371/journal.ppat.1009101. eCollection 2020 Dec.

RV144 HIV-1 vaccination impacts post-infection antibody responses

Affiliations
Clinical Trial

RV144 HIV-1 vaccination impacts post-infection antibody responses

Thembi Mdluli et al. PLoS Pathog. .

Erratum in

  • Correction: RV144 HIV-1 vaccination impacts post-infection antibody responses.
    Mdluli T, Jian N, Slike B, Paquin-Proulx D, Donofrio G, Alrubayyi A, Gift S, Grande R, Bryson M, Lee A, Dussupt V, Mendez-Rivera L, Sanders-Buell E, Chenine AL, Tran U, Li Y, Brown E, Edlefsen PT, O'Connell R, Gilbert P, Nitayaphan S, Pitisuttihum P, Rerks-Ngarm S, Robb ML, Gramzinski R, Alter G, Tovanabutra S, Georgiev IS, Ackerman ME, Polonis VR, Vasan S, Michael NL, Kim JH, Eller MA, Krebs SJ, Rolland M. Mdluli T, et al. PLoS Pathog. 2021 Mar 2;17(3):e1009386. doi: 10.1371/journal.ppat.1009386. eCollection 2021 Mar. PLoS Pathog. 2021. PMID: 33651828 Free PMC article.

Abstract

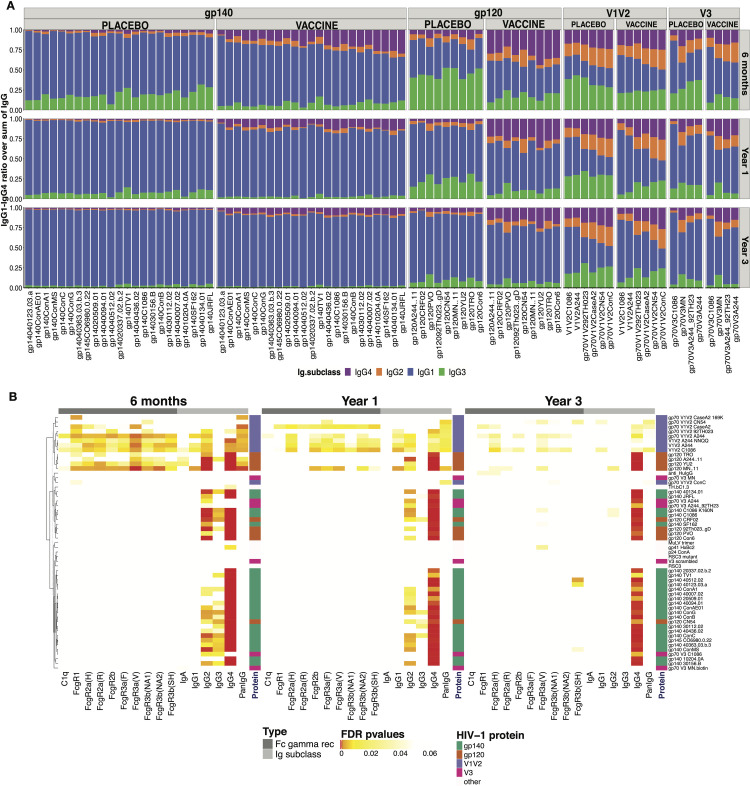
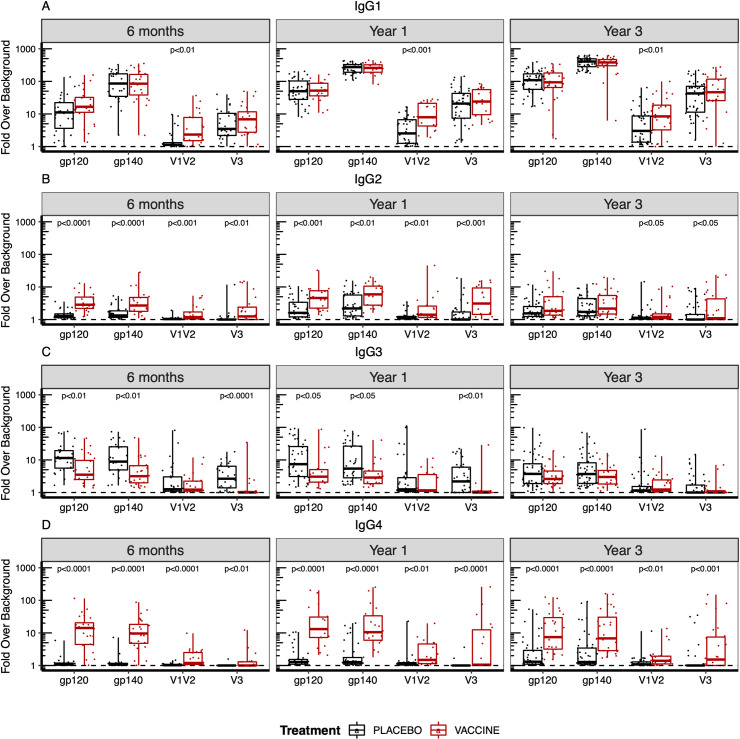
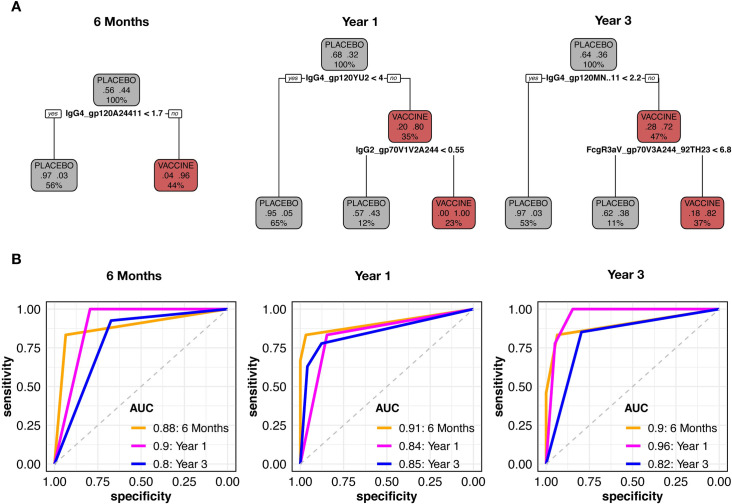
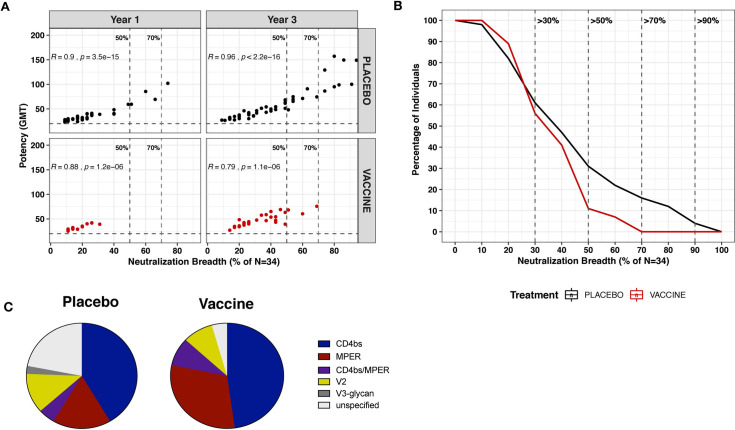
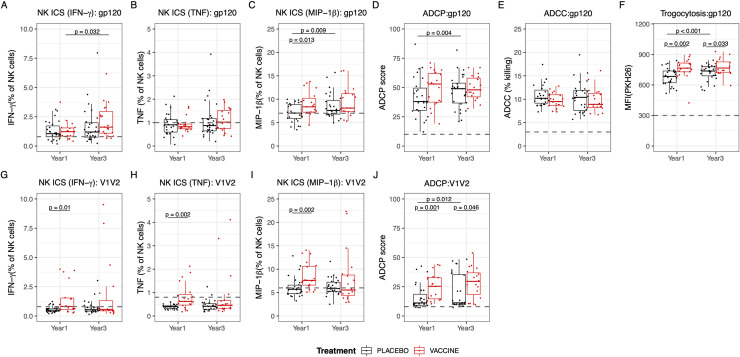
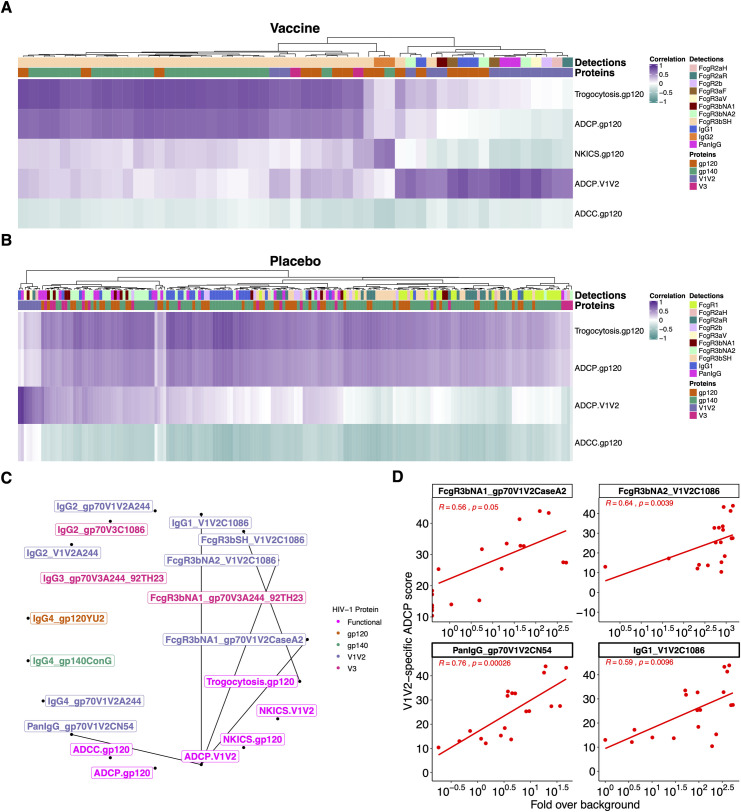
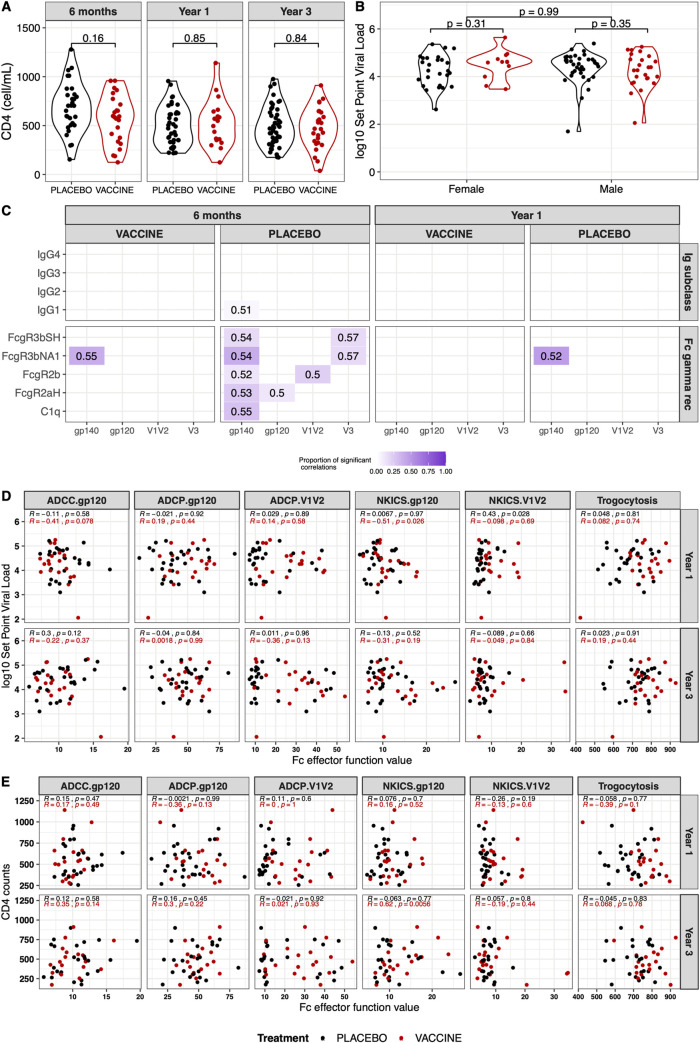
The RV144 vaccine efficacy clinical trial showed a reduction in HIV-1 infections by 31%. Vaccine efficacy was associated with stronger binding antibody responses to the HIV Envelope (Env) V1V2 region, with decreased efficacy as responses wane. High levels of Ab-dependent cellular cytotoxicity (ADCC) together with low plasma levels of Env-specific IgA also correlated with decreased infection risk. We investigated whether B cell priming from RV144 vaccination impacted functional antibody responses to HIV-1 following infection. Antibody responses were assessed in 37 vaccine and 63 placebo recipients at 6, 12, and 36 months following HIV diagnosis. The magnitude, specificity, dynamics, subclass recognition and distribution of the binding antibody response following infection were different in RV144 vaccine recipients compared to placebo recipients. Vaccine recipients demonstrated increased IgG1 binding specifically to V1V2, as well as increased IgG2 and IgG4 but decreased IgG3 to HIV-1 Env. No difference in IgA binding to HIV-1 Env was detected between the vaccine and placebo recipients following infection. RV144 vaccination limited the development of broadly neutralizing antibodies post-infection, but enhanced Fc-mediated effector functions indicating B cell priming by RV144 vaccination impacted downstream antibody function. However, these functional responses were not associated with clinical markers of disease progression. These data reveal that RV144 vaccination primed B cells towards specific binding and functional antibody responses following HIV-1 infection.


Conflict of interest statement

The authors have declared that no competing interests exist.

Figures

Fig 1
Fig 1. RV144 vaccination primed IgG2, IgG4 and V1V2 binding responses after HIV-1 breakthrough infection.
(A) Distribution of IgG subclasses to HIV-1 antigens in vaccine and placebo recipients at 6 months (N = 24 vaccine, 31 placebo), one year (N = 18 vaccine, 39 placebo), and three years (N = 27 vaccine, 49 placebo) after HIV-1 diagnosis. Mean signal of antigen specific IgG1, IgG2, IgG3 and IgG4 (blue, orange, green, purple, respectively) are represented as a fraction of the sum of all IgG subclasses. (B) Significant differences between vaccine and placebo groups, using Mann–Whitney U test, measured at 6 months, 1 and 3 years after diagnosis are represented with colored cells. Each cell represents FDR-adjusted p-values where the color indicates the statistical significance: FDR ≤ 0.001 in red, FDR ≤ 0.01 in orange, FDR ≤ 0.05 in yellow and white marks non-significant differences. Columns represent binding responses against complement (C1q), FcγRs, Ig isotypes and subclasses. Each row corresponds to an HIV-1 antigen: gp140 (green), gp120 (orange), V1V2 (purple) and V3 (magenta). The axis on the right represents the hierarchy of clusters.
Fig 2
Fig 2. B cell priming in vaccine recipients altered subclass and antibody specificity to HIV-1 following infection.
(A) IgG1, (B) IgG2, (C) IgG3, and (D) IgG4 subclass binding to HIV-1 Env antigens at 6 months (N = 24 vaccine, 31 placebo), one year (N = 18 vaccine, 39 placebo), and three years (N = 27 vaccine, 49 placebo) post-HIV-1 diagnosis. The fold over background is represented for each Env antigen as a composite score corresponding to the geometric mean of the fold over background across the different antigens tested: 9 gp120s, 23 gp140s, 6 V1V2 gp70 and 4 V3 gp70 antigen. P values were calculated by Mann-Whitney U test and adjusted by False Discovery Rate (FDR) for multiple comparisons. Only significant (p<0.05) p values are shown.
Fig 3
Fig 3. IgG4 gp120 features were the most informative to classify the vaccine group.
(A) Representative CART trees generated with the top non-redundant predictors which classified vaccine (red) and placebo recipients (black). (B) ROC curves were generated for CART models corresponding to each time point and tested with data from the other time points. AUC generated with the data used to train the model were evaluated through cross-validation while AUC at other time points (time points with data that were not used to train the model) were evaluated by testing the model with these data.
Fig 4
Fig 4. RV144 vaccination restricted the development of broadly neutralizing antibodies following HIV-1 infection.
Vaccine recipients are represented in red and placebo recipients in black. (A) Neutralization breadth and potency (geometric mean titer (GMT)) of vaccine and placebo recipients at year 1 (N = 18 vaccine, 39 placebo) and year 3 (N = 27 vaccine, 49 placebo). Neutralization breadth is the percentage of viruses neutralized out of 34 pseudoviruses. Vertical lines indicate 50% and 70% neutralization breadth. (B) Reverse cumulative distribution curves showing the proportion of vaccine (N = 27) and placebo recipients (N = 49) who neutralized a specific fraction of the panel of 34 pseudoviruses at year 3 post-diagnosis. Only infected placebo recipients achieved >70% neutralization breadth (N = 8) at year 3 post-diagnosis. (C) Predicted neutralization specificity of vaccine and placebo recipients with >30% neutralization breadth.
Fig 5
Fig 5. Vaccine recipients demonstrated increased Fc effector functions to V1V2 1 year after HIV-1 diagnosis.
Vaccine recipients are represented in red and placebo recipients in black. (A to J) Fc effector function assays to gp120 AE 244 (A-F) or gp70 V1V2 92TH023 (G-J) antigens using year 1 and year 3 samples from vaccine and placebo recipients. Differences in Fc effector function between each group were assessed by NK cell activation (expression of IFNg (A,G), TNF (B,H), or MIP-1b (C,I)), ADCP (D,J), ADCC (E), and trogocytosis (F). The black dashed line represents the positive cut-offs, which were calculated based on two negative controls. Groups were compared using Mann-Whitney U tests, and differences between year 1 and year 3 within the vaccine or placebo groups were calculated using Wilcoxon signed rank test (N = 19 vaccine, 28 placebo). Only significant (<0.05) p values are shown.
Fig 6
Fig 6. A combination of antibody binding features and Fc effector functions defined a vaccine profile.
PLSDA models are shown for year 1 (A, B) and year 3 (C, D) with PLSDA scores on the left and loadings on the right. (D) Cross-validation confirmed that PLSDA models were significantly better than null models generated by permuting treatment groups. (E, F) Performance of PLSDA classification models compared to group permutated models. Cross-validation confirmed that PLSDA models were significantly better than null models generated by permuting treatment groups.
Fig 7
Fig 7. V1V2 responses were associated with V1V2-specific ADCP responses in RV144 vaccinees.
Canonical sPLS model highlighted Ab binding features which covaried with the Fc effector functions for vaccine (A) and placebo (B) recipients. Colors show the direction of the associations: positive (dark purple) and inverse (dark cyan). (C) Correlation network highlighting the vaccine RF-selected predictive features that correlated with Fc effector functions. (D) Scatter plots showing significant Spearman correlations between V1V2-specific ADCP and binding responses in vaccine recipients.
Fig 8
Fig 8. B cell priming from RV144 did not impact markers of disease progression following HIV-1 infection.
Vaccine recipients are represented in red and placebo recipients in black. (A) CD4 T cell counts at 6 months (N = 24 vaccine, 31 placebo), year 1 (N = 18 vaccine, 39 placebo) and year 3 (N = 27 vaccine, 49 placebo) and (B) set point viral load (N = 37 vaccine, 63 placebo) showed no significant differences between the vaccine and placebo recipients. (C) Proportion of associations between IgG or FcγR responses and set point viral load that showed significant correlations (Spearman Rho > 0.5, p-value < 0.5). The proportion of significant correlations is shown with a gradient from white to dark purple. The median Rho value of these significant correlations is reported in each cell. (D) No significant correlations between Fc effector functions and set point viral load in vaccine (red) or placebo (black) recipients, except for Env-gp120-specific NKICS assay showed a moderate association in vaccine participants at year 3. (E) No significant correlations between Fc effector functions and CD4 cell counts in vaccine (red) or placebo (black) recipients, except for Env-gp120-specific NKICS in vaccine participants at year 3.

References

    1. Medlock J, Pandey A, Parpia AS, Tang A, Skrip LA, Galvani AP. Effectiveness of UNAIDS targets and HIV vaccination across 127 countries. Proc Natl Acad Sci U S A. 2017;114(15):4017–22. Epub 2017/03/23. 10.1073/pnas.1620788114 - DOI - PMC - PubMed
    1. Rerks-Ngarm S, Pitisuttithum P, Nitayaphan S, Kaewkungwal J, Chiu J, Paris R, et al. Vaccination with ALVAC and AIDSVAX to prevent HIV-1 infection in Thailand. N Engl J Med. 2009;361(23):2209–20. Epub 2009/10/22. 10.1056/NEJMoa0908492 . - DOI - PubMed
    1. Haynes BF, Gilbert PB, McElrath MJ, Zolla-Pazner S, Tomaras GD, Alam SM, et al. Immune-correlates analysis of an HIV-1 vaccine efficacy trial. N Engl J Med. 2012;366(14):1275–86. Epub 2012/04/06. 10.1056/NEJMoa1113425 - DOI - PMC - PubMed
    1. Zolla-Pazner S, deCamp A, Gilbert PB, Williams C, Yates NL, Williams WT, et al. Vaccine-induced IgG antibodies to V1V2 regions of multiple HIV-1 subtypes correlate with decreased risk of HIV-1 infection. PLoS One. 2014;9(2):e87572 Epub 2014/02/08. 10.1371/journal.pone.0087572 - DOI - PMC - PubMed
    1. Rolland M, Edlefsen PT, Larsen BB, Tovanabutra S, Sanders-Buell E, Hertz T, et al. Increased HIV-1 vaccine efficacy against viruses with genetic signatures in Env V2. Nature. 2012. Epub 2012/09/11. 10.1038/nature11519 [pii]. . - DOI - PMC - PubMed

Publication types