. 2020 Dec 8;15(12):e0231124.
doi: 10.1371/journal.pone.0231124. eCollection 2020.

Onset hyperalgesia and offset analgesia: Transient increases or decreases of noxious thermal stimulus intensity robustly modulate subsequent perceived pain intensity

Affiliations

Onset hyperalgesia and offset analgesia: Transient increases or decreases of noxious thermal stimulus intensity robustly modulate subsequent perceived pain intensity

Benedict J Alter et al. PLoS One. .

Abstract

Reported pain intensity depends not only on stimulus intensity but also on previously experienced pain. A painfully hot temperature applied to the skin evokes a lower subjective pain intensity if immediately preceded by a higher temperature, a phenomenon called offset analgesia. Previous work indicated that prior pain experience can also increase subsequent perceived pain intensity. Therefore, we examined whether a given noxious stimulus is experienced as more intense when it is preceded by an increase from a lower temperature. Using healthy volunteer subjects, we observed a disproportionate increase in pain intensity at a given stimulus intensity when this intensity is preceded by a rise from a lower intensity. This disproportionate increase is similar in magnitude to that of offset analgesia. We call this effect onset hyperalgesia. Control stimuli, in which a noxious temperature is held constant, demonstrate that onset hyperalgesia is distinct from receptor or central sensitization. The absolute magnitudes of offset analgesia and onset hyperalgesia correlate with each other but not with the noxious stimulus temperature. Finally, the magnitude of both offset analgesia and onset hyperalgesia depends on preceding temperature changes. Overall, this study demonstrates that the perceptual effect of a noxious thermal stimulus is influenced in a bidirectional manner depending upon both the intensity and direction of change of the immediately preceding thermal stimulus.


Conflict of interest statement

The authors have declared that no competing interests exist.

Figures

Fig 1
Fig 1. Experimental design and examples of data analysis.
A. Subjects underwent (1) heat pain threshold testing, (2) an ascending series of suprathreshold, constant, 30-second, temperature stimuli to determine an individualized temperature that would elicit a COVAS pain rating of 50 mm/100 mm, and finally (3) a randomized mixture of suprathreshold, 30-second temperature stimuli testing the importance of direction of stimulus intensity change on pain perception. The mixture included transient, changing, supra-threshold noxious thermal stimuli (top row) and comparison constant stimuli (bottom row) shown. The data plotted are examples from a single subject in which T1 = 45°C. B.–D. Examples of continuous pain intensity measured by COVAS and thermode temperature during stepped stimuli with appropriate control stimuli superimposed from a different single subject in which T1 = 47°C. Inverted (Inv) stimulus data are plotted overlapping with the control T2 stimulus data to illustrate differences in subjective pain intensity produced by transient noxious thermal stimulus changes. During the t3 period (shaded area), both Inv and constant T2 stimuli are held at the same thermode temperature, differing by immediately preceding noxious thermal temperatures (B). In this subject, despite the same thermode temperature the reported pain intensity is higher during the t3 period for the Inv stimulus than for the constant control thermal stimulus. Similarly, offset stimulus (C) and stepdown (D) data are plotted with constant control T1 data to illustrate differences in pain intensity. Pain intensity changes are quantified in two ways. The first is a comparison between stepped and control stimuli (dotted arrows labeled “a”). For example in B, the a arrow shows the difference between the local maximum of the COVAS pain curve during the Inv stimulus and the pain intensity at the same timepoint during the control T2 stimulus. The second is a comparison made within a given stimulus (“b” arrows depict differences within the stepped stimuli between local maxima and minima of the COVAS pain curves). Differences between stepped and control stimuli (a arrows) and within-stimulus changes during stepped stimuli (b arrows) were extracted for group-level analysis.
Fig 2
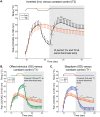
Fig 2. Pain intensity disproportionately increases with an increase in noxious-range temperature.
A. Group mean temperature (top) and continuous pain intensity rating (bottom) curves from the Inverted (Inv, black circles) and T2 constant control (orange triangles) stimuli are shown. B. Group mean temperature (top) and continuous pain intensity rating (bottom) curves from the offset stimulus (OS, green circles) and T1 constant control (orange triangles) stimuli are shown. C. Group mean temperature (top) and continuous pain intensity rating (bottom) curves from the Stepdown (Sdn, blue circles) and T1 control (orange triangles) stimuli are shown. A–C. Symbols represent group-level means and error bars represent 95% confidence intervals. P-values: * p<0.05, ** p<0.01, *** p<0.001, **** p<0.0001.
Fig 3
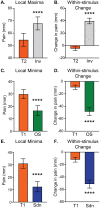
Fig 3. Extrema in continuously-rated pain intensity during stepped stimuli are significantly different than constant control stimuli.
Pain intensity values on the computerized visual analogue scale were extracted at local maxima (A & B) and minima (C-F) for each subject as described in Fig 1. Pain intensities at matching timepoints were also extracted during constant control stimuli (T1 or T2). In the left column, pain intensities are compared between stepped and control stimuli (arrow “a” in Fig 1). In the right column, the change in pain intensity within the stepped curve is compared with the change in the control curve during the same time interval (arrow “b” in Fig 1). Group means with 95% CI are depicted in the bar graphs. Paired t-tests showed significant differences: **** p<0.0001.
Fig 4
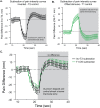
Fig 4. The absolute magnitude of relative hyperalgesia and hypoalgesia following equivalent temperature increases and decreases is similar.
A. Pain intensity curves during Inv and T2 stimuli were subtracted for each subject with group mean values plotted; error bars = 95% CI. B. Similarly, pain intensity curves during OS and T1 stimuli were subtracted with group mean values plotted; error bars = 95% CI. In A. and B., shaded regions reflect the time period in which thermode temperatures are the same between stepped (Inv or OS) and constant (T2 or T1) stimuli. C. To compare pain difference curves, the inverse of the OS-T1 subtraction curve in B. was plotted with the Inv-T2 subtraction curve. Means and 95% CI are shown at each timepoint.
Fig 5
Fig 5. When controlled for adaptation by accounting for pain intensity changes during constant control stimuli, despite opposite directions of change, there is no significant difference in the change in absolute magnitude of pain report produced by stepped stimuli.
A. The difference between pain intensity extrema (max for Inv, min for OS) and the pain intensity during control stimuli (T2 for Inv, T1 for OS), reflecting “a” arrows in Fig 1, was determined within each subject. B. Change in pain within stimulus (max—min, “b” arrows in Fig 1), for stepped stimuli and matched timepoints during control stimuli. A 1-way RM ANOVA showed significant main effect of stimulus. Post-hoc testing showed significant differences including those shown. C. Subtraction curves were analyzed within each subject for extrema and within-curve change. For all graphs, group mean with 95% CI error bars are plotted. P-values: ** p<0.01, *** p<0.001, **** p<0.0001.
Fig 6
Fig 6. An increase in temperature within the noxious range without an immediately preceding decrease produces a comparatively small increase in pain intensity.
A. Group mean continuous pain intensity rating curves during the t2 periods and beginning of the t3 periods of the OS (green circles) protocol and T2 control (red triangles) protocol are plotted. B. Group mean pain intensity local maxima during the OS stimulus protocol and the pain intensity at the equivalent timepoint during the control T2 stimulus are plotted. C. Group mean continuous pain intensity rating curves from the OS (green circles) and Sdn (blue circles) stimuli are plotted. D. Group mean pain intensity local maxima during the OS stimulus and the pain intensity at the equivalent timepoint during the control Sdn stimulus are plotted. For all graphs (A.–D.), group means are plotted with error bars representing 95% CI. P-values: ** p<0.01, *** p<0.001, **** p<0.0001. ND = no difference (p>0.05).
Fig 7
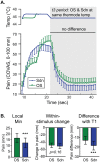
Fig 7. A noxious temperature decrease without a prior increase produces a subtly larger decrease in pain intensity.
A. Group mean temperature (top) and continuous pain intensity rating (bottom) curves from the Sdn (blue circles) and OS (green circles) stimuli are shown. Symbols represent group-level mean and error bars represent 95% confidence intervals. Although a 2-way RM ANOVA with matching by stimulus and time showed main effects of time and stimulus, there was no statistically significant difference at any timepoint during the t3 interval. B. Group means obtained by within-subject analysis of minima (local min), the change in pain from maxima to minima (within-stimulus change) and the difference between stepped curve minima and T1 at equivalent timepoints (difference with T1) are plotted with error bars representing 95% CI. P-values: *** p<0.001.
Fig 8
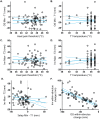
Fig 8. Pain intensity amplification with either increases or decreases are independent of temperature but are correlated with each other.
Scatter plots are shown with each point representing an individual subject. Heavy cyan lines represent best-fit lines from linear regression analysis with thin cyan lines representing bounds of the 95% confidence intervals calculated as part of the linear regression. No correlation exists between stimulus intensity (heat pain threshold (A or C) or T1 stimulus temperature used (B or D)) and pain intensity modulation during the t3 period by either preceding noxious temperature decreases (OS Min-T1) or increases (Inv Max-T2). Although an inverse correlation between onset hyperalgesia and offset analgesia does not achieve statistical significance when comparing local extrema (E), a significant inverse correlation is detected using within-stimulus change (F).

References

    1. Price DD. Psychological and neural mechanisms of pain. New York: Raven Press; 1988. x, 241 p. p.
    1. Wager TD, Atlas LY. The neuroscience of placebo effects: connecting context, learning and health. Nature Reviews Neuroscience. 2015;16:403–18. 10.1038/nrn3976 - DOI - PMC - PubMed
    1. Keltner JR, Furst A, Fan C, Redfern R, Inglis B, Fields HL. Isolating the modulatory effect of expectation on pain transmission: a functional magnetic resonance imaging study. J Neurosci. 2006;26(16):4437–43. 10.1523/JNEUROSCI.4463-05.2006 - DOI - PMC - PubMed
    1. Geuter S, Koban L, Wager TD. The Cognitive Neuroscience of Placebo Effects: Concepts, Predictions, and Physiology. Annu Rev Neurosci. 2017;40:167–88. Epub 2017/04/13. 10.1146/annurev-neuro-072116-031132 - DOI - PubMed
    1. Hoffman GA, Harrington A, Fields HL. Pain and the placebo: what we have learned. Perspect Biol Med. 2005;48:248–65. 10.1353/pbm.2005.0054 - DOI - PubMed

Publication types