. 2020 Dec 8;16(12):e1007579.
doi: 10.1371/journal.pcbi.1007579. eCollection 2020 Dec.

A generative spiking neural-network model of goal-directed behaviour and one-step planning

Affiliations

A generative spiking neural-network model of goal-directed behaviour and one-step planning

Ruggero Basanisi et al. PLoS Comput Biol. .

Abstract

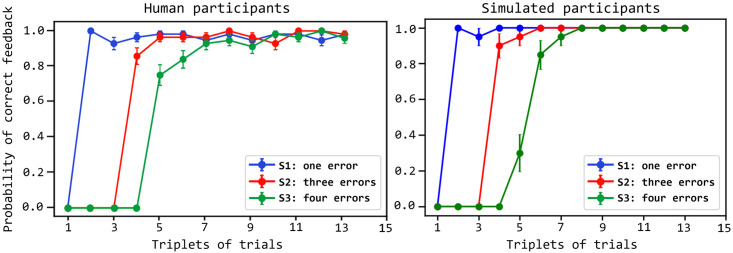
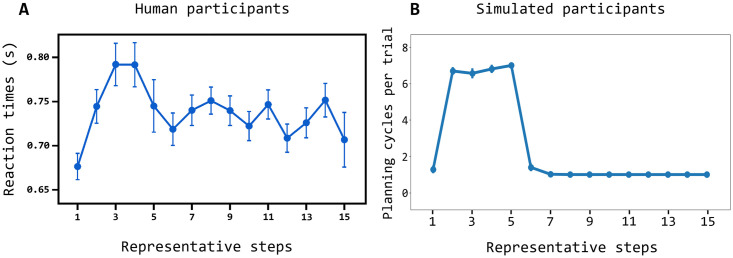
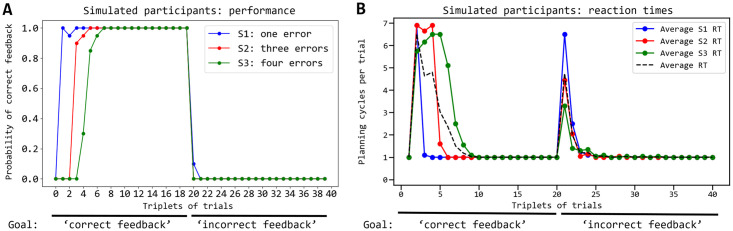
In mammals, goal-directed and planning processes support flexible behaviour used to face new situations that cannot be tackled through more efficient but rigid habitual behaviours. Within the Bayesian modelling approach of brain and behaviour, models have been proposed to perform planning as probabilistic inference but this approach encounters a crucial problem: explaining how such inference might be implemented in brain spiking networks. Recently, the literature has proposed some models that face this problem through recurrent spiking neural networks able to internally simulate state trajectories, the core function at the basis of planning. However, the proposed models have relevant limitations that make them biologically implausible, namely their world model is trained 'off-line' before solving the target tasks, and they are trained with supervised learning procedures that are biologically and ecologically not plausible. Here we propose two novel hypotheses on how brain might overcome these problems, and operationalise them in a novel architecture pivoting on a spiking recurrent neural network. The first hypothesis allows the architecture to learn the world model in parallel with its use for planning: to this purpose, a new arbitration mechanism decides when to explore, for learning the world model, or when to exploit it, for planning, based on the entropy of the world model itself. The second hypothesis allows the architecture to use an unsupervised learning process to learn the world model by observing the effects of actions. The architecture is validated by reproducing and accounting for the learning profiles and reaction times of human participants learning to solve a visuomotor learning task that is new for them. Overall, the architecture represents the first instance of a model bridging probabilistic planning and spiking-processes that has a degree of autonomy analogous to the one of real organisms.


Conflict of interest statement

The authors have declared that no competing interests exist.

Figures

Fig 1
Fig 1. The visuomotor learning task used to validate the model.
Three colour stimuli are presented to the participants in a pseudo-random order, in particular in triplets each containing each colour exactly once. The action consists in pressing one out of five possible buttons with the right hand. The figure refers to an ideal participant who never repeats an error for the same colour and always repeats the correct action after discovering it. The four pictures refer to respectively the actions after one, two, four, and five triplets: a red cross and a green tick-mark refer to incorrect and correct colour-action sequences respectively. The colour receiving the first action in the second triplet is marked as the ‘first stimulus’ (S1), and such action is considered the as correct one for it. The colour different from S1 receiving the first action in the fourth triplet is marked as the ‘second stimulus’ (S2), and such action is considered as the correct one for it. The colour different from S1 and S2 receiving the first action in the fifth triplet is marked as the ‘third stimulus’ (S3), and such action is considered the correct one for it.
Fig 2
Fig 2. Architecture and functioning of the model: Components and information flow.
The architecture is formed by a planning component (representing input patterns, hidden causes of input patterns within an associative layer, expected events including actions, and goals), an exploration component selecting actions when planning is uncertain, and an arbitration component deciding when to plan, explore, or act. The figure also shows the timing of the processes taking place during a trial, with the first two left graphs showing the Planning (exploitation) and (possibly) Exploration phases and the right two graphs showing the Action execution and Learning phases. Blue arrows represent an example of information flow travelling stable connections during the Planning phase and red arrows represent information flows travelling connections that are updated during the Learning phase.
Fig 3
Fig 3. Graphical models of some probabilistic models usable to represent the dynamics of the world in planning systems.
Nodes represent probability distributions and directional links represent conditional dependence between probability distributions. (a) Hidden Markov Models (HMMs): these are formed by state nodes ‘s’ and observation nodes ‘o’. (b) Partially Observable Markov Decision Processes (POMDPs): these are also formed by action nodes ‘a’ and reward nodes ‘r’ (different versions of these models are possible based on the chosen nodes and their dependencies). (c) The HMMs considered here, where the planner knows the currently pursued goal ‘g’ and observes not only states but also actions (note that the task considered here involves a sequence of independent state-action-state experiences).
Fig 4
Fig 4. Comparison of the performance of the human and simulated participants.
The performance (y-axis) is measured as the proportion of correct feedback over the trial triplets (x-axis), plotted separately for the three different colour stimuli (S1, S2, S3). Curves indicate the values averaged over 14 human participants and 20 simulated participants; error bars indicate the standard error. The data of human participants are from [48].
Fig 5
Fig 5. Comparison of the reaction times of the humans and simulated participants.
(A) Reaction times of human participants averaged over S1, S2, and S3 (y-axis) for the ‘representative steps’ ([48]; x-axis); the ‘representative steps’ allow the alignment of the reaction times of the three stimuli so as to separate the exploration phase (first 5 steps) and the exploitation phase (6 steps onward); to this purpose, the reaction times for S1 obtained in succeeding trials from the first onward is assigned the steps (used to compute the averages shown in the plot) ‘1, 2, 6, 7, …’, whereas S2 is assigned the steps ‘1, 2, 3, 4, 6, 7, …’, and S3 is assigned the steps ‘1, 2, 3, 4, 5, 6, 7, …’; data are taken from [48]; (B) Reaction times of the model, measured as number of planning cycles performed in each trial, plotted in the same way as done for humans. Error bars indicate mean standard errors.
Fig 6
Fig 6. Evolution of the spiking activity of the associative layer units while planning, across the experiment trials.
To best interpret the figure, recall that: 15 planning cycles formed one planning sequence (forward sampling), a variable number of planning sequences was generated in one trial for a given colour, 3 trials for the different colours formed a triplet, 20 triplets formed the whole test. The figure shows data collected while the model planned during the trials of the experiment related to each colour, from trial one (T1) to trial 20 (T20). Each column of graphs corresponds to a different colour stimulus, respectively S1, S2, and S3. For each of the nine graphs, the x-axis indicates the indexes of the 400 neurons of the associative layer, and the y-axis indicates the 15 planning cycles of the planning sequences produced in each trial (in each graph the planning cycles progress from bottom to top). Each graph in particular reports the spikes of each neuron for multiple trials (T1-T3 for the bottom row of graphs, T4-T15 for the middle row, and T16-T20 for the third row) and for the multiple planning cycles of those trials: the colour of each little line indicates the proportion of spikes of the corresponding neuron during those trials and cycles.
Fig 7
Fig 7. Evolution during trials of the activation of the output layer units encoding the predicted observations and actions.
The three columns of graphs refer to the three colour stimuli; the three rows of graphs correspond to different succeeding sets of trials of the task (T1-T3, T4-T15, T16-T20). Each of the nine graphs shows the activation of the 10 output units (x-axis: units 1-3 encode the three colours, units 4-8 encode the 5 actions, and units 9-10 encode the correct/incorrect feedback) during the 15 steps of each trial (y-axis). The colour of the cells in each graph indicates the activation (normalised in [0, 1]) of the corresponding unit, averaged over the graph trials (e.g., T1-T3) and the planning cycles performed within such trials.
Fig 8
Fig 8. Possible neural trajectories simulated by the model during planning.
The three graphs show different neural trajectories that the associative component can generate for respectively the three colours S1, S2, and S3. For each graph, the x-axes indicates the associative neurons and the y-axis the planning time steps and a dot indicates that the corresponding neuron was active. The bolder curve within each graph marks the correct trajectory for the pursued goal ‘correct feedback’.
Fig 9
Fig 9. Behaviour of the system when the goal is switched to a new one, averaged over 20 simulated participants.
(A) Performance, averaged over the simulated participants, measured as probability of selection of the correct action (y-axis) along the trial triplets (x-axis); the pursued goal is switched from getting a ‘correct feedback’ to getting an ‘incorrect feedback’ at triplet 20. (B) Average reaction times measured during the same experiment shown in ‘A’.

References

    1. Dickinson A, Balleine B. Motivational control of goal-directed action. Animal Learning & Behavior. 1994; 22(1):1–18.
    1. Balleine BW, Dickinson A. Goal-directed instrumental action: contingency and incentive learning and their cortical substrates. Neuropharmacology. 1998; 37(4):407–419. 10.1016/S0028-3908(98)00033-1 - DOI - PubMed
    1. Dolan R, Dayan P. Goals and Habits in the Brain. Neuron. 2013; 80(2):312–325. 10.1016/j.neuron.2013.09.007 - DOI - PMC - PubMed
    1. Sutton RS, Barto AG. Reinforcement learning: an introduction. Cambridge, MA: The MIT Press; 1998.
    1. Sutton RS. Integrated architectures for learning, planning, and reacting based on approximating dynamic programming. In: Proceedings of the seventh international conference on machine learning. Vol. 216; 1990. p. 216–224.

Publication types