. 2020 Dec 8;16(12):e1009119.
doi: 10.1371/journal.ppat.1009119. eCollection 2020 Dec.

A small molecule that mitigates bacterial infection disrupts Gram-negative cell membranes and is inhibited by cholesterol and neutral lipids

Affiliations

A small molecule that mitigates bacterial infection disrupts Gram-negative cell membranes and is inhibited by cholesterol and neutral lipids

Jamie L Dombach et al. PLoS Pathog. .

Abstract

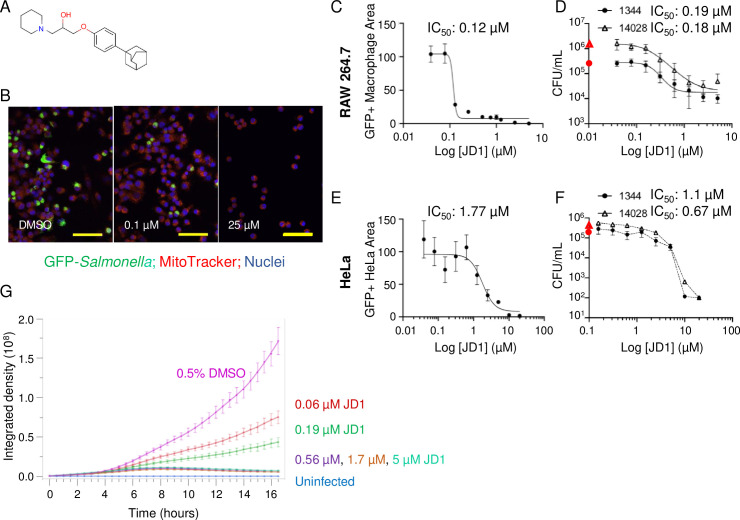
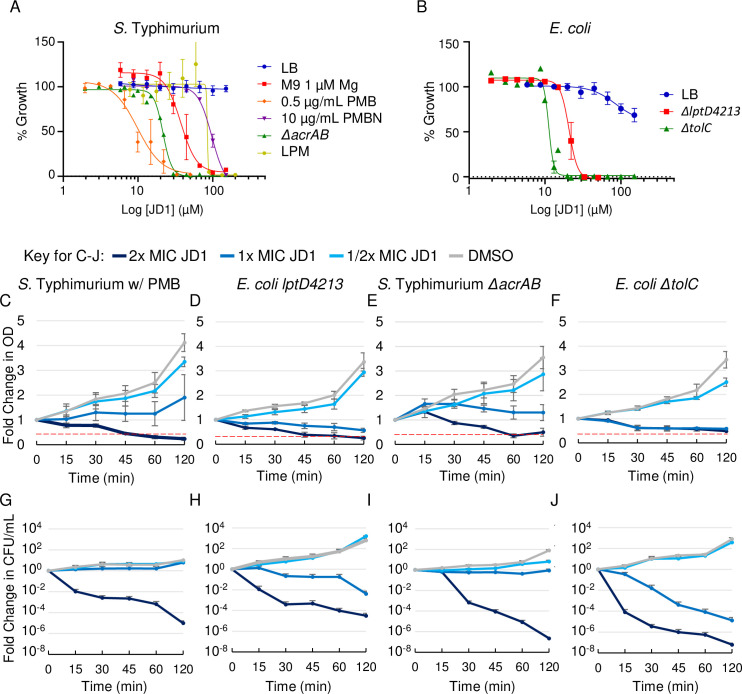
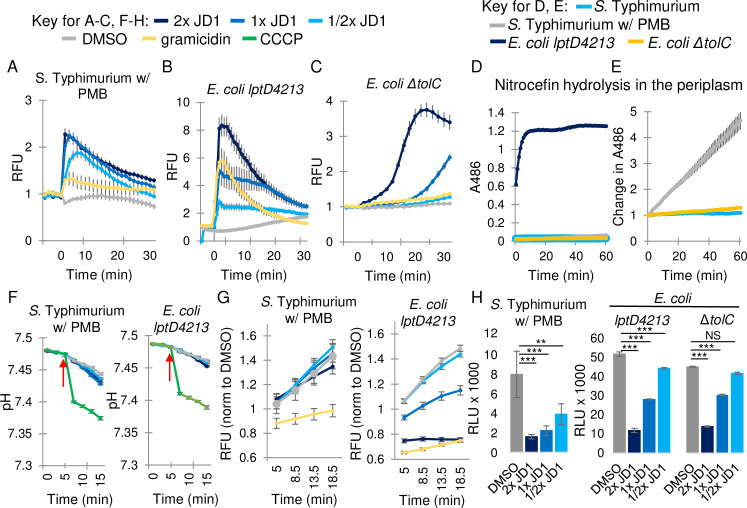
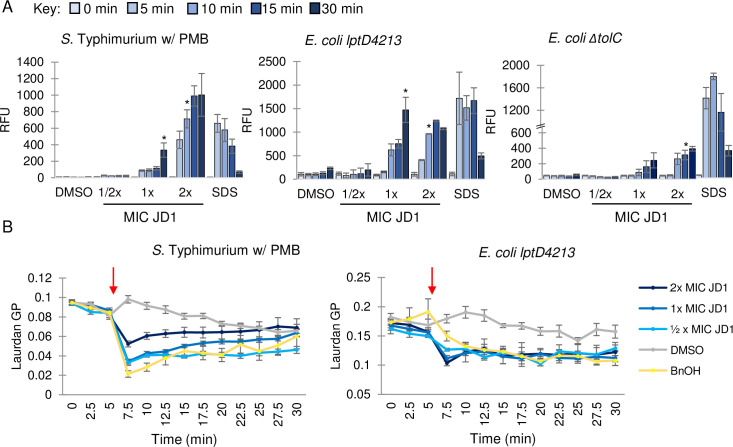
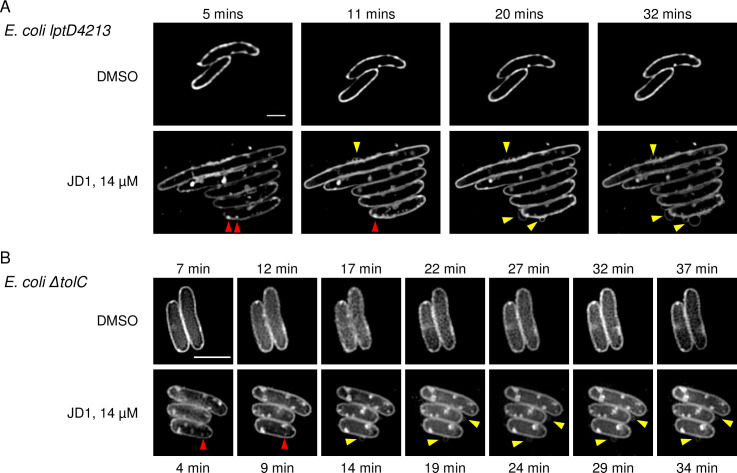
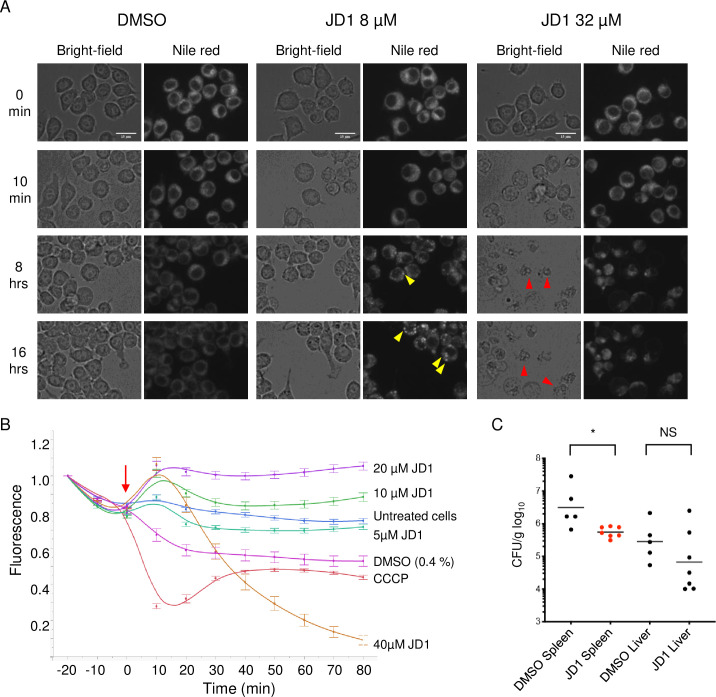
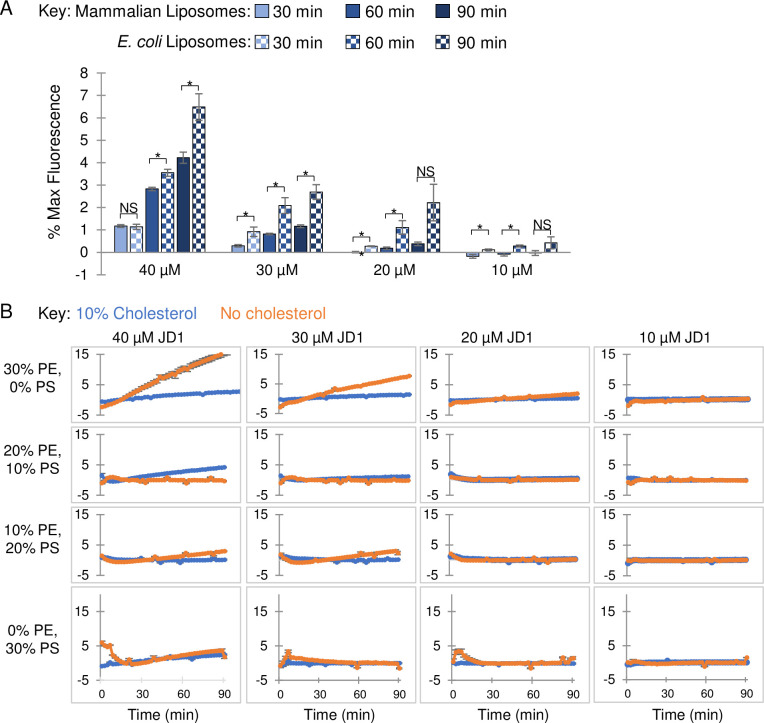
Infections caused by Gram-negative bacteria are difficult to fight because these pathogens exclude or expel many clinical antibiotics and host defense molecules. However, mammals have evolved a substantial immune arsenal that weakens pathogen defenses, suggesting the feasibility of developing therapies that work in concert with innate immunity to kill Gram-negative bacteria. Using chemical genetics, we recently identified a small molecule, JD1, that kills Salmonella enterica serovar Typhimurium (S. Typhimurium) residing within macrophages. JD1 is not antibacterial in standard microbiological media, but rapidly inhibits growth and curtails bacterial survival under broth conditions that compromise the outer membrane or reduce efflux pump activity. Using a combination of cellular indicators and super resolution microscopy, we found that JD1 damaged bacterial cytoplasmic membranes by increasing fluidity, disrupting barrier function, and causing the formation of membrane distortions. We quantified macrophage cell membrane integrity and mitochondrial membrane potential and found that disruption of eukaryotic cell membranes required approximately 30-fold more JD1 than was needed to kill bacteria in macrophages. Moreover, JD1 preferentially damaged liposomes with compositions similar to E. coli inner membranes versus mammalian cell membranes. Cholesterol, a component of mammalian cell membranes, was protective in the presence of neutral lipids. In mice, intraperitoneal administration of JD1 reduced tissue colonization by S. Typhimurium. These observations indicate that during infection, JD1 gains access to and disrupts the cytoplasmic membrane of Gram-negative bacteria, and that neutral lipids and cholesterol protect mammalian membranes from JD1-mediated damage. Thus, it may be possible to develop therapeutics that exploit host innate immunity to gain access to Gram-negative bacteria and then preferentially damage the bacterial cell membrane over host membranes.


Conflict of interest statement

The authors have declared that no competing interests exist.

Figures

Fig 1
Fig 1. Treatment of S. Typhimurium-infected macrophages and HeLa cells with JD1 prevents bacterial replication and/or survival.
A) Structure of JD1. B-D, G) RAW 264.7 macrophage-like cells were infected with S. Typhimurium harboring a chromosomal sifB::gfp reporter or E, F) HeLa cells were infected with S. Typhimurium harboring a chromosomal rpsM::gfp reporter. B-G) Cells were treated two hours after infection with vehicle (DMSO) or JD1 as indicated. After 18 hours of infection, cells were (B, C, E) fixed and imaged or (D, F) lysed and plated for enumeration of CFU. B) Representative micrograph of cells treated with DMSO (left), 0.1 μM JD1 (center), or 25 μM JD1 (right). Scale bars are 63 μm. C, E) GFP+ Macrophage/HeLa Area (as percent of DMSO) quantified from micrographs of cells treated with dilutions of JD1 from 5 μM for RAW 264.7 or 20 μM for HeLas. GFP+ Macrophage/HeLa Area is defined as the number of GFP-positive pixels per cell divided by the total number of pixels per cell, averaged across all cells in the field. Mean and SDs of technical duplicates from one of two biological replicates across 10 dilutions of JD1. The IC50 value is indicated. D, F) CFU/mL of cells treated with dilutions of JD1 from 5 μM for RAW 264.7 or 20 μM for HeLas infected with S. Typhimurium strain SL1344 or 14028 as indicated. The red symbol on the Y-axis is the CFU value from DMSO-treated samples. Mean and SDs of biological duplicates each performed in triplicate with 9 dilutions of JD1. The IC50 value is indicated. G) Live imaging of infected macrophages. Time 0 is 2 hours after infection, when compound or DMSO control were added. The integrated density is defined as signal obtained from maximum intensity projections of GFP+ Macrophage Area across six microscope fields. Data presented are the mean and SEM of three biological replicates each performed with technical triplicates. Uninfected cells show GFP baseline.
Fig 2
Fig 2. JD1 is bacteriostatic and bactericidal under conditions that compromise the outer membrane barrier.
A, B) Dose response curves monitoring bacterial growth under the indicated conditions/strains normalized to DMSO for A) S. Typhimurium and B) E. coli K12. Data are normalized to growth in DMSO (100%). Mean and SEM of at least three independent biological replicates performed with technical triplicates. C-J) Log phase cultures of the indicated strains/conditions were treated at time 0 with either DMSO or the corresponding MIC95 concentration of JD1 (Table 1). (C-F) Cultures were monitored for OD600. The red dotted line denotes the limit of detection. (G-J) Cultures were also plated for enumeration of CFU. Mean and SEM of three biological replicates performed with technical triplicates. The medium used was LB unless otherwise indicated next to the strain name.
Fig 3
Fig 3. JD1 appears to be a substrate for the AcrAB-TolC efflux pump.
A) Representative ITC for the binding of JD1 to E. coli AcrB. Each peak in the upper panel corresponds to the injection of 2 μL of 100 μM of JD1 in buffer containing 20 mM Na-HEPES (pH7.5), 0.05% DDM and 5% DMSO into the reaction containing 10 μM of E. coli monomeric AcrB in the same buffer. The lower panel shows the cumulative heat of reaction displayed as a function of injection number. The solid line is the least-square fit to the experimental data. B) Kd, enthalpy and entropy of the JD1-AcrB interaction. C) Diagram showing the ramR (ramA repressor) and ramA loci. Bold areas denote where the RamR homodimer binds to repress ramA expression. Base pairs in red are missing in all six JD1-resistant mutant strains. The box indicates the base pair deletion in BN10055 that interferes with RamR binding and increases efflux [47].
Fig 4
Fig 4. JD1 damages the bacterial cytoplasmic membrane without disrupting the pH gradient or respiration.
A) Cell membrane potential was monitored with the fluorescent dye DiSC3(5) for A) S. Typhimurium in LB with 0.5 μg/mL PMB, and B, C) the E. coli lptD4213 and ΔtolC mutant strains in LB. Cells were treated at time 0 with DMSO, gramicidin (32 μg/mL), or the corresponding MIC95 concentration of JD1 (Table 1). Average and SEM of three biological replicates performed with technical triplicates are shown for S. Typhimurium and E. coli ΔtolC. Average and SD from a representative of four biological replicates performed with technical triplicates are shown for E. coli lptD4213. Data are normalized to DMSO. D, E) Outer membrane permeability was monitored based on nitrocefin hydrolysis in the periplasm for S. Typhimurium in LB with 0.5 μg/mL PMB, and the E. coli lptD4213 and ΔtolC mutant strains in LB. E) The graph in D without E. coli lptD4213, shown as a change in fluorescent signal. Average and SEM of three biological replicates performed with technical triplicates. F) Intracellular pH was monitored with the fluorescent probe BCECF in cells grown as in A and B and then treated with the indicated concentrations of the protonophore CCCP (1 mM), DMSO (vehicle), or JD1 at the time shown by the red arrow. Average and SEM of three biological replicates performed with technical triplicates. G) Respiration rates of strains grown as in A and B, incubated with resazurin, and treated at time 0 as indicated. Average and SEM of three biological replicates performed with technical triplicates and normalized to DMSO at time 0. H) Intracellular ATP levels measured using the Promega BacTiter-Glo kit for cells grown as in A-C after 15 minutes of treatment with DMSO or JD1. Average and SEM of three biological replicates performed with technical triplicates. ** P ≤ 0.005, *** P ≤ 0.001.
Fig 5
Fig 5. JD1 perturbs membrane barrier function and fluidizes membranes.
A) Cell membrane permeability was monitored by PI fluorescence for S. Typhimurium in LB with 0.5 μg/mL PMB, and the E. coli lptD4213 and ΔtolC mutant strains in LB. Cells were treated at time 0 with the corresponding MIC95 concentration of JD1 (Table 1) or with DMSO or 0.008% SDS and samples were processed at the timepoints shown. Average and SEM of three biological replicates performed with technical triplicates. Asterisks indicate the first time point of JD1 treatment that resulted in a significant increase in PI fluorescence; all time points after the asterisk were also significant. * P ≤0.05 as determined by ANOVA. B) Membrane fluidity as monitored by laurdan generalized polarization (GP) for S. Typhimurium in LB with 0.5 μg/mL PMB, and the E. coli lptD4213 mutant strain in LB. Cells were treated at the time indicated (red arrow) with DMSO, benzyl alcohol (BnOH) (50 mM), or the corresponding MIC95 concentration of JD1 (Table 1). Average and SEM of three biological replicates performed with technical triplicates.
Fig 6
Fig 6. Bacterial membranes become distorted in response to JD1 treatment.
Nile red staining and SR-SIM imaging of E. coli A) lpt4213 and B) ΔtolC mutant strains on agar pads containing DMSO or JD1 at 14 μM. Cells were grown to mid-log phase, incubated with 30 μM of the lipophilic dye Nile red and placed on an agar pad. Imaging began as soon as cells were in focus (4–7 minutes) and continued for thirty minutes. Representative micrographs of three biological replicates are shown. Yellow arrowheads show Nile red wisps or circles outside of cells. Red arrowheads indicate puncta. Scale bar is 2 μm.
Fig 7
Fig 7. JD1 is toxic to host cell membranes at high concentrations but has antimicrobial activity in mice.
A) RAW 264.7 macrophages were stained with Nile red then treated with DMSO or dilutions of JD1. Cells were imaged every 10 minutes for 16 hours and representative micrographs are shown. Yellow arrowheads indicate examples of Nile red puncta; red arrowheads indicate examples of dead cells. Scale bars are 15 μm. B) Macrophages were stained with the mitochondrial membrane potential indicator TMRM and were imaged every ten minutes for 80 minutes. Cells were treated (red arrow) with DMSO, CCCP, or dilutions of JD1. Averages and SEM of three biological replicates performed with technical triplicates and normalized to time 0. C) C57Bl/6 mice were intraperitoneally inoculated with 8 x 10³ S. Typhimurium CFU. At 10 minutes and 24 hours after infection, mice were dosed with 1 mg/kg of JD1 by intraperitoneal injection. Mice were euthanized 48 hours after infection. The spleen and liver were homogenized and plated for enumeration of CFU. * P <0.05, Mann-Whitney.
Fig 8
Fig 8. In the presence of the neutral lipid PE, cholesterol protects liposomes from damage caused by JD1.
A) Liposomes with phospholipid content similar to mammalian (60% PC, 20% PE, 10% PS, 10% cholesterol) or E. coli (67% PC, 23% PG, and 10% CL) membranes were loaded with the fluorescent probe sulforhodamine B. Liposomes were treated with the indicated concentrations of JD1 or with control DMSO and monitored for fluorescence over a 90 minute period. Data are normalized to DMSO. Student’s t-tests comparing the two indicated samples, * P ≤0.05, ** P ≤0.005. B) Liposomes composed of 60% or 70% PC with 10% or 0% cholesterol, respectively, and with PE and PS concentrations ranging from 0–30% or 30–0%, respectively were exposed to JD1 and examined for sulforhodamine B release. Averages and SEM of three biological replicates performed with technical triplicates.

Similar articles

Cited by

References

    1. Zgurskaya HI, Rybenkov VV. Permeability barriers of Gram-negative pathogens. Ann N Y Acad Sci. 2020;1459: 5–18. 10.1111/nyas.14134 - DOI - PMC - PubMed
    1. Bertani B, Ruiz N. Function and Biogenesis of Lipopolysaccharides. EcoSal Plus. 2018;8 10.1128/ecosalplus.ESP-0001-2018 - DOI - PMC - PubMed
    1. Nishino K, Nikaido E, Yamaguchi A. Regulation and physiological function of multidrug efflux pumps in Escherichia coli and Salmonella. Biochimica et Biophysica Acta (BBA)—Proteins and Proteomics. 2009;1794: 834–843. 10.1016/j.bbapap.2009.02.002 - DOI - PubMed
    1. Aires JR, Nikaido H. Aminoglycosides Are Captured from both Periplasm and Cytoplasm by the AcrD Multidrug Efflux Transporter of Escherichia coli. J Bacteriol. 2005;187: 1923–1929. 10.1128/JB.187.6.1923-1929.2005 - DOI - PMC - PubMed
    1. Piddock LJV. Multidrug-resistance efflux pumps? not just for resistance. Nat Rev Micro. 2006;4: 629–636. 10.1038/nrmicro1464 - DOI - PubMed

Publication types