

Optimal control to reach eco-evolutionary stability in metastatic castrate-resistant prostate cancer
- PMID: 33290430
- PMCID: PMC7723267
- DOI: 10.1371/journal.pone.0243386
Optimal control to reach eco-evolutionary stability in metastatic castrate-resistant prostate cancer
Abstract
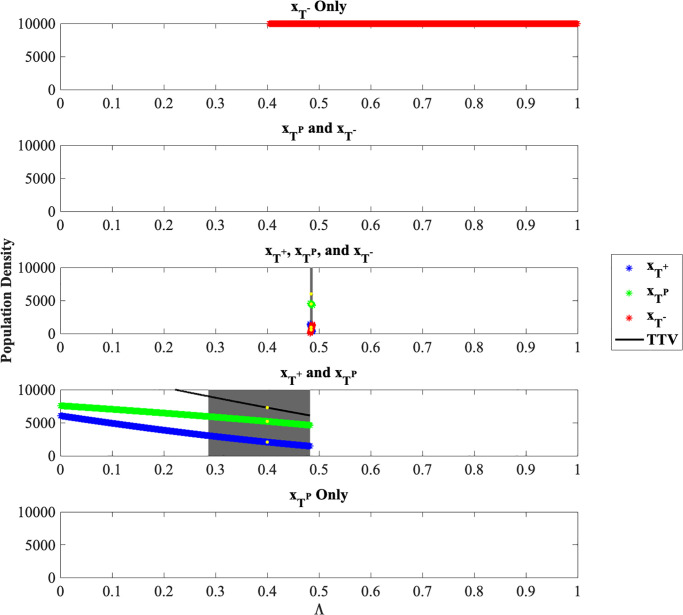
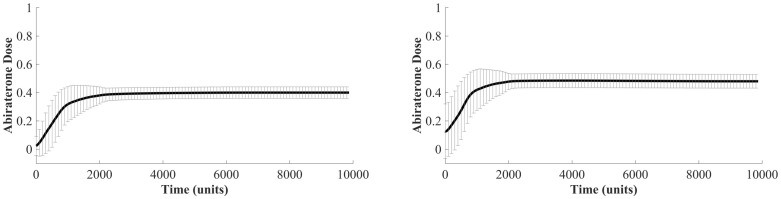
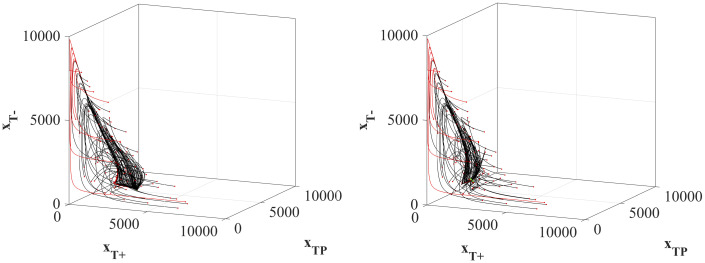
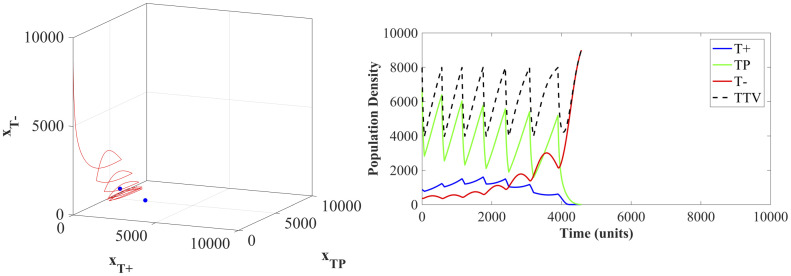
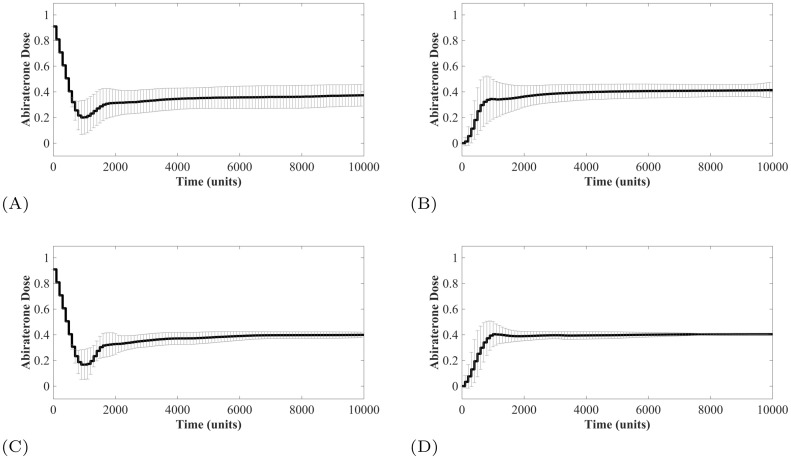
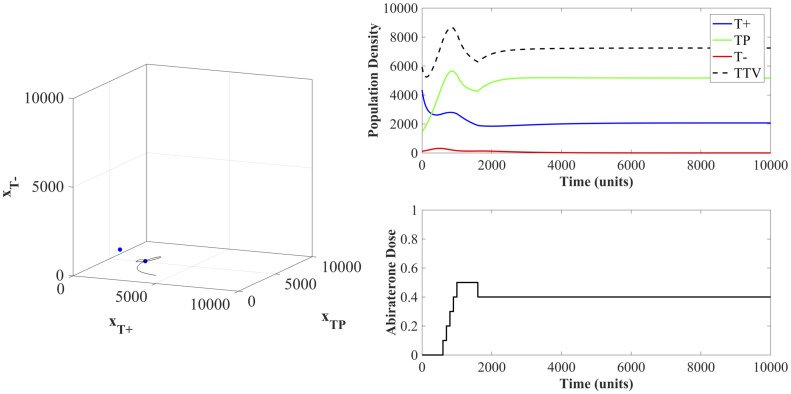
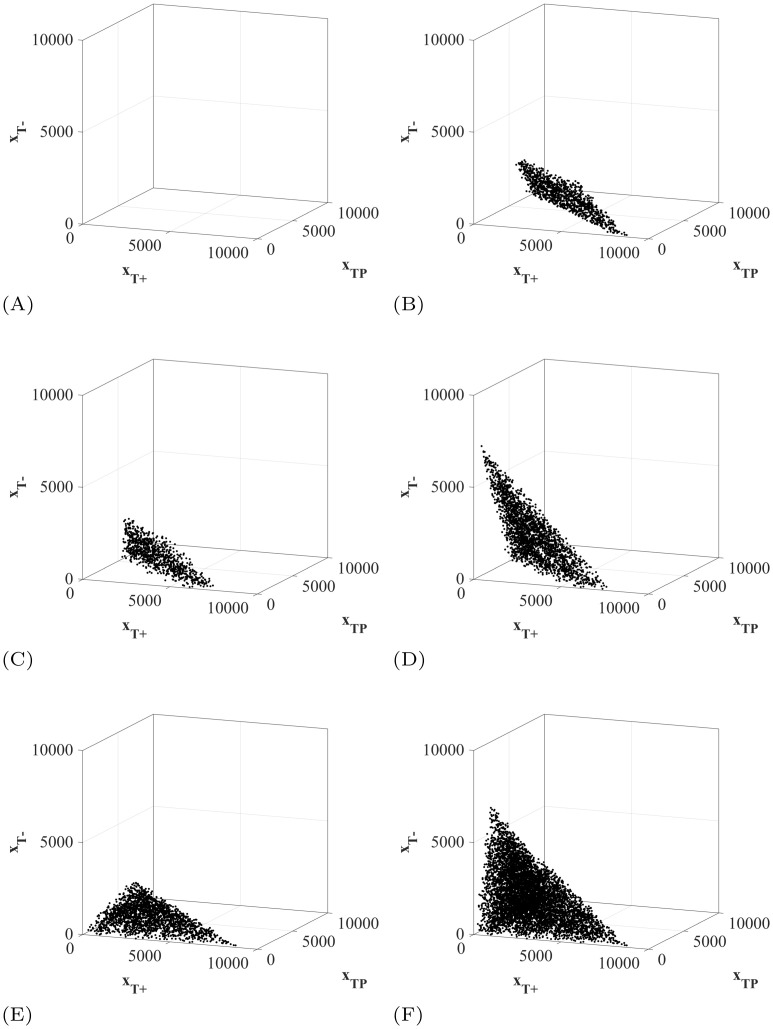
In the absence of curative therapies, treatment of metastatic castrate-resistant prostate cancer (mCRPC) using currently available drugs can be improved by integrating evolutionary principles that govern proliferation of resistant subpopulations into current treatment protocols. Here we develop what is coined as an 'evolutionary stable therapy', within the context of the mathematical model that has been used to inform the first adaptive therapy clinical trial of mCRPC. The objective of this therapy is to maintain a stable polymorphic tumor heterogeneity of sensitive and resistant cells to therapy in order to prolong treatment efficacy and progression free survival. Optimal control analysis shows that an increasing dose titration protocol, a very common clinical dosing process, can achieve tumor stabilization for a wide range of potential initial tumor compositions and volumes. Furthermore, larger tumor volumes may counter intuitively be more likely to be stabilized if sensitive cells dominate the tumor composition at time of initial treatment, suggesting a delay of initial treatment could prove beneficial. While it remains uncertain if metastatic disease in humans has the properties that allow it to be truly stabilized, the benefits of a dose titration protocol warrant additional pre-clinical and clinical investigations.
Conflict of interest statement
The authors have declared that no competing interests exist.
Figures
Similar articles
-
Metastatic Castration-Resistant Prostate Cancer Previously Treated With Docetaxel-Based Chemotherapy: Treatment Patterns From the PROXIMA Prospective Registry.J Glob Oncol. 2018 Sep;4:1-12. doi: 10.1200/JGO.18.00009. J Glob Oncol. 2018. PMID: 30260754 Free PMC article.
-
Cabazitaxel Remains Active in Patients Progressing After Docetaxel Followed by Novel Androgen Receptor Pathway Targeted Therapies.Eur Urol. 2015 Aug;68(2):228-35. doi: 10.1016/j.eururo.2014.04.015. Epub 2014 May 2. Eur Urol. 2015. PMID: 24837187
-
Anticancer Activity and Tolerance of Treatments Received Beyond Progression in Men Treated Upfront with Androgen Deprivation Therapy With or Without Docetaxel for Metastatic Castration-naïve Prostate Cancer in the GETUG-AFU 15 Phase 3 Trial.Eur Urol. 2018 May;73(5):696-703. doi: 10.1016/j.eururo.2017.09.022. Epub 2017 Oct 23. Eur Urol. 2018. PMID: 29074061 Clinical Trial.
-
Treating Patients with Metastatic Castration Resistant Prostate Cancer: A Comprehensive Review of Available Therapies.J Urol. 2015 Dec;194(6):1537-47. doi: 10.1016/j.juro.2015.06.106. Epub 2015 Jul 18. J Urol. 2015. PMID: 26196735 Review.
-
Pharmacotherapeutic strategies for castrate-resistant prostate cancer.Expert Opin Pharmacother. 2020 Aug;21(12):1431-1448. doi: 10.1080/14656566.2020.1767069. Epub 2020 May 29. Expert Opin Pharmacother. 2020. PMID: 32469248 Review.
Cited by
-
Modeling cancer's ecological and evolutionary dynamics.Med Oncol. 2023 Feb 28;40(4):109. doi: 10.1007/s12032-023-01968-0. Med Oncol. 2023. PMID: 36853375 Free PMC article.
-
Evolution-based mathematical models significantly prolong response to abiraterone in metastatic castrate-resistant prostate cancer and identify strategies to further improve outcomes.Elife. 2022 Jun 28;11:e76284. doi: 10.7554/eLife.76284. Elife. 2022. PMID: 35762577 Free PMC article.
-
A war on many fronts: cross disciplinary approaches for novel cancer treatment strategies.Front Genet. 2024 May 30;15:1383676. doi: 10.3389/fgene.2024.1383676. eCollection 2024. Front Genet. 2024. PMID: 38873108 Free PMC article. Review.
-
Effective dose window for containing tumor burden under tolerable level.NPJ Syst Biol Appl. 2023 May 23;9(1):17. doi: 10.1038/s41540-023-00279-4. NPJ Syst Biol Appl. 2023. PMID: 37221258 Free PMC article.
-
Interdisciplinary approaches to metastasis.iScience. 2022 Aug 27;25(9):105015. doi: 10.1016/j.isci.2022.105015. eCollection 2022 Sep 16. iScience. 2022. PMID: 36093054 Free PMC article.
References
Publication types
MeSH terms
Substances
Grants and funding
LinkOut - more resources
Full Text Sources
