

Cell segmentation and tracking using CNN-based distance predictions and a graph-based matching strategy
- PMID: 33290432
- PMCID: PMC7723299
- DOI: 10.1371/journal.pone.0243219
Cell segmentation and tracking using CNN-based distance predictions and a graph-based matching strategy
Abstract
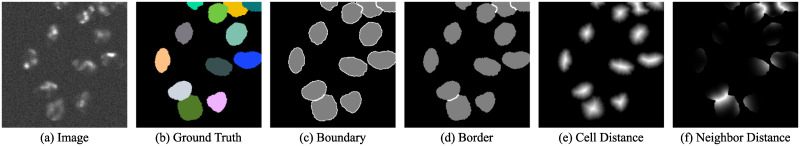
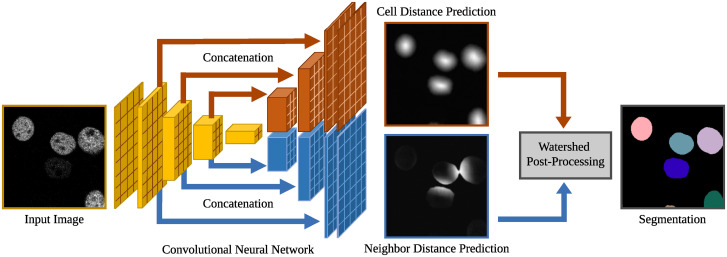
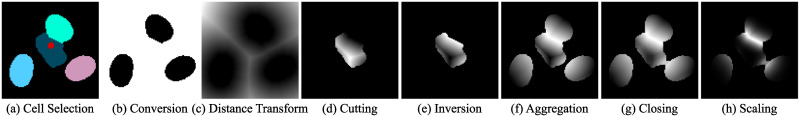
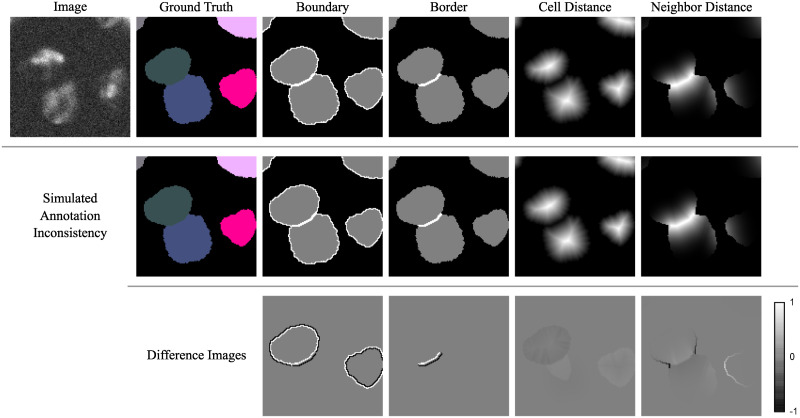
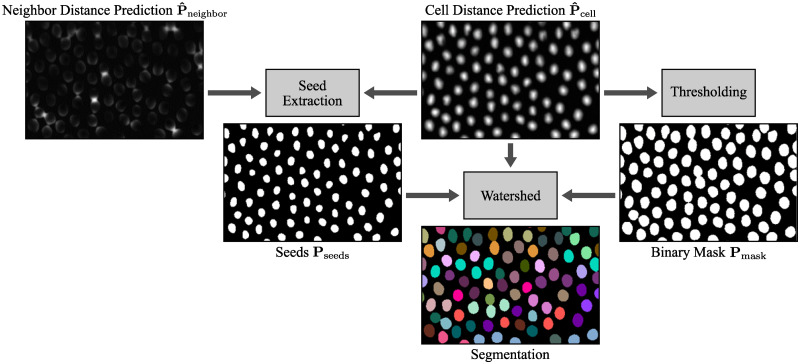
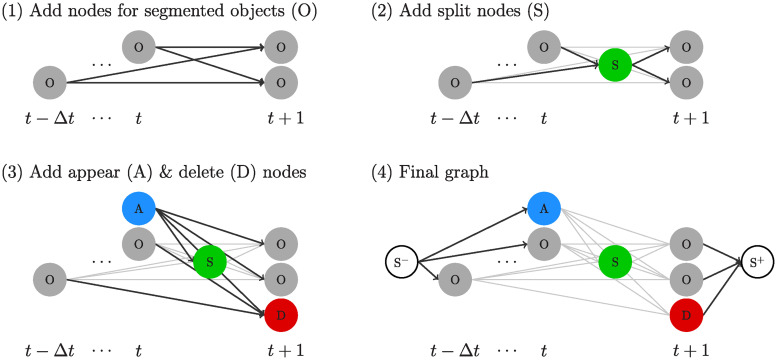
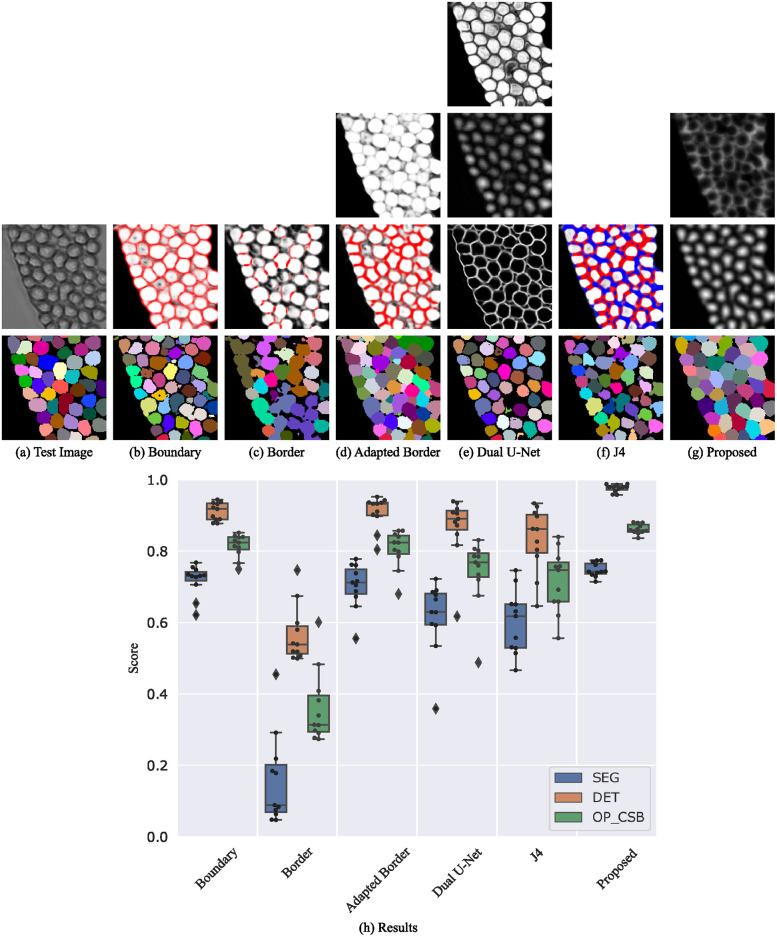
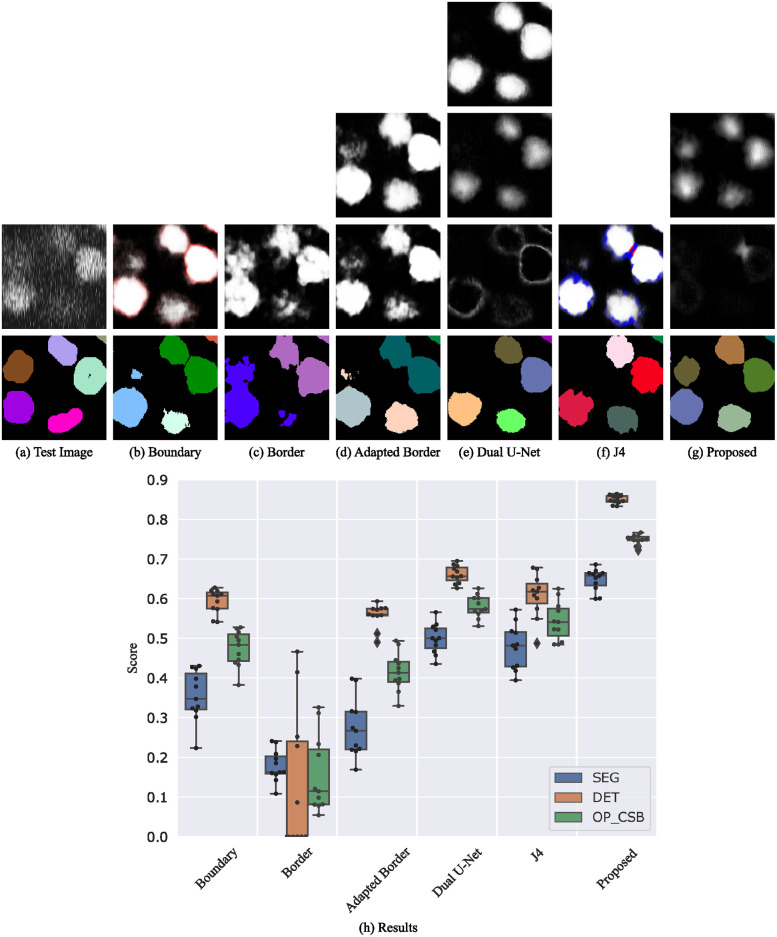
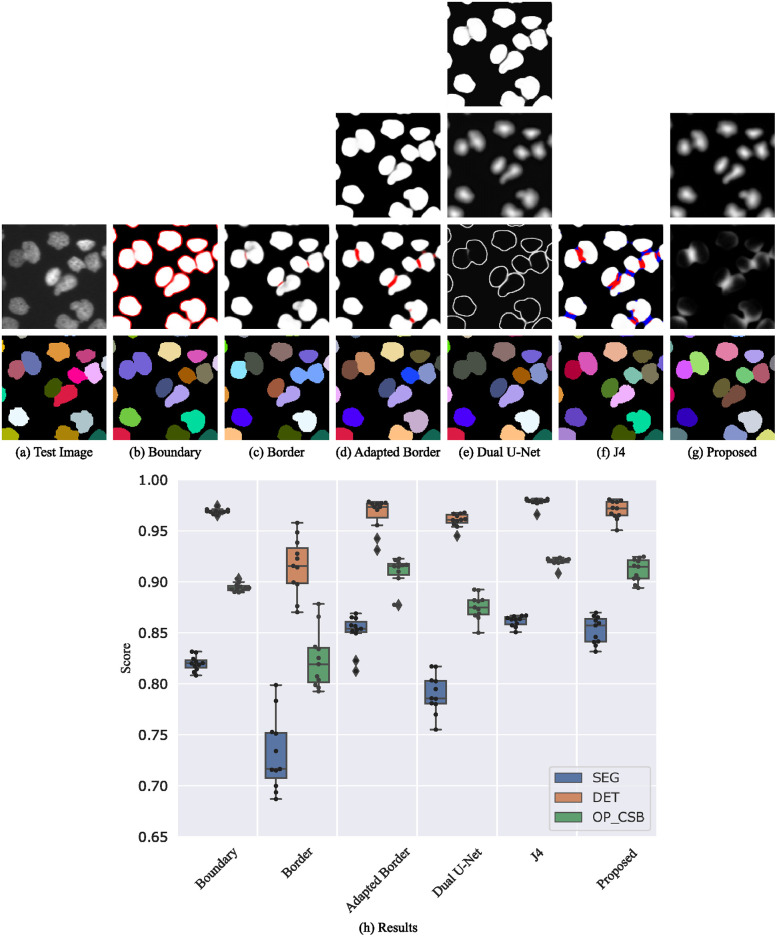
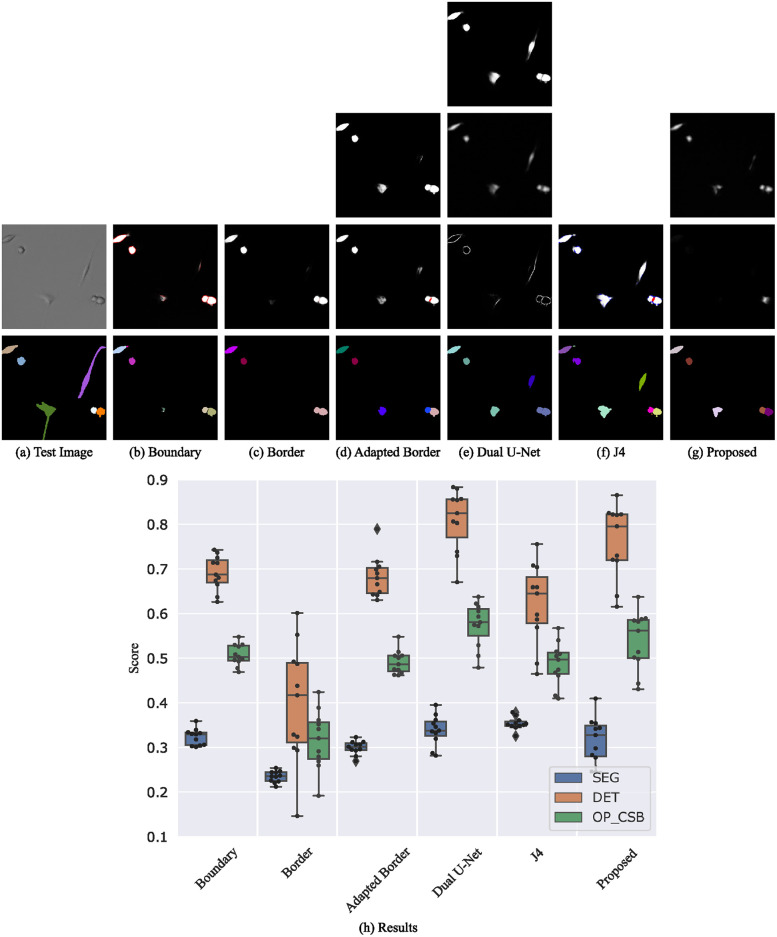
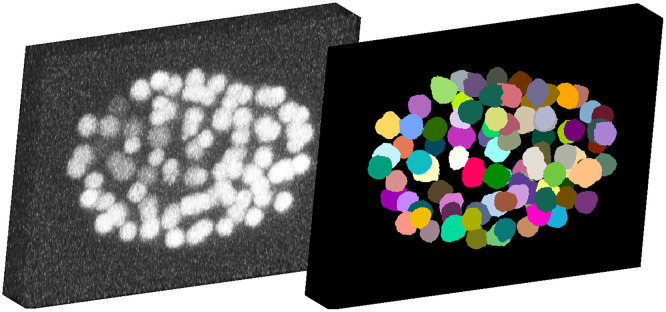
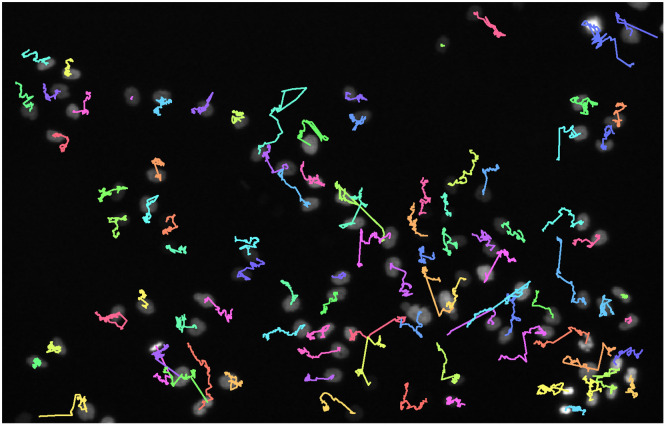
The accurate segmentation and tracking of cells in microscopy image sequences is an important task in biomedical research, e.g., for studying the development of tissues, organs or entire organisms. However, the segmentation of touching cells in images with a low signal-to-noise-ratio is still a challenging problem. In this paper, we present a method for the segmentation of touching cells in microscopy images. By using a novel representation of cell borders, inspired by distance maps, our method is capable to utilize not only touching cells but also close cells in the training process. Furthermore, this representation is notably robust to annotation errors and shows promising results for the segmentation of microscopy images containing in the training data underrepresented or not included cell types. For the prediction of the proposed neighbor distances, an adapted U-Net convolutional neural network (CNN) with two decoder paths is used. In addition, we adapt a graph-based cell tracking algorithm to evaluate our proposed method on the task of cell tracking. The adapted tracking algorithm includes a movement estimation in the cost function to re-link tracks with missing segmentation masks over a short sequence of frames. Our combined tracking by detection method has proven its potential in the IEEE ISBI 2020 Cell Tracking Challenge (http://celltrackingchallenge.net/) where we achieved as team KIT-Sch-GE multiple top three rankings including two top performances using a single segmentation model for the diverse data sets.
Conflict of interest statement
The authors have declared that no competing interests exist.
Figures
Similar articles
-
DMNet: Dual-Stream Marker Guided Deep Network for Dense Cell Segmentation and Lineage Tracking.IEEE Int Conf Comput Vis Workshops. 2021 Oct;2021:3354-3363. doi: 10.1109/iccvw54120.2021.00375. Epub 2021 Nov 24. IEEE Int Conf Comput Vis Workshops. 2021. PMID: 35386855 Free PMC article.
-
DeepSeed Local Graph Matching for Densely Packed Cells Tracking.IEEE/ACM Trans Comput Biol Bioinform. 2021 May-Jun;18(3):1060-1069. doi: 10.1109/TCBB.2019.2936851. Epub 2021 Jun 3. IEEE/ACM Trans Comput Biol Bioinform. 2021. PMID: 31443049
-
Segmenting and tracking cell instances with cosine embeddings and recurrent hourglass networks.Med Image Anal. 2019 Oct;57:106-119. doi: 10.1016/j.media.2019.06.015. Epub 2019 Jun 29. Med Image Anal. 2019. PMID: 31299493
-
Review on Deep Learning Methodologies in Medical Image Restoration and Segmentation.Curr Med Imaging. 2023;19(8):844-854. doi: 10.2174/1573405618666220407112825. Curr Med Imaging. 2023. PMID: 35392788 Review.
-
Cell segmentation methods for label-free contrast microscopy: review and comprehensive comparison.BMC Bioinformatics. 2019 Jun 28;20(1):360. doi: 10.1186/s12859-019-2880-8. BMC Bioinformatics. 2019. PMID: 31253078 Free PMC article. Review.
Cited by
-
NISNet3D: three-dimensional nuclear synthesis and instance segmentation for fluorescence microscopy images.Sci Rep. 2023 Jun 12;13(1):9533. doi: 10.1038/s41598-023-36243-9. Sci Rep. 2023. PMID: 37308499 Free PMC article.
-
HeLa cell segmentation using digital image processing.Heliyon. 2024 Feb 21;10(5):e26520. doi: 10.1016/j.heliyon.2024.e26520. eCollection 2024 Mar 15. Heliyon. 2024. PMID: 38434298 Free PMC article.
-
Synthesis of large scale 3D microscopic images of 3D cell cultures for training and benchmarking.PLoS One. 2023 Mar 31;18(3):e0283828. doi: 10.1371/journal.pone.0283828. eCollection 2023. PLoS One. 2023. PMID: 37000778 Free PMC article.
-
microbeSEG: A deep learning software tool with OMERO data management for efficient and accurate cell segmentation.PLoS One. 2022 Nov 29;17(11):e0277601. doi: 10.1371/journal.pone.0277601. eCollection 2022. PLoS One. 2022. PMID: 36445903 Free PMC article.
-
A novel deep learning-based 3D cell segmentation framework for future image-based disease detection.Sci Rep. 2022 Jan 10;12(1):342. doi: 10.1038/s41598-021-04048-3. Sci Rep. 2022. PMID: 35013443 Free PMC article.
References
Publication types
MeSH terms
LinkOut - more resources
Full Text Sources
Other Literature Sources
Miscellaneous
