. 2021 Feb 3;109(3):545-559.e8.
doi: 10.1016/j.neuron.2020.11.011. Epub 2020 Dec 7.

Regional, Layer, and Cell-Type-Specific Connectivity of the Mouse Default Mode Network

Affiliations

Regional, Layer, and Cell-Type-Specific Connectivity of the Mouse Default Mode Network

Jennifer D Whitesell et al. Neuron. .

Abstract

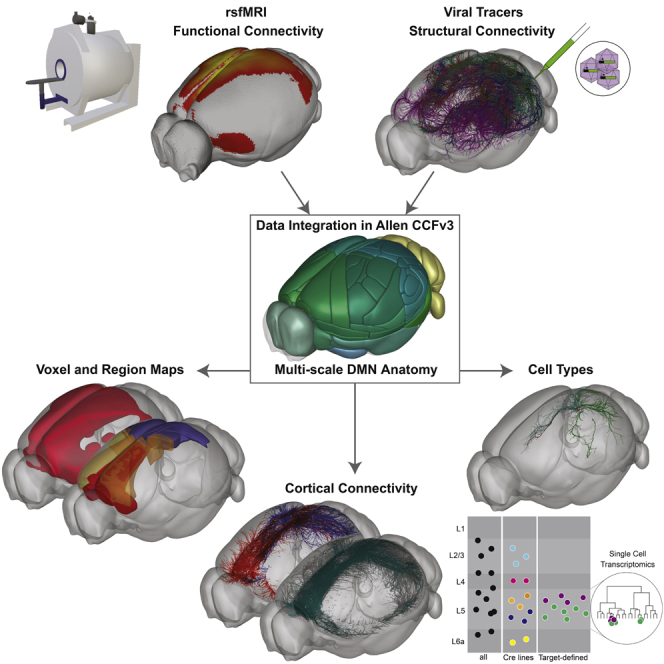
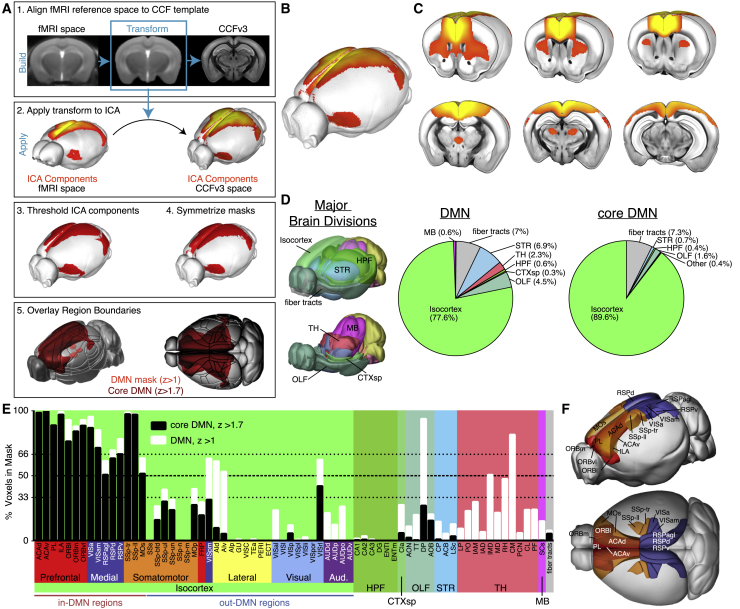
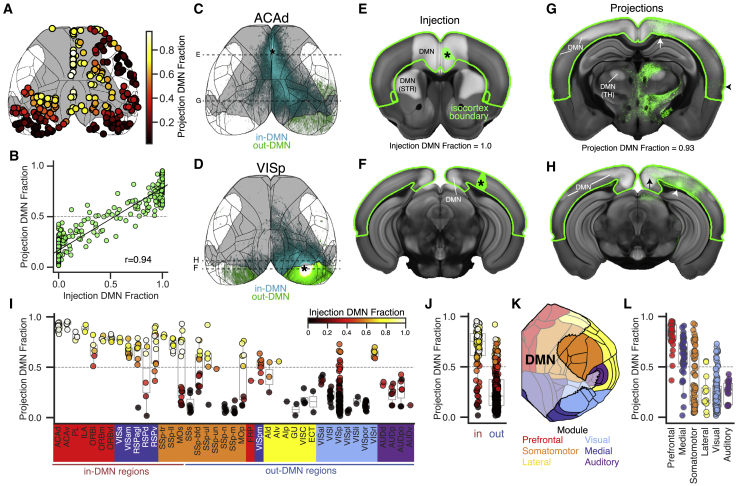
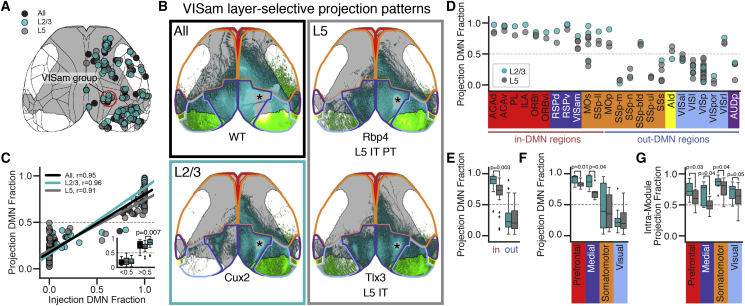
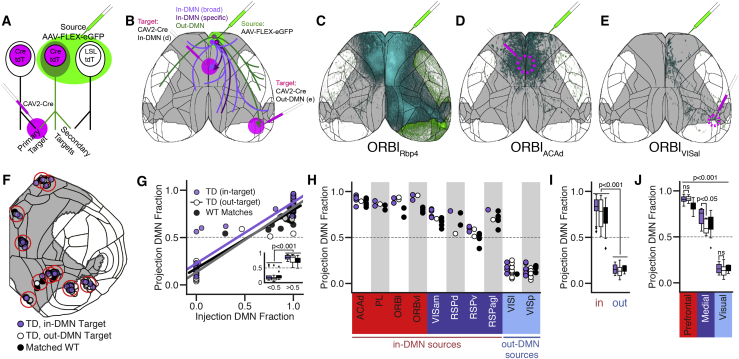
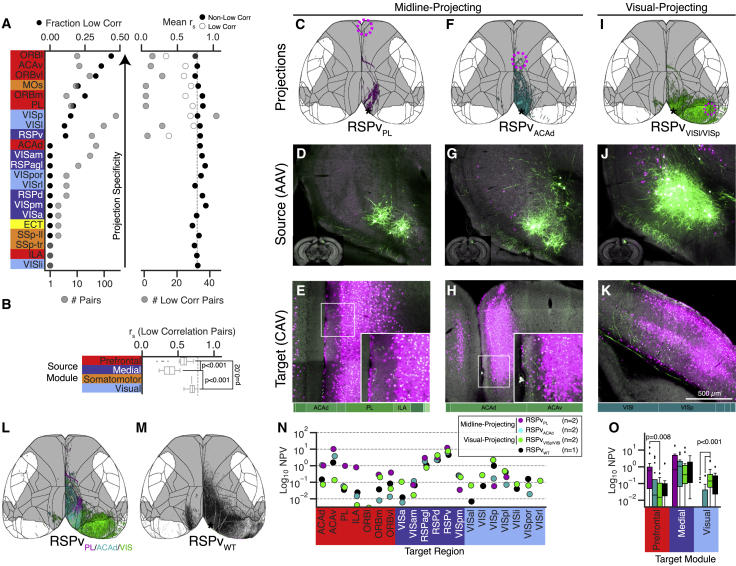
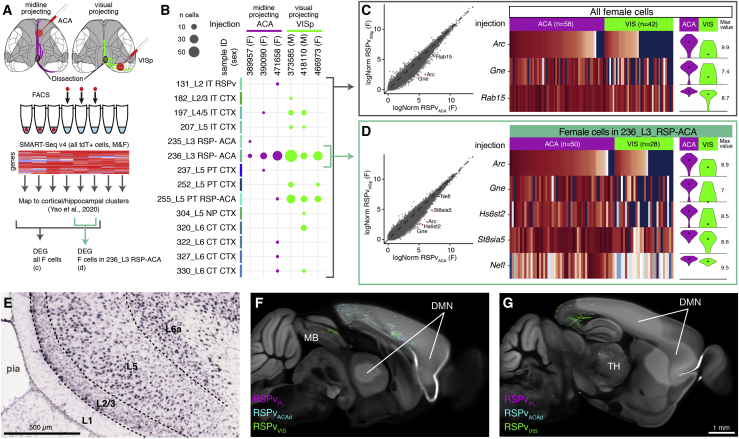
The evolutionarily conserved default mode network (DMN) is a distributed set of brain regions coactivated during resting states that is vulnerable to brain disorders. How disease affects the DMN is unknown, but detailed anatomical descriptions could provide clues. Mice offer an opportunity to investigate structural connectivity of the DMN across spatial scales with cell-type resolution. We co-registered maps from functional magnetic resonance imaging and axonal tracing experiments into the 3D Allen mouse brain reference atlas. We find that the mouse DMN consists of preferentially interconnected cortical regions. As a population, DMN layer 2/3 (L2/3) neurons project almost exclusively to other DMN regions, whereas L5 neurons project in and out of the DMN. In the retrosplenial cortex, a core DMN region, we identify two L5 projection types differentiated by in- or out-DMN targets, laminar position, and gene expression. These results provide a multi-scale description of the anatomical correlates of the mouse DMN.

Keywords: DMN; Default mode network; axonal projections; connectivity; cortical connectome; projection neuron types; retrosplenial cortex; single cell transcriptomics; viral tracer.


Conflict of interest statement

Declaration of Interests The authors declare no competing interests.

Figures

None
Graphical abstract
Figure 1
Figure 1
Identification of DMN Structures (A) Workflow for registering fMRI data to the Allen CCFv3. (1) Align the in-house fMRI template to CCFv3. (2) Apply the obtained transform to the ICA components. (3) Threshold at Z = 1 for all masks and Z = 1.7 for the DMN core mask. (4) Symmetrize along the midline. (5) Overlay CCFv3 region boundaries. (B) 3D image of the ICA DMN component registered to the CCFv3 template. (C) Serial cutaway images showing the DMN on coronal sections. (D) 3D views showing the major brain divisions in CCFv3 and pie charts showing the composition by major brain division for DMN and core DMN masks. (E) Percentage of voxels overlapping the DMN masks within all isocortex structures and selected structures in other major brain divisions. Colored boxes around isocortex structures indicate module affiliation from Harris et al. (2019). (F) 3D views show spatial locations of DMN regions colored by module (in E). Abbreviations in Table S1; see also Figure S1 and Tables S2 and S3.
Figure 2
Figure 2
DMN Regions Preferentially Project to Other DMN Regions (A) Top-down view of the cortical surface showing the spatial distribution of the 300 tracing experiments used to quantify fraction of DMN projections (shown by colormap). Gray, DMN mask; black, region boundaries. (B) Projection DMN fraction as a function of the injection DMN fraction for the experiments in (A). r, Pearson correlation. (C and D) Cortical projection images showing axons arising from an experiment inside (C, ACAd) and outside of (D, VISp) the DMN mask. Asterisks indicate the approximate injection centroid. Cyan, in-DMN projections; green, out-DMN projections. Experiment IDs: ACAd, http://connectivity.brain-map.org/projection/experiment/cortical_map/112458114; VISp, http://connectivity.brain-map.org/projection/experiment/cortical_map/100141219. Dashed lines show the location of coronal sections in (E)–(H). (E–H) Virtual sections of the CCFv3 template overlaid with aligned experiment data at (E and F) the center of each injection site (green pixels with asterisks; E, ACAd; F, VISp) and (G and H) target areas with high axon projection densities (green pixels). Arrows, in-DMN projections; arrowheads, cortical projections outside of the DMN; green edges, isocortex boundary; white overlay, DMN mask; portions overlapping the striatum (STR) and thalamus (TH) are also labeled. (I) Fraction of cortical projections inside the DMN for experiments in (A), grouped by injection source. Individual points are colored by the percentage of their injection inside the DMN mask. (J) Points from (I) grouped by in-DMN or out-DMN regions. (K) Right hemisphere cortical surface flat map showing regions colored by module with DMN mask overlaid (white). (L) Points from (I) grouped by module affiliation. Boxplots show median and interquartile range (IQR). Whiskers extend to 1.5 × IQR. See also Figure S2.
Figure 3
Figure 3
L2/3 Neurons Have More Intra-DMN and Intra-module Projections Than L5 Neurons (A) Top-down cortical surface view showing the locations of matched anterograde viral tracing experiments in WT and Emx1-IRES-Cre mice (black, n = 41), L2/3 IT Cre driver lines (cyan, n = 46), and L5 IT Cre driver lines (gray, n = 76). Red circle indicates the VISam group. Gray, DMN mask; black, region boundaries. (B) Cortical projection images from spatially matched experiments in WT (black box), Cux2-Cre (L2/3 IT, cyan box), and Rbp4-Cre and Tlx3-Cre (L5 IT, gray box) mice. Asterisks indicate the approximate injection centroid. Cyan, in-DMN projections; green, out-DMN projections; gray, DMN mask; colored lines, module boundaries. Experiment IDs: WT, http://connectivity.brain-map.org/projection/experiment/cortical_map/100141599; Cux2, http://connectivity.brain-map.org/projection/experiment/cortical_map/184167484; Rbp4, http://connectivity.brain-map.org/projection/experiment/cortical_map/159753308; Tlx3, http://connectivity.brain-map.org/projection/experiment/cortical_map/297233422. (C) Projection DMN fraction as a function of injection DMN fraction for the 163 experiments in (A). The inset shows the points split into in-DMN and out-DMN bins. (D–F) Fraction of cortical projections inside the DMN for the L2/3 and L5 experiments grouped by injection source (D), in-DMN or out-DMN sources (E), and module (F). (G) Boxplots showing the fraction of intra-module projections for experiments in L2/3 IT- and L5 IT-selective Cre lines. Boxplots show median and IQR. Whiskers extend to 1.5 × IQR. Statistical significance was determined using a multi-way ANOVA followed by Tukey’s post hoc test for group comparison. See also Figure S3.
Figure 4
Figure 4
Target-Defined Projection Mapping Differentiates In-DMN and Out-DMN Projections for Sources in the Medial Module (A and B) Experimental design and terminology. (A) In a target-defined (TD) experiment, a “source” injection with a Cre-dependent viral tracer (AAV-FLEX-EGFP) is paired with a “primary target” injection of a retrograde virus encoding Cre (CAV2-Cre). In the source, Cre mediates expression of EGFP in co-infected cells, allowing visualization of brain-wide projections, including “secondary targets.” Experiments are done in Ai75 mice so that all cells infected retrogradely with CAV2-Cre express nuclear tdTomato (tdT). (B) Schematic illustrating three hypothetical TD projection patterns from an in-DMN source paired with an in-DMN (purple) or out-DMN (green) target. Out-DMN TD cells are shown projecting only to other out-DMN regions. In-DMN TD cells may project to a specific (dark purple) or broad (light purple) set of in-DMN targets. (C) Cortical projection images from Rbp4-Cre+ L5 neurons in ORBl (syringe location). (D and E) Projections labeled by TD experiments in ORBl paired with an in-DMN target (ACAd, D), or an out-DMN target (VISal, E). Gray, DMN mask; black, region boundaries; cyan, in-DMN projections; green, out-DMN projections. Experiment IDs: ORBlRbp4, http://connectivity.brain-map.org/projection/experiment/cortical_map/156741826; ORBlACAd, http://connectivity.brain-map.org/projection/experiment/cortical_map/571816813; ORBlVISal, http://connectivity.brain-map.org/projection/experiment/cortical_map/601804603. (F) Cortical surface flat map showing the locations of 10 groups of experiments (red circles) with matched injection sites and at least one of each: TD in-target, TD out-target, WT. Gray, DMN mask; black, region boundaries. (G) Projection DMN fraction as a function of injection DMN fraction for the three experiment types. The inset shows the fraction of DMN projections for injections split into in-DMN and out-DMN bins. (H–J) Boxplots showing the fraction of projections inside the DMN for the experiments in (F), grouped by source region (H), in-DMN and out-DMN sources (I), and module (J). Boxplots show median and IQR. Whiskers extend to 1.5 × IQR. Statistical significance was determined using a multi-way ANOVA followed by Tukey’s post hoc test for group comparison. See also Figure S4 and Table S4.
Figure 5
Figure 5
Quantitative Comparisons of TD and WT Injection-Matched Pairs (A) Sources ranked by the fraction of low corr pairs (left; top axis, black circles; bottom axis, number of pairs). Right: mean rs (top axis) for low corr (white circles) and non-low corr (black circles) WT-TD pairs. The numbers of total pairs (left) and low corr pairs (right) are plotted on bottom axes in gray. (B) Distribution of rs values for low corr pairs grouped by module. Boxplots show median and IQR. Whiskers extend to 1.5 × IQR. Statistical significance was determined using a one-way ANOVA followed by multiple t tests. (C–K) Cortical projection images (C, F, and I) and coronal section serial two-photon tomography (STPT) images through the source (D, G, and J) and target (E, H, and K) injection sites for three experiments in the RSPv. Bars on the bottom of (E), (H), and (K) show the fraction of the CAV2-Cre injection site in each brain region. In-DMN PL and ACAd targets (C–H)) reveal midline-projecting patterns, whereas out-DMN VISl and VISp targets (I–K) reveal a visually projecting pattern. (L) Overlay of the cortical projection images from (C), (F), and (I). (M) Cortical projection image from a matched RSPv WT injection. Experiment IDs: RSPvPL, http://connectivity.brain-map.org/projection/experiment/cortical_map/592522663; RSPvACAd, http://connectivity.brain-map.org/projection/experiment/cortical_map/521255975; RSPvVISl/VISp, http://connectivity.brain-map.org/projection/experiment/cortical_map/569904687; RSPvWT, http://connectivity.brain-map.org/projection/experiment/cortical_map/112595376. Gray, DMN mask; Black, region boundaries. (N) Projection strengths (log-transformed normalized projection volume [NPV]) to selected targets, plotted for each TD projection type. (O) Projection strengths to all targets in the prefrontal, medial, and visual modules. Statistical significance was determined using a multi-way ANOVA followed by Tukey’s post hoc test for group comparison. Axes in (N) and (O) are truncated at 10−2.5. See also Figures S5 and S6 and Table S5.
Figure 6
Figure 6
Midline-Projecting RSPv Cells Are Located in Superficial L5 (A) Overlay of STPT images from the RSPv TD source injection sites in Figures 5C–5K. Dashed lines show manually drawn layers. (B) A coronal CCFv3 atlas plate shows layer annotations in the caudal portion of the RSPv. (C) Source layers with infected cells, determined by registration to CCFv3. (D–G) STPT images of tdT expression from a set of layer-selective Cre lines (indicated in each panel) crossed to the Ai14 reporter. tdT+ somas are in L6 of the Ntsr1-Cre × Ai14 line, but projections are dense in L5 (G). (H) Plots showing fluorescence levels by depth from the pia to the white matter for the layer-selective Cre × Ai14 lines (tdT, left) and the TD source injection sites (EGFP, right). (I) Single coronal STPT images of cells in the RSPv labeled following from retrograde trans-synaptic rabies tracing experiments in PL (magenta, left), ACAd (cyan, left), or VISp (green, center). White boxes indicate regions shown in the merged overlay on right (rotated with L1 at the bottom). See also Table S6.
Figure 7
Figure 7
Midline-Projecting and Visually Projecting RSPv Cell Types Have Different Gene Expression Patterns (A) Retro-seq experiment and analysis design. ACA and VISp-projecting cells in RSPv were labeled by injections of retrograde Cre virus in Ai14 or Ai75 mice. Single tdT+ cells were sorted from the caudal RSPv for RNA sequencing and mapped to clusters in a cortical hippocampal cell type taxonomy. Supervised analyses identified differentially expressed genes (DEGs). (B) Cluster assignments for 239 cells. Cluster labels are from Yao et al. (2020). (C) Left: log-normalized gene expression for all female midline-projecting cells (x axis) versus all female visually projecting cells (y axis). Red points indicate DEGs. Center: heatmaps showing the scaled expression (log counts per million [CPM]) of DEGs (rows) for each single cell (columns). Right: violin plots summarizing the population distribution of expression levels for each DEG by target (ACA or VIS). (D) Same as (C) but limited to female cells in cluster 236_L3 RSP-ACA. (E) Coronal section image showing ISH for Arc in the RSPv from the Allen Mouse Brain Atlas. (F and G) Virtual sagittal sections of the CCFv3 template at the midline (F) and slightly lateral (G) with overlaid projection data from the three experiments in Figures 5C–5K and 6A. MB, midbrain.

References

    1. Alves P.N., Foulon C., Karolis V., Bzdok D., Margulies D.S., Volle E., Thiebaut de Schotten M. An improved neuroanatomical model of the default-mode network reconciles previous neuroimaging and neuropathological findings. Commun. Biol. 2019;2:370. - PMC - PubMed
    1. Andrews-Hanna J.R., Reidler J.S., Sepulcre J., Poulin R., Buckner R.L. Functional-anatomic fractionation of the brain’s default network. Neuron. 2010;65:550–562. - PMC - PubMed
    1. Ash J.A., Lu H., Taxier L.R., Long J.M., Yang Y., Stein E.A., Rapp P.R. Functional connectivity with the retrosplenial cortex predicts cognitive aging in rats. Proc. Natl. Acad. Sci. USA. 2016;113:12286–12291. - PMC - PubMed
    1. Avants B.B., Tustison N.J., Song G., Cook P.A., Klein A., Gee J.C. A reproducible evaluation of ANTs similarity metric performance in brain image registration. Neuroimage. 2011;54:2033–2044. - PMC - PubMed
    1. Becerra L., Pendse G., Chang P.-C., Bishop J., Borsook D. Robust reproducible resting state networks in the awake rodent brain. PLoS ONE. 2011;6:e25701. - PMC - PubMed

Publication types