. 2020 Dec 17;80(6):1123-1134.e4.
doi: 10.1016/j.molcel.2020.11.030. Epub 2020 Nov 20.

MINERVA: A Facile Strategy for SARS-CoV-2 Whole-Genome Deep Sequencing of Clinical Samples

Affiliations

MINERVA: A Facile Strategy for SARS-CoV-2 Whole-Genome Deep Sequencing of Clinical Samples

Chen Chen et al. Mol Cell. .

Abstract

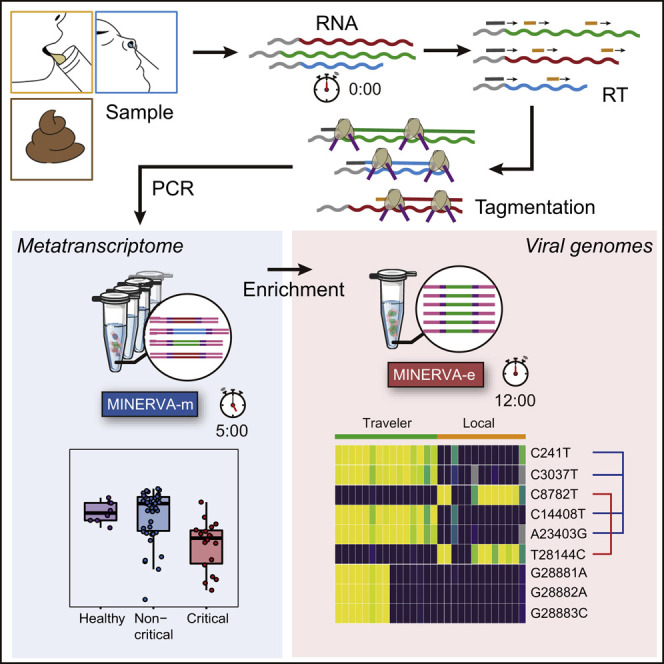
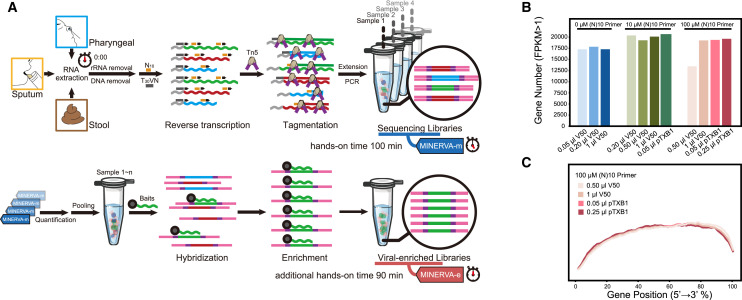
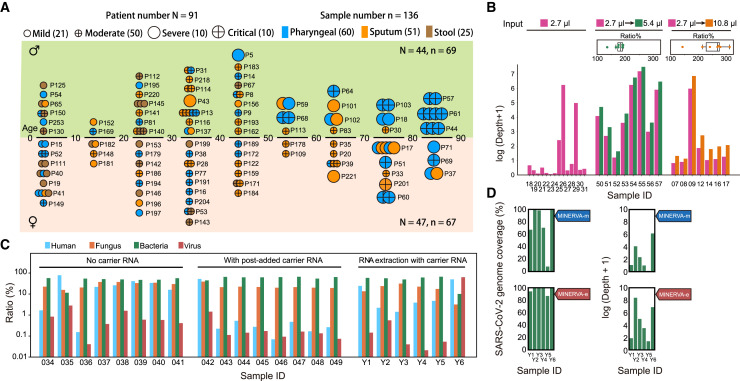
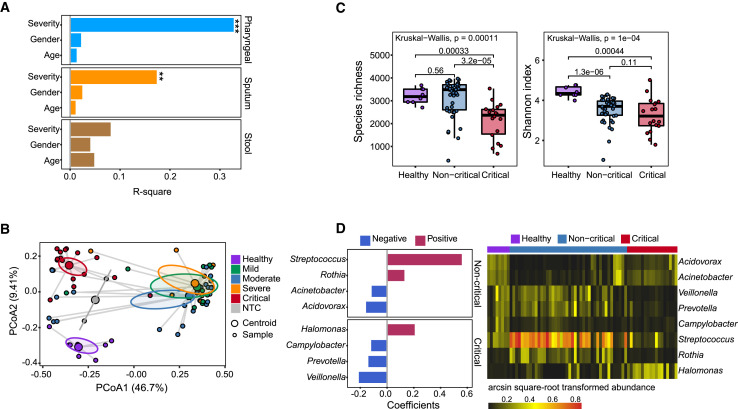
Analyzing the genome of severe acute respiratory syndrome coronavirus 2 (SARS-CoV-2) from clinical samples is crucial for understanding viral spread and evolution as well as for vaccine development. Existing RNA sequencing methods are demanding on user technique and time and, thus, not ideal for time-sensitive clinical samples; these methods are also not optimized for high performance on viral genomes. We developed a facile, practical, and robust approach for metagenomic and deep viral sequencing from clinical samples. We demonstrate the utility of our approach on pharyngeal, sputum, and stool samples collected from coronavirus disease 2019 (COVID-19) patients, successfully obtaining whole metatranscriptomes and complete high-depth, high-coverage SARS-CoV-2 genomes with high yield and robustness. With a shortened hands-on time from sample to virus-enriched sequencing-ready library, this rapid, versatile, and clinic-friendly approach will facilitate molecular epidemiology studies during current and future outbreaks.

Keywords: COVID-19, SARS-CoV-2, whole-genome sequencing, metagenomics.


Conflict of interest statement

Declaration of Interests The authors declare no competing interests.

Figures

None
Graphical abstract
Figure 1
Figure 1
Scheme and Development of MINERVA (A) RNA extracted from pharyngeal swabs and sputum and stool samples undergo rRNA and DNA removal before metagenomic sequencing library construction (MINERVA-m). Multiple libraries were then pooled for SARS-CoV-2 sequence enrichment. (B) Effect of the N10 primer during reverse transcription and Tn5 amount on detected gene number. (C) Effect of the N10 primer during reverse transcription and Tn5 amount on gene body coverage evenness.
Figure 2
Figure 2
Optimization of MINERVA for Clinical Samples (A) COVID-19 sample profiles, showing the age group, sex, severity, and re-sampling status of each individual. (B) Effect of sample input and reaction volume on sequencing depth of the SARS-CoV-2 genome. (C) Mapping ratios of human, fungus, bacterium, and virus reads showed good performance of carrier RNA removal. “No carrier RNA” refers to samples with no carrier RNA during extraction; “with post-added carrier RNA” refers to samples with post-added carrier RNA after RNA extraction. “RNA extraction with carrier RNA” refers to samples with carrier RNA during extraction. All samples with carrier RNA went through a carrier RNA removal step. (D) SARS-CoV-2 genome coverage and depth of MINERVA-m and -e for “RNA extraction with carrier RNA” samples.
Figure 3
Figure 3
Metagenomics Analysis of COVID-19 Samples Using MINERVA (A) PERMANOVA analysis highlights factors associated with microbial compositions in different sample types, including pharyngeal (n = 68), sputum (n = 59), and stool (n = 33). (PERMANOVA test, *p < 0.05, **p < 0.01, ***p < 0.001). Permutation was constrained within the same time point to account for repeated measures. (B) PCoA analysis of pharyngeal samples based on Bray-Curtis distance, calculated at the bacterial genus, fungal genus, and viral family levels. Samples are colored according to different disease groups, including healthy controls (n = 8), mild (n = 10), moderate (n = 23), severe (n = 9), critical (n = 18), and non-template controls (NTCs; n = 2). (C) Comparison of alpha diversity, including species richness (left panel) and Shannon index (right panel), among different groups of pharyngeal samples. Groups were segmented as healthy controls (n = 8), non-critical (including mild, moderate, and severe; n = 42) and critical (n = 18). Kruskall-Wallis test and Wilcoxon rank-sum test were used for multi-group and two-group comparisons, respectively. (D) Analysis of association of microbial taxa with disease severity using pharyngeal samples. The generalized estimating equation (GEE) model was applied. Results were filtered based on significance (BH-adjusted p < 0.05) and effect size (absolute coefficient > 0.1). Taxa found to be significantly associated with disease are shown in the left panel, and their abundance in different groups of samples is shown in the right panel.
Figure 4
Figure 4
Co-existence of Additional Pathogens in Samples from Individuals with COVID-19 (A) Abundance of other potential pathogens. Sparse occurrence of high abundance of several pathogens with the potential to cause secondary infections was identified by metagenomics analysis (presented as relative abundance, left panels) and validated by direct mapping to their genomes (presented as coverage normalized by sequencing depth, right panels). Identified pathogens include Candida albicans, Staphylococcus aureus, Corynebacterium jeikeium, Corynebacterium striatum, and Klebsiella aerogenes. (B) Occurrence rate of high-risk pathogens in different severity groups (samples with one or several high-risk pathogens identified were all considered). Only samples with a high abundance of these pathogens identified by metagenomics analysis and direct mapping were considered here and are also labeled in (A). The occurrence rate was associated with disease severity.
Figure 5
Figure 5
Direct Comparison of Sequencing Libraries Constructed from MINERVA and Conventional dsDL Strategies (A) SARS-CoV-2 mapping ratio statistics of the MINERVA-m and dsDL libraries. (B) Comparison of SARS-CoV-2 mapping ratios between the MINERVA-m and dsDL libraries. (C) Comparison of SARS-CoV-2 mapping ratios between the MINERVA-m and MINERVA libraries. (D and E) SARS-CoV-2 genome coverage and depth statistics of the MINERVA-e and dsDL libraries. (F and G) Comparison of SARS-CoV-2 sequencing results between the MINERVA-e and dsDL libraries. (H) Metagenomic sequencing and qPCR result features of samples with poor SARS-CoV-2 genome coverage.
Figure 6
Figure 6
MINERVA Could Facilitate COVID-19 and SARS-CoV-2 Research through Accurate and Sensitive Identification of Viral Mutations (A) SARS-CoV-2 mutation profile obtained from 136 samples. (B) SARS-CoV-2 mutation profiles of asymptomatic individuals with COVID-19 and their infected family members. Individual origin is labeled in red (local) or blue (international traveler). (C) Longitudinal SARS-CoV-2 mutation analysis of individuals with COVID-19.
Figure 7
Figure 7
Evaluation of Microbial Profiles by Merged MINERVA Datasets (A and B) Correlation of alpha diversity, including species richness (A) and Shannon index (B), between MINERVA-m and merged (m+e) datasets. (C) Comparison of bacterial composition of pharyngeal samples between dsDL and merged MINERVA (m+e) datasets. Genera with a relative abundance over 1% are shown here.

References

    1. An J., Liao X., Xiao T., Qian S., Yuan J., Ye H., Qi F., Shen C., Liu Y., Wang L. Clinical characteristics of the recovered COVID-19 patients with re-detectable positive RNA test. Ann. Transl. Med. 2020;8 - PMC - PubMed
    1. Bai Y., Yao L., Wei T., Tian F., Jin D.Y., Chen L., Wang M. Presumed Asymptomatic Carrier Transmission of COVID-19. JAMA. 2020;323:1406–1407. - PMC - PubMed
    1. Bushnell B. Accurate, Splice-Aware Aligner; 2014. BBMap: A Fast.
    1. Carey V.J. Ported to R by Thomas Lumley (versions 3.13, 4.4, version 4.13). R package version. 2006;4:13. B. R. gee: Generalized Estimation Equation solver. https://CRAN.R-project.org/package=gee. 11.
    1. Carl G., Kühn I. Analyzing spatial autocorrelation in species distributions using Gaussian and logit models. Ecol. Modell. 2007;207:159–170.