. 2021 Feb:96:69-86.
doi: 10.1016/j.matbio.2020.12.001. Epub 2020 Dec 5.

Hyaluronan synthesis inhibition impairs antigen presentation and delays transplantation rejection

Affiliations

Hyaluronan synthesis inhibition impairs antigen presentation and delays transplantation rejection

Payton L Marshall et al. Matrix Biol. 2021 Feb.

Abstract

A coat of pericellular hyaluronan surrounds mature dendritic cells (DC) and contributes to cell-cell interactions. We asked whether 4-methylumbelliferone (4MU), an oral inhibitor of HA synthesis, could inhibit antigen presentation. We find that 4MU treatment reduces pericellular hyaluronan, destabilizes interactions between DC and T-cells, and prevents T-cell proliferation in vitro and in vivo. These effects were observed only when 4MU was added prior to initial antigen presentation but not later, consistent with 4MU-mediated inhibition of de novo antigenic responses. Building on these findings, we find that 4MU delays rejection of allogeneic pancreatic islet transplant and allogeneic cardiac transplants in mice and suppresses allogeneic T-cell activation in human mixed lymphocyte reactions. We conclude that 4MU, an approved drug, may have benefit as an adjunctive agent to delay transplantation rejection.

Keywords: 4-methylumbelliferone; Antigen presentation; Dendritic cells; Glycocalyx; Hyaluronan; Transplantation.


Conflict of interest statement

Declaration of Competing Interest The authors have no competing financial interests. N.N., P.L.M., and P.L.B. are listed as inventors of the patent (PCT/US2019/019310) filed by the Board of Trustees of the Leland Stanford Junior University.

Figures

Fig. 1
Fig. 1. HA is produced by antigen presenting cells in vivo.
A-F. Staining of HA in spleen (A,C) and pancreatic lymph node (LN)(B,D) sections isolated from (A,B) uninflamed DO11.10 control mice and (C,D) age/gender-matched actively inflamed mice (pre-diabetic DORmO mice). Red boxes highlight interfollicular regions, sites of antigen presentation to CD4+ T-cells. HA positive area in stimulated and unstimulated mice are shown for spleen (E) and pancreatic lymph node (PLN) (F). Data include information from >10 sections per mouse and n=3 mice per condition. G. tSNE plots representing different immune subsets present in murine lymphatic tissue including Dendritic Cells (DC)(magenta), Macrophages (Mac)(orange), Monocytes (Mono)(dark blue), B-cells (B)(light blue), Granulocytes (Gran)(brown), CD4+ T-cells (CD4 T)(purple), CD8+ T-cells (CD8 T)(pink) and NK cells (NK)(green) alongside a heat map showing the relative binding of HABP. Areas circled in red mark cell types associated with substantial cell surface HA. Histogram plots for HABP binding intensity are based on cell definitions provided in Supplementary Figure 2A and match those colors in the tSNE plot. Data are representative of n=3 separate experiments. H. Counts per minute (CPM) of radiolabeled glucosamine incorporation into HA by purified human CD4+T cells, monocytes, and mDC. CPM shown is for the amount of radiolabel lost upon treatment of cell lysates with hyaluronidase to reflect quantify only cell-bound HA. I. mRNA expression by human mDC of the three HA synthases, HAS1-3, all normalized to 18S. Data include pooled isolated from 4 different donors and measured in duplicate. Data represent mean ± SEM; *, p < 0.05 vs. respective control by unpaired t-test.
Fig. 2.
Fig. 2.. HA production alters DC phenotypes.
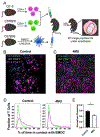
C57Bl/6J Bone marrow derived dendritic cells (BMDC) were cultured in the presence of LPS (A) with or (B) without 4MU and the appearance of these was assessed using scanning electron microscopy (SEM). Data are representative of 2 independent experiments and >50 cells. C. Cell surface HA staining for the same cell types and conditions. D-G. Expression of cell surface markers by LPS activated murine DC in the absence or presence of 4MU, shown for (D) CD11c, and expression of (E) I/A-I/E, (F) CD80, and (G) CD40 on CD11c+ cells. H. DQ-OVA fluorescence following 30 minutes of processing after pretreatment with or without 4MU. Data for (D-G) include pooled cells, isolated from 4 mice and measured in triplicate. Data represent mean ± SEM; *, p < 0.05 vs. respective control by one-way ANOVA with Bonferroni multiple comparisons.
Fig. 3
Fig. 3. HA contributes to immune synapse formation and antigen presentation.
CD4+ T-cells cultured with autologous DC pre-loaded with αCD3 and αCD28 antibodies. A-B. Appearance of cell cultures treated with (B) or without (A) 4MU. C-D. Representative images of a cultured cells treated (D) with or (C) without 4MU and stained for DAPI (blue), HA (green) and MHC-II (red). E, F. Images of DC (red) and T-cells (green) (F) with or (E) without 4MU. G-H. Quantification of the number of T-cells bound to each DC (G) and the percentage of DC engaged in binding interactions with CD4+ T-cells (H). Data are representative of two separate experiments measured in triplicate. I. Proliferation of T-cells co-cultured with APC and αCD3/αCD28 antibodies. Cells were stimulated for 72 hours with tritiated thymidine (TT) added for the final 24 hours. CPM data are for triplicate wells. J. T-cells were activated as in (I) in the setting of 4MU added at either the inception of the assay (0 hours) or 1 day later (24 hours). For the final 24 hours tritiated thymidine was added. K. %CD69+ cells of total OT-II CD4+ T-cells following activation in the setting of OVA-loaded autologous DC for five hours, showing pooled replicates for increasing concentrations of OVA. L,M. Viability of CD4+ T-cells (L) and DC (M) as assessed by annexin V and PI staining. Data for panels I-L include pooled isolated from 4 mice and are each representative of >2 experiments. Data represent mean ± SEM; *, p <0.05 vs. respective control by unpaired t-test or one-way ANOVA with multiple comparisons where appropriate.
Fig. 4.
Fig. 4.. HA contributes to immune synapse formation in vivo.
A-D. C57Bl/6 animals were pretreated with 4MU or control chow for 14 days prior to an adoptive transfer of labeled CD4+ T-cells and OVA loaded, labeled BMDC. 16 hours after transfer, 2-photon microscopy was used to video the interactions of DC and T-cells within the draining popliteal LN. A. Schematic for experiment. Still images of mice on control (B) or 4MU chow (C) are shown. From video footage (shown in supplemental video 1A and 1B) the percentage of time pink OT-II T-cells spend in contact with BMDC was calculated (D), and is shown in comparison to C57Bl/6 control T-cells in green. (E) Clustering of OT-II T-cells (Pink) to BMDC was determined by normalization to C57Bl/6 T-cells (Green). Data shown are for >500 lymphocytes and >100 DC, and representative of three separate experiments.
Fig. 5.
Fig. 5.. HA contributes to in vivo antigen specific responses and development of memory.
A-C. 4MU effects on antigen presentation were assessed in an in vivo immunization model. A. Schematic for this experiment. 2×10⁶ ef450 labeled OTII CD4+ T-cells (CD45.1) were transferred into a C57Bl/6 recipient which was then immunized with OVA. After three days, proliferation was assessed via flow cytometry. B. Example of ef450 proliferation of recovered CD45.1 cells. C. Division indices averaged for n=3–4 mice per group. D-F. 4MU effects on recall responses of T-cells isolated from a TCR transgenic mouse (DO11.10) immunized against OVA in the setting of 4MU treatment. Mice were immunized in vivo twice to OVA and given time to resolve their inflammation. CD4+ T cells were isolated following sacrifice and the proliferation response to OVA loaded BALB/c BMDC was assessed ex vivo after 72 hours via tritiated thymidine uptake. (D) Schematic of the experimental protocol used. E. Proliferation of isolated CD4+ T-cells in response to OVA-peptide pulsed DC, normalized by each animals proliferative response to nonspecific αCD3/αCD28 activation. F. Raw counts for response to αCD3/αCD28. Data collected from n=4–5 animals and measured in triplicate. Representative of three separate experiments. P<.05 as measured by unpaired t-test or one-way ANOVA with multiple comparisons where applicable.
Fig. 6.
Fig. 6.. 4MU inhibits APC-mediated T-cell proliferation and promotes Treg in a model of inflammation.
MLR were prepared using monocyte-derived dendritic cells (mDCs) and T-cells isolated from healthy human donors. Cells were cultured for 5 days prior to addition of tritiated thymidine for 24 hours, then measured. (A) A titration of 4MU as well as DMSO control was used. One representative allogeneic cross is shown. (B) Pooled data for 300 μM 4MU condition across 6 different human donor crosses and normalized to control for each cross. Samples were measured in triplicate and p<.05 using unpaired t-test or one-way ANOVA with multiple comparisons where appropriate. (C-D) Allogeneic Human Treg induction where cultures were treated with either DMSO or 4MU (C). Data pooled for three different human crosses (D) and analyzed as n=4 technical replicates showing. p<0.05 as measured by unpaired t-test.
Fig. 7.
Fig. 7.. 4MU treatment delays rejection of an antigen specific and allogeneic transplantation.
(A-C) DO11.10 CD4+ T-cells were adoptively transferred into RIPmOVA recipients, and blood glucose was tracked for 20 weeks to monitor destruction of islets by antigen specific response. (A) A schematic showing the protocol used for the experiments in panels (A-C). (B) Blood glucose levels showing time to diabetes as measured by a blood glucose of 250 mg/dL comparing animals pretreated with 4MU or control chow two weeks prior to adoptive transfer. (C) Kaplan-Meier curve comparing time to diabetes in control and 4MU pretreated animals. (D-F) Adoptive transfer of BALB/C islets into diabetic C57Bl/6 animals, pretreated with 4MU or control chow. (D) Schematic of protocol. In brief, C57Bl/6 transplant recipient animals were treated with STZ to induce diabetes. Four days later, a transplant of BALB/c islets under the kidney capsule of the diabetic animals was done. (E) Daily blood glucose monitoring was used to show the rejection of the MHC mismatched islets. with (F) time to diabetes in the 4MU vs control treated recipients. (G-I) Cardiac allotransplants from BALB/c to C57Bl/6 recipients. (G) A schematic of the protocol used. In brief, mice were treated with control or 4MU chow for 14 days prior to HTX, with engraftment onto abdominal aorta. (H) Mice were then monitored for rejection via palpation of the graft, and detection of contractile activity. (I) Kaplan-Meier curve comparing 4MU or control treated animals. Data are each collected from n= 4–5 animals/group. Blood glucose curves and palpation scores were analyzed by two way ANOVA with multiple comparison tests. Kaplan-Meier curves were compared with Mantel-Cox or Gehan-Breslow-Wilcoxon tests where appropriate.

References

    1. Evanko SP, Tammi MI, Tammi RH, Wight TN, Hyaluronan-dependent pericellular matrix., Adv. Drug Deliv. Rev 59 (2007) 1351–65. 10.1016/j.addr.2007.08.008. - DOI - PMC - PubMed
    1. Haslam SM, Julien S., Burchell JM, Monk CR, Ceroni A., Garden OA, Dell A., Characterizing the glycome of the mammalian immune system., Immunol. Cell Biol 86 (2008) 564–73. 10.1038/icb.2008.54. - DOI - PubMed
    1. Ito S., Structure and function of the glycocalyx., Fed. Proc 28 (n.d.) 12–25. http://www.ncbi.nlm.nih.gov/pubmed/4884661. - PubMed
    1. Ito S., Form and function of the glycocalyx on free cell surfaces., Philos. Trans. R. Soc. Lond. B. Biol. Sci 268 (1974) 55–66. 10.1098/rstb.1974.0015. - DOI - PubMed
    1. Garantziotis S., Savani RC, Hyaluronan biology: A complex balancing act of structure, function, location and context, Matrix Biol. 78–79 (2019) 1–10. 10.1016/j.matbio.2019.02.002. - DOI - PMC - PubMed

Publication types

MeSH terms

LinkOut - more resources