. 2020 Dec 6;21(23):9305.
doi: 10.3390/ijms21239305.

Dihydrotanshinone, a Natural Diterpenoid, Preserves Blood-Retinal Barrier Integrity via P2X7 Receptor

Affiliations

Dihydrotanshinone, a Natural Diterpenoid, Preserves Blood-Retinal Barrier Integrity via P2X7 Receptor

Claudia Giuseppina Fresta et al. Int J Mol Sci. .

Abstract

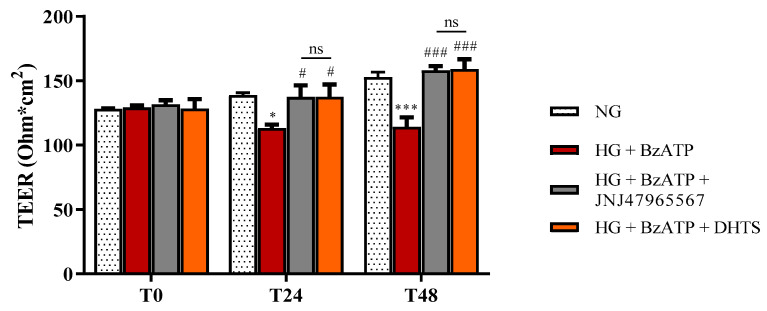
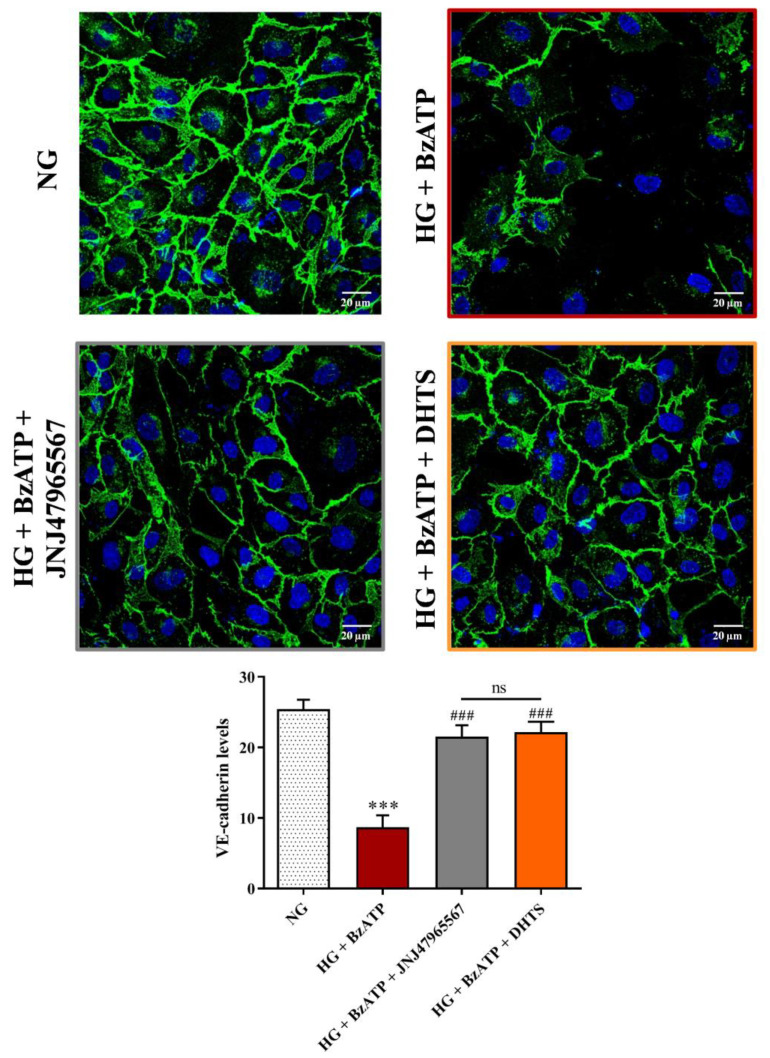
Activation of P2X7 signaling, due to high glucose levels, leads to blood retinal barrier (BRB) breakdown, which is a hallmark of diabetic retinopathy (DR). Furthermore, several studies report that high glucose (HG) conditions and the related activation of the P2X7 receptor (P2X7R) lead to the over-expression of pro-inflammatory markers. In order to identify novel P2X7R antagonists, we carried out virtual screening on a focused compound dataset, including indole derivatives and natural compounds such as caffeic acid phenethyl ester derivatives, flavonoids, and diterpenoids. Molecular Mechanics/Generalized Born Surface Area (MM/GBSA) rescoring and structural fingerprint clustering of docking poses from virtual screening highlighted that the diterpenoid dihydrotanshinone (DHTS) clustered with the well-known P2X7R antagonist JNJ47965567. A human-based in vitro BRB model made of retinal pericytes, astrocytes, and endothelial cells was used to assess the potential protective effect of DHTS against HG and 2'(3')-O-(4-Benzoylbenzoyl)adenosine-5'-triphosphate (BzATP), a P2X7R agonist, insult. We found that HG/BzATP exposure generated BRB breakdown by enhancing barrier permeability (trans-endothelial electrical resistance (TEER)) and reducing the levels of ZO-1 and VE-cadherin junction proteins as well as of the Cx-43 mRNA expression levels. Furthermore, HG levels and P2X7R agonist treatment led to increased expression of pro-inflammatory mediators (TLR-4, IL-1β, IL-6, TNF-α, and IL-8) and other molecular markers (P2X7R, VEGF-A, and ICAM-1), along with enhanced production of reactive oxygen species. Treatment with DHTS preserved the BRB integrity from HG/BzATP damage. The protective effects of DHTS were also compared to the validated P2X7R antagonist, JNJ47965567. In conclusion, we provided new findings pointing out the therapeutic potential of DHTS, which is an inhibitor of P2X7R, in terms of preventing and/or counteracting the BRB dysfunctions elicited by HG conditions.

Keywords: blood-retinal barrier; diabetic retinopathy; endothelial cells; inflammation; oxidative stress; purinergic P2X7 receptor.


Conflict of interest statement

The authors declare no conflict of interest.

Figures

Figure 1
Figure 1
DHTS is predicted to bind the allosteric site of the human P2X7R. (A) Ramachandran plot of the full-length hP2X7R model, after energy minimization in an implicit solvent and membrane. (B) Representation of DHTS poses in the orthosteric (magenta Van der Waals spheres) and the allosteric (blue Van der Waals spheres) pockets of P2X7R. (C) The ligand interaction of a 2D diagram of DHTS in the orthosteric pocket of P2X7R. (D) The ligand interaction 2D diagram of DHTS in the allosteric pocket of P2X7R.
Figure 2
Figure 2
Assessment of barrier integrity in the in vitro human primary culture based on triple co-culture iBRB model by TEER under our experimental conditions. TEER values were measured at time 0 (T0), and after 24 (T24) and 48 (T48) h. NG = normal glucose condition (5 mM). HG = high glucose condition (40 mM). BzATP = 200 µM. JNJ47965567 = 100 nM. DHTS = 500 nM. Values are reported as means ± standard deviation (SD) of three independent experiments. Statistical analysis was performed using two-way analysis of variance (ANOVA) with Tukey’s post-hoc analysis. * p < 0.05 vs. NG. *** p < 0.001 vs. NG. # p < 0.05 vs. HG + BzATP. ### p < 0.001 vs. HG + BzATP. ns = not significant.
Figure 3
Figure 3
Measurement of apical-to-basolateral Na-F permeability in our iBRB model (in vitro human primary culture based on triple co-culture). Na-F permeability was measured after 5, 15, and 30 min. NG = normal glucose condition (5 mM). HG = high glucose condition (40 mM). RFUs = relative fluorescence units. BzATP = 200 µM. JNJ47965567 = 100 nM. DHTS = 500 nM. Values are reported as means ± SD of three independent experiments. Statistical analysis was performed using two-way ANOVA with Tukey’s post-hoc analysis. ** p < 0.01 vs. NG. ## p < 0.01 vs. HG + BzATP. ns = not significant.
Figure 4
Figure 4
Immunocytochemistry evaluation of ZO-1 staining in endothelial cells subjected to normal or high glucose conditions + BzATP, in the absence or in the presence of JNJ47965567 or DHTS, for 48 h. ZO-1 was labeled with FITC (green) while nuclei were labeled with DAPI (blue). Images for ZO-1 immunostaining were acquired at 40× magnification. Scale bar: 10 µm. NG = normal glucose condition (5 mM). HG = high glucose condition (40 mM). BzATP = 200 µM. JNJ47965567 = 100 nM. DHTS = 500 nM. The average intensity (AU) of the data from more than 30 cells per coverslip for ZO-1 under our experimental conditions are shown. Values are reported as means ± SD of three independent experiments. Statistical analysis was performed using one-way ANOVA with Tukey’s post-hoc analysis. *** p < 0.001 vs. NG. ### p < 0.001 vs. HG + BzATP. ns = not significant.
Figure 5
Figure 5
Confocal analysis of VE-cadherin in endothelial cells subjected to normal or high glucose conditions + BzATP, in the absence or in the presence of JNJ47965567 or DHTS, for 48 h. VE-cadherin was labeled with FITC (green) while nuclei were labeled with DAPI (blue). Images for VE-cadherin immunostaining were acquired at 20× magnification. Scale bar: 20 µm. NG = normal glucose condition (5 mM). HG = high glucose condition (40 mM). BzATP = 200 µM. JNJ47965567 = 100 nM. DHTS = 500 nM. The average intensity (AU) of the data from more than 30 cells per coverslip for VE-cadherin under our experimental conditions are shown. Values are reported as means ± SD of three independent experiments. Statistical analysis was performed using one-way ANOVA with Tukey’s post-hoc analysis. *** p < 0.001 vs. NG. ### p < 0.001 vs. HG + BzATP. ns = not significant.
Figure 6
Figure 6
Intracellular ROS production in endothelial cells under our experimental conditions. NG = normal glucose condition (5 mM). HG = high glucose condition (40 mM). BzATP = 200 µM. JNJ47965567 = 100 nM. DHTS = 500 nM. Values are reported as means ± SD of three independent experiments. Statistical analysis was performed using one-way ANOVA with Tukey’s post-hoc analysis. *** p < 0.001 vs. NG. ## p < 0.01 vs. HG + BzATP. ### p < 0.001 vs. HG + BzATP. ns = not significant.
Figure 7
Figure 7
Measurement of (A) IL-1β, (B) IL-6, (C) TNF-α, (D) IL-8, and (E) TLR-4 mRNA levels (quantitative real-time PCR (qRT-PCR)) in endothelial cells under our experimental conditions. NG = normal glucose condition (5 mM). HG = high glucose condition (40 mM). BzATP = 200 µM. JNJ47965567 = 100 nM. DHTS = 500 nM. The abundance of each mRNA of interest was expressed relatively to the abundance of 18S rRNA, as an internal control. Values are reported as means ± SD of three independent experiments. Statistical analysis was performed using one-way ANOVA with Tukey’s post-hoc analysis. ** p < 0.01 vs. NG. * p < 0.05 vs. NG. ## p < 0.01 vs. HG + BzATP. # p < 0.05 vs. HG + BzATP. ns = not significant.
Figure 8
Figure 8
Measurement of (A) P2X7R, (B) Cx-43, (C) VEGF-A, and (D) ICAM-1 mRNA expression levels (qRT-PCR) in endothelial cells under our experimental conditions. NG = normal glucose condition (5 mM). HG = high glucose condition (40 mM). BzATP = 200 µM. JNJ47965567 = 100 nM. DHTS = 500 nM. The abundance of each mRNA of interest was expressed relatively to the abundance of 18S rRNA, as an internal control. Values are means ± SD of three independent experiments. * p < 0.05 vs. NG. *** p < 0.001 vs. NG. ## p < 0.01 vs. HG + BzATP. # p < 0.05 vs. HG + BzATP. ns = not significant.

Similar articles

Cited by

References

    1. Klein B.E. Overview of epidemiologic studies of diabetic retinopathy. Ophthalmic Epidemiol. 2007;14:179–183. doi: 10.1080/09286580701396720. - DOI - PubMed
    1. Ting D.S., Cheung G.C., Wong T.Y. Diabetic retinopathy: Global prevalence, major risk factors, screening practices and public health challenges: a review. Clin. Exp. Ophthalmol. 2016;44:260–277. doi: 10.1111/ceo.12696. - DOI - PubMed
    1. Yang Q.H., Zhang Y., Zhang X.M., Li X.R. Prevalence of diabetic retinopathy, proliferative diabetic retinopathy and non-proliferative diabetic retinopathy in asian t2dm patients: A systematic review and meta-analysis. Int. J. Ophthalmol. 2019;12:302–311. - PMC - PubMed
    1. Mizutani M., Kern T.S., Lorenzi M. Accelerated death of retinal microvascular cells in human and experimental diabetic retinopathy. J. Clin. Investig. 1996;97:2883–2890. doi: 10.1172/JCI118746. - DOI - PMC - PubMed
    1. De Vriese A.S., Verbeuren T.J., Van de Voorde J., Lameire N.H., Vanhoutte P.M. Endothelial dysfunction in diabetes. Br. J. Pharmacol. 2000;130:963–974. doi: 10.1038/sj.bjp.0703393. - DOI - PMC - PubMed

MeSH terms

LinkOut - more resources