. 2020 Dec 6;12(12):1402.
doi: 10.3390/v12121402.

Increased HIV Subtype Diversity Reflecting Demographic Changes in the HIV Epidemic in New South Wales, Australia

Affiliations

Increased HIV Subtype Diversity Reflecting Demographic Changes in the HIV Epidemic in New South Wales, Australia

Francesca Di Giallonardo et al. Viruses. .

Abstract

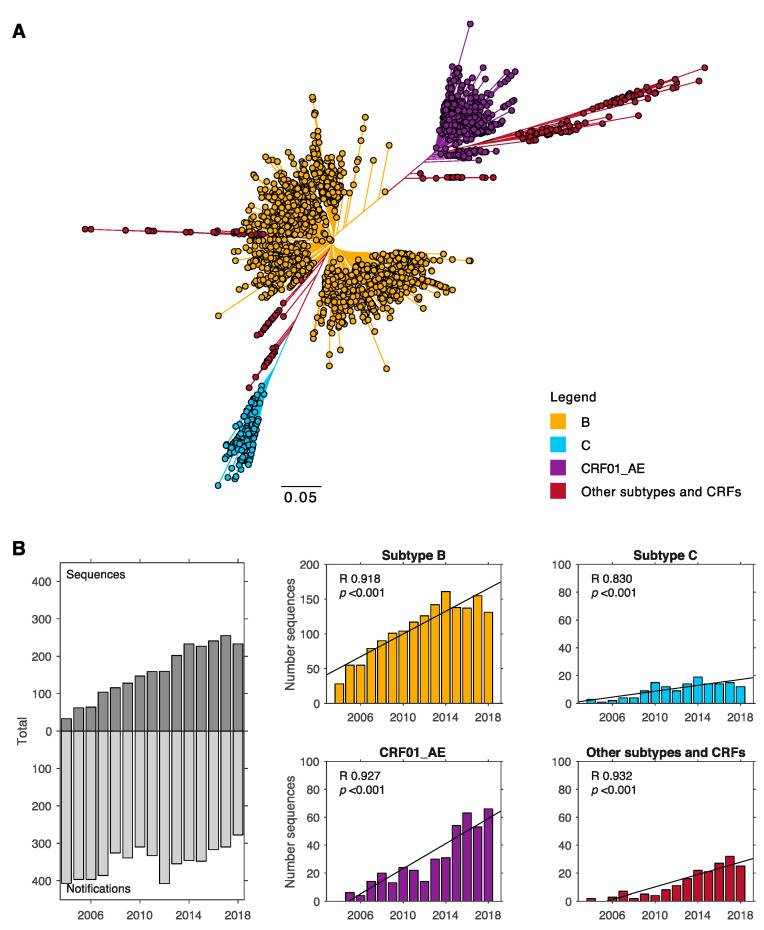
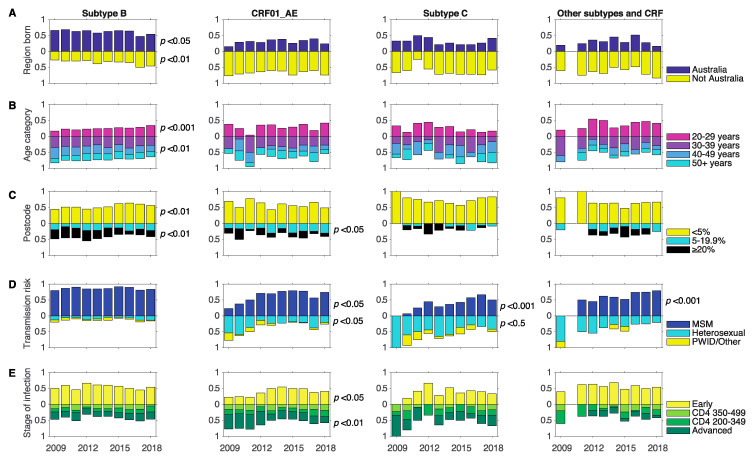
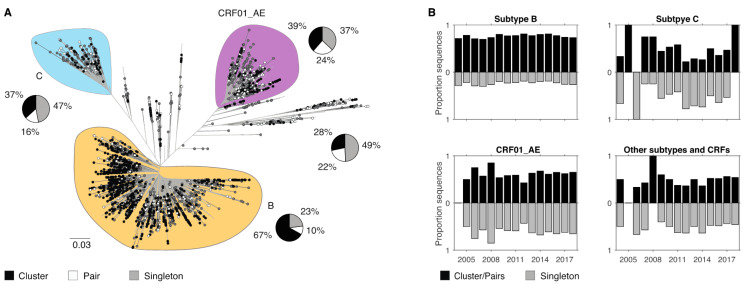
Changes over time in HIV-1 subtype diversity within a population reflect changes in factors influencing the development of local epidemics. Here we report on the genetic diversity of 2364 reverse transcriptase sequences from people living with HIV-1 in New South Wales (NSW) notified between 2004 and 2018. These data represent >70% of all new HIV-1 notifications in the state over this period. Phylogenetic analysis was performed to identify subtype-specific transmission clusters. Subtype B and non-B infections differed across all demographics analysed (p < 0.001). We found a strong positive association for infections among females, individuals not born in Australia or reporting heterosexual transmission being of non-B origin. Further, we found an overall increase in non-B infections among men who have sex with men from 50 to 79% in the last 10 years. However, we also found differences between non-B subtypes; heterosexual transmission was positively associated with subtype C only. In addition, the majority of subtype B infections were associated with clusters, while the majority of non-B infections were singletons. However, we found seven non-B clusters (≥5 sequences) indicative of local ongoing transmission. In conclusion, we present how the HIV-1 epidemic has changed over time in NSW, becoming more heterogeneous with distinct subtype-specific demographic associations.

Keywords: HIV; heterosexual transmission; non-B subtypes; stage of infection; transmission clusters.


Conflict of interest statement

FJL has received educational grants and sponsorship from ViiV Healthcare, Gilead Sciences and MSD, speaker fees from AstraZeneca, MSD and the Australasian Society for HIV, Viral Hepatitis and Sexual Health Medicine (ASHM), and provided consultancy and served on advisory boards for Viiv Healthcare, MSD and Calimmune Australia. All other authors report no conflict of interest.

Figures

Figure 1
Figure 1
HIV-1 subtype diversity in New South Wales (NSW) for the past 14 years. (A) Maximum likelihood tree for HIV-1 sequences in NSW. Reverse transcriptase sequences sampled between 2004 and 2018 were used to estimate a tree phylogeny. Branch length indicates nucleotide substitutions per site. (B) Left panel: Number of sequences used in this analysis compared to the number of new HIV-1 infections notified in NSW. Other panels: number of sequences for different subtypes across time and linear regression with correlation coefficient (R) and p values indicated. Yellow = subtype B, cyan = subtype C, purple = CRF01_AE, and red = other subtypes and CRFs (including CRF02_AG, CRF07_BC, CRF60_BC, CRF44_BF, CRF06_cps, CRF12_BF, CRF33_01B, CRF35_AD, CRF77_cpx, and CRF55_01B, A, F, D, G).
Figure 2
Figure 2
Time-specific changes in demographics. Proportion of sequences from infections among individuals with different demographics are shown for the time span of 2009–2018 for subtype B, C, CRF01_AE, and other subtype and CRFs. p values showing significant changes over time are shown next to the panel. (A) region born: Australia (blue), not-Australia (yellow); changes over time were significant for subtype B. (B) Age category: 20–29 years old (pink), 30–39 years old (purple), 40–49 years old (blue), 50+ years (cyan); changes were significant for subtype B 20–29 years old and 40–49 years old). (C) Postcode category according to proportion of gay male population: <5% (yellow), 5–19.9% (cyan), ≥20% (black); changes were significant for CRF01_AE 5–19.9%. (D) Transmission risk factor: MSM (blue), heterosexual (cyan), PWID/Other (yellow); changes were significant for subtype C MSM and heterosexual, CRF01_AE MSM, and other subtypes and CRFs MSM. (E) Stage of infection: early (green), CD4 350–499 (light green), CD4 200–349 (darker green), and advanced (dark green); changes were significant for CRF01_AE advanced. p values for linear regression are indicated for the following linear regression correlation coefficients: Subtype B region born Australia (R = −0.670, p < 0.05) and not Australia (R = 0.832, p < 0.01), age category 20–29 years old (R = 0.927, p < 0.001) and 40–49 years old (R = −0.854, p < 0.01), postcode < 5% (R = 0.781, p < 0.01) and postcode ≥20% (R = −0.816, p < 0.01); CRF01_AE postcode 5–19.9% (R = 0.703, p < 0.05), transmission risk factor MSM (R = 0.724, p < 0.05) and PWID/Other (R = −0.659, p < 0.05), stage of infection early (R = 0.649, p < 0.05) and advanced (R = −0.860, p < 0.01); subtype C transmission risk factor MSM (R = 0.896, p < 0.001) and heterosexual (R = −0.752, p < 0.05); and other subtypes and CRFs transmission risk factor MSM (R = 0.885, p < 0.001).
Figure 3
Figure 3
HIV-1 clusters in NSW for different subtypes. (A) Unrooted maximum likelihood tree from NSW and global reverse transcriptase sequences. Branch length indicates nucleotide substitutions per site. Circle at tips indicate sequences from NSW, while sequences without circles are global sequences. Clades representing subtype B, C, and CRF01_AE are colored. Tip circles are colored according to being part of a cluster (black), sequence pair (white), or a singleton (gray). The proportion of sequences associated with each cluster type or singleton is shown as a pie chart for the four subtype groups analysed. (B) Proportion of sequences from infections associated with cluster and pairs or being singletons are shown for the four subtype categories across time.

References

    1. Bbosa N., Kaleebu P., Ssemwanga D. HIV subtype diversity worldwide. Curr. Opin. HIV AIDS. 2019;14:153–160. doi: 10.1097/COH.0000000000000534. - DOI - PubMed
    1. Angelis K., Albert J., Mamais I., Magiorkinis G., Hatzakis A., Hamouda O., Struck D., Vercauteren J., Wensing A.M., Alexiev I., et al. Global dispersal pattern of HIV type 1 subtype CRF01_AE: A genetic trace of human mobility related to heterosexual sexual activities centralized in Southeast Asia. J. Infect. Dis. 2015;211:1735–1744. doi: 10.1093/infdis/jiu666. - DOI - PubMed
    1. Chen Y., Hora B., DeMarco T., Berba R., Register H., Hood S., Carter M., Stone M., Pappas A., Sanchez A.M., et al. Increased predominance of HIV-1 CRF01_AE and its recombinants in the Philippines. J. Gen. Virol. 2019;100:511–522. doi: 10.1099/jgv.0.001198. - DOI - PMC - PubMed
    1. Kirby Institute . HIV, Viral Hepatitis and Sexually Transmissible Infections in Australia: Annual surveillance Report 2018. Kirby Institute, UNSW Sydney; Sydney, Australia: 2018.
    1. Dauwe K., Mortier V., Schauvliege M., Van Den Heuvel A., Fransen K., Servais J.Y., Bercoff D.P., Seguin-Devaux C., Verhofstede C. Characteristics and spread to the native population of HIV-1 non-B subtypes in two European countries with high migration rate. BMC Infect. Dis. 2015;15:524. doi: 10.1186/s12879-015-1217-0. - DOI - PMC - PubMed

Publication types

MeSH terms