

Molecular Imaging of Brain Tumor-Associated Epilepsy
- PMID: 33291423
- PMCID: PMC7762008
- DOI: 10.3390/diagnostics10121049
Molecular Imaging of Brain Tumor-Associated Epilepsy
Abstract
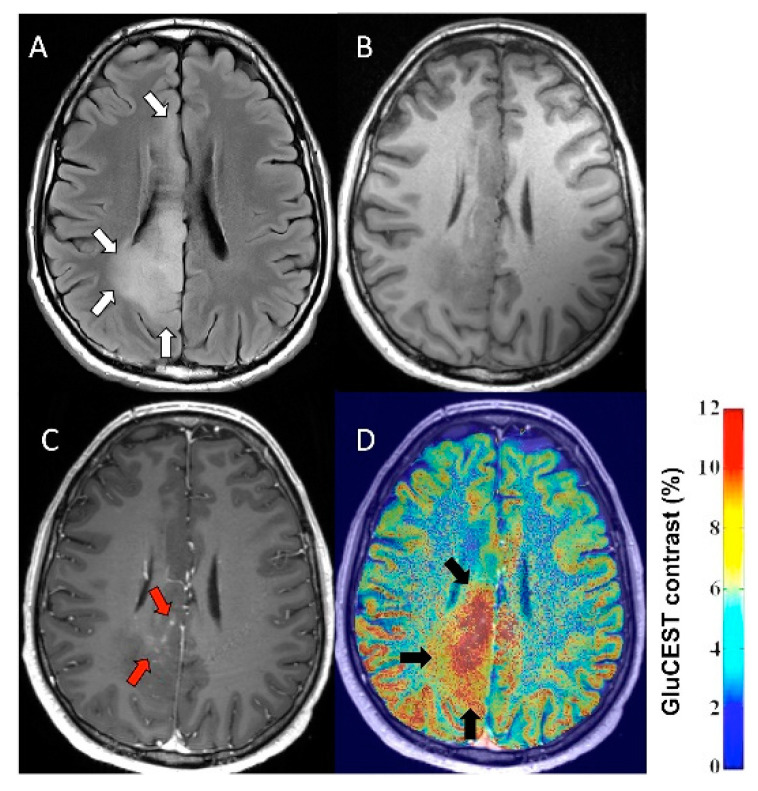
Epilepsy is a common clinical manifestation and a source of significant morbidity in patients with brain tumors. Neuroimaging has a pivotal role in neuro-oncology practice, including tumor detection, differentiation, grading, treatment guidance, and posttreatment monitoring. In this review, we highlight studies demonstrating that imaging can also provide information about brain tumor-associated epileptogenicity and assist delineation of the peritumoral epileptic cortex to optimize postsurgical seizure outcome. Most studies focused on gliomas and glioneuronal tumors where positron emission tomography (PET) and advanced magnetic resonance imaging (MRI) techniques can detect metabolic and biochemical changes associated with altered amino acid transport and metabolism, neuroinflammation, and neurotransmitter abnormalities in and around epileptogenic tumors. PET imaging of amino acid uptake and metabolism as well as activated microglia can detect interictal or peri-ictal cortical increased uptake (as compared to non-epileptic cortex) associated with tumor-associated epilepsy. Metabolic tumor volumes may predict seizure outcome based on objective treatment response during glioma chemotherapy. Advanced MRI, especially glutamate imaging, can detect neurotransmitter changes around epileptogenic brain tumors. Recently, developed PET radiotracers targeting specific glutamate receptor types may also identify therapeutic targets for pharmacologic seizure control. Further studies with advanced multimodal imaging approaches may facilitate development of precision treatment strategies to control brain tumor-associated epilepsy.
Keywords: amino acid; brain tumors; epilepsy; glioma; glutamate; magnetic resonance imaging; neuroinflammation; peritumoral cortex; positron emission tomography; seizures.
Conflict of interest statement
The authors declare no conflict of interest.
Figures
Similar articles
-
Neuronuclear assessment of patients with epilepsy.Semin Nucl Med. 2008 Jul;38(4):227-39. doi: 10.1053/j.semnuclmed.2008.02.004. Semin Nucl Med. 2008. PMID: 18514079 Review.
-
Positron emission tomography in presurgical localization of epileptic foci.Ideggyogy Sz. 2003 Jul 20;56(7-8):249-54. Ideggyogy Sz. 2003. PMID: 12971120
-
Amino acid positron emission tomography to monitor chemotherapy response and predict seizure control and progression-free survival in WHO grade II gliomas.Neuro Oncol. 2016 May;18(5):744-51. doi: 10.1093/neuonc/nov282. Epub 2015 Nov 17. Neuro Oncol. 2016. PMID: 26578622 Free PMC article.
-
Epileptic Activity Increases Cerebral Amino Acid Transport Assessed by 18F-Fluoroethyl-l-Tyrosine Amino Acid PET: A Potential Brain Tumor Mimic.J Nucl Med. 2017 Jan;58(1):129-137. doi: 10.2967/jnumed.116.176610. Epub 2016 Jul 28. J Nucl Med. 2017. PMID: 27469356
-
Imaging for Adults With Seizures and Epilepsy.Continuum (Minneap Minn). 2016 Oct;22(5, Neuroimaging):1451-1479. doi: 10.1212/CON.0000000000000370. Continuum (Minneap Minn). 2016. PMID: 27740984 Review.
Cited by
-
Extra-temporal pediatric low-grade gliomas and epilepsy.Childs Nerv Syst. 2024 Oct;40(10):3309-3327. doi: 10.1007/s00381-024-06573-8. Epub 2024 Aug 27. Childs Nerv Syst. 2024. PMID: 39191974 Review.
-
Glioblastoma disrupts cortical network activity at multiple spatial and temporal scales.Nat Commun. 2024 May 27;15(1):4503. doi: 10.1038/s41467-024-48757-5. Nat Commun. 2024. PMID: 38802334 Free PMC article.
-
Peritumoral Brain Zone in Astrocytoma: Morphology, Molecular Aspects, and Clinical Manifestations (Review).Sovrem Tekhnologii Med. 2024;16(2):79-88. doi: 10.17691/stm2024.16.2.08. Epub 2024 Apr 27. Sovrem Tekhnologii Med. 2024. PMID: 39539752 Free PMC article. Review.
-
Brain tumor-related epilepsy management: A Society for Neuro-oncology (SNO) consensus review on current management.Neuro Oncol. 2024 Jan 5;26(1):7-24. doi: 10.1093/neuonc/noad154. Neuro Oncol. 2024. PMID: 37699031 Free PMC article. Review.
References
-
- Kurzwelly D., Herrlinger U., Simon M. Seizures in patients with low-grade gliomas—Incidence, pathogenesis, surgical management, and pharmacotherapy. Adv. Tech. Stand. Neurosurg. 2010;35:81–111. - PubMed
-
- Avila E.K., Chamberlain M., Schiff D., Reijneveld J.C., Armstrong T.S., Ruda R., Wen P.Y., Weller M., Koekkoek J.A., Mittal S., et al. Seizure control as a new metric in assessing efficacy of tumor treatment in low-grade glioma trials. Neuro Oncol. 2017;19:12–21. doi: 10.1093/neuonc/now190. - DOI - PMC - PubMed
-
- Klinger N.V., Shah A.K., Mittal S. Management of brain tumor-related epilepsy. Neurol. India. 2017;65:S60–S70. - PubMed
Publication types
LinkOut - more resources
Full Text Sources
