Sleep/Wake Behavior and EEG Signatures of the TgF344-AD Rat Model at the Prodromal Stage
- PMID: 33291462
- PMCID: PMC7730237
- DOI: 10.3390/ijms21239290
Sleep/Wake Behavior and EEG Signatures of the TgF344-AD Rat Model at the Prodromal Stage
Abstract
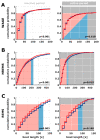
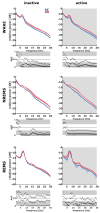
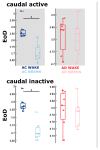
Transgenic modification of the two most common genes (APPsw, PS1ΔE9) related to familial Alzheimer's disease (AD) in rats has produced a rodent model that develops pathognomonic signs of AD without genetic tau-protein modification. We used 17-month-old AD rats (n = 8) and age-matched controls (AC, n = 7) to evaluate differences in sleep behavior and EEG features during wakefulness (WAKE), non-rapid eye movement sleep (NREM), and rapid eye movement sleep (REM) over 24-h EEG recording (12:12h dark-light cycle). We discovered that AD rats had more sleep-wake transitions and an increased probability of shorter REM and NREM bouts. AD rats also expressed a more uniform distribution of the relative spectral power. Through analysis of information content in the EEG using entropy of difference, AD animals demonstrated less EEG information during WAKE, but more information during NREM. This seems to indicate a limited range of changes in EEG activity that could be caused by an AD-induced change in inhibitory network function as reflected by increased GABAAR-β2 expression but no increase in GAD-67 in AD animals. In conclusion, this transgenic rat model of Alzheimer's disease demonstrates less obvious EEG features of WAKE during wakefulness and less canonical features of sleep during sleep.
Keywords: Alzheimer’s; electroencephalography; sleep architecture.
Conflict of interest statement
The authors declare no conflict of interest.
Figures


Similar articles
-
Behavioral sleep-wake homeostasis and EEG delta power are decoupled by chronic sleep restriction in the rat.Sleep. 2015 May 1;38(5):685-97. doi: 10.5665/sleep.4656. Sleep. 2015. PMID: 25669184 Free PMC article.
-
Lesion of the pedunculopontine tegmental nucleus in rat augments cortical activation and disturbs sleep/wake state transitions structure.Exp Neurol. 2013 Sep;247:562-71. doi: 10.1016/j.expneurol.2013.02.007. Epub 2013 Feb 26. Exp Neurol. 2013. PMID: 23481548
-
Temporal Organization of the Sleep-Wake Cycle under Food Entrainment in the Rat.Sleep. 2016 Jul 1;39(7):1451-65. doi: 10.5665/sleep.5982. Sleep. 2016. PMID: 27091526 Free PMC article.
-
[Selective stimulations and lesions of the rat brain nuclei as the models for research of the human sleep pathology mechanisms].Glas Srp Akad Nauka Med. 2011;(51):85-97. Glas Srp Akad Nauka Med. 2011. PMID: 22165729 Review. Serbian.
-
Wake and Sleep EEG in Patients With Huntington Disease: An eLORETA Study and Review of the Literature.Clin EEG Neurosci. 2017 Jan;48(1):60-71. doi: 10.1177/1550059416632413. Epub 2016 Apr 19. Clin EEG Neurosci. 2017. PMID: 27094758 Review.
Cited by
-
An in-depth analysis of parameter settings and probability distributions of specific ordinal patterns in the Shannon permutation entropy during different states of consciousness in humans.J Clin Monit Comput. 2024 Apr;38(2):385-397. doi: 10.1007/s10877-023-01051-z. Epub 2023 Jul 29. J Clin Monit Comput. 2024. PMID: 37515662 Free PMC article.
-
TgF344-AD Rat Model of Alzheimer's Disease: Spatial Disorientation and Asymmetry in Hemispheric Neurodegeneration.J Alzheimers Dis Rep. 2023 Sep 26;7(1):1085-1094. doi: 10.3233/ADR-230038. eCollection 2023. J Alzheimers Dis Rep. 2023. PMID: 37849636 Free PMC article.
-
Early emergence of motivational and hedonic feeding deficits in the TgF344-AD rat model of Alzheimer's disease.Front Aging Neurosci. 2025 Apr 28;17:1572956. doi: 10.3389/fnagi.2025.1572956. eCollection 2025. Front Aging Neurosci. 2025. PMID: 40357232 Free PMC article.
-
The impact of tethered recording techniques on activity and sleep patterns in rats.Sci Rep. 2022 Feb 24;12(1):3179. doi: 10.1038/s41598-022-06307-3. Sci Rep. 2022. PMID: 35210444 Free PMC article.
-
Insights From TgF344-AD, a Double Transgenic Rat Model in Alzheimer's Disease Research.Physiol Res. 2025 Mar 21;74(1):1-17. doi: 10.33549/physiolres.935464. Physiol Res. 2025. PMID: 40116546 Free PMC article. Review.
References
-
- Evans D.A., Funkenstein H.H., Albert M.S., Scherr P.A., Cook N.R., Chown M.J., Hebert L.E., Hennekens C.H., Taylor J.O. Prevalence of Alzheimer’s disease in a community population of older persons: Higher than previously reported. JAMA. 1989;262:2551–2556. doi: 10.1001/jama.1989.03430180093036. - DOI - PubMed
-
- Cohen R.M., Rezai-Zadeh K., Weitz T.M., Rentsendorj A., Gate D., Spivak I., Bholat Y., Vasilevko V., Glabe C.G., Breunig J.J., et al. A transgenic Alzheimer rat with plaques, tau pathology, behavioral impairment, oligomeric aβ, and frank neuronal loss. J. Neurosci. 2013;33:6245–6256. doi: 10.1523/JNEUROSCI.3672-12.2013. - DOI - PMC - PubMed
MeSH terms
Substances
Grants and funding
LinkOut - more resources
Full Text Sources

