Meta-Analysis
. 2020 Dec 5;17(23):9096.
doi: 10.3390/ijerph17239096.

Investigating the Psychological Impact of COVID-19 among Healthcare Workers: A Meta-Analysis

Affiliations
Meta-Analysis

Investigating the Psychological Impact of COVID-19 among Healthcare Workers: A Meta-Analysis

Kavita Batra et al. Int J Environ Res Public Health. .

Abstract

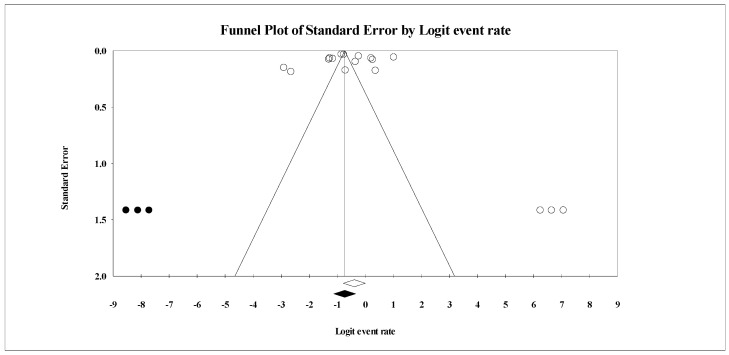
Previous meta-analyses were conducted during the initial phases of the COVID-19 pandemic, which utilized a smaller pool of data. The current meta-analysis aims to provide additional (and updated) evidence related to the psychological impact among healthcare workers. The search strategy was developed by a medical librarian and bibliographical databases, including Medline, Embase, CINAHL, PsycINFO, and Scopus were searched for studies examining the impact of the COVID-19 pandemic on the psychological health of healthcare workers. Articles were screened by three reviewers. Heterogeneity among studies was assessed by I2 statistic. The random-effects model was utilized to obtain the pooled prevalence. A subgroup analysis by region, gender, quality of study, assessment methods, healthcare profession, and exposure was performed. Publication bias was assessed by Funnel plot and Egger linear regression test. Sixty-five studies met the inclusion criteria and the total sample constituted 79,437 participants. The pooled prevalence of anxiety, depression, stress, post-traumatic stress syndrome, insomnia, psychological distress, and burnout was 34.4%, 31.8%, 40.3%, 11.4%, 27.8%, 46.1%, and 37.4% respectively. The subgroup analysis indicated higher anxiety and depression prevalence among females, nurses, and frontline responders than males, doctors, and second-line healthcare workers. This study highlights the need for designing a targeted intervention to improve resilience and foster post-traumatic growth among frontline responders.

Keywords: COVID-19; SARS-COV-2; anxiety; burnout; depression; fatigue; insomnia; post-traumatic stress syndrome; psychological; stress.


Conflict of interest statement

The authors declare no conflict of interest.

Figures

Figure A1
Figure A1
Forest plot for the studies on the prevalence of insomnia among healthcare workers. The squares and horizontal lines correspond to the study-specific event (anxiety) rates and 95% confidence intervals (CIs). The diamond represents the pooled prevalence and 95% CI of the overall population. The overall pooled insomnia using a random effects DerSimonian-Laird method was 27.8% (95% CI: 21.4–35.3).
Figure A2
Figure A2
Forest plot for the studies on the prevalence of impaired sleep quality among healthcare workers. The squares and horizontal lines correspond to the study-specific event (anxiety) rates and 95% confidence intervals (CIs). The diamond represents the pooled prevalence and 95% CI of the overall population. The overall pooled impaired sleep quality using a random effects DerSimonian-Laird method was 64.3% (95% CI: 55.0–72.7).
Figure A3
Figure A3
Forest plot for the studies on the prevalence of Post-traumatic stress syndrome (PTSD) among healthcare workers. The squares and horizontal lines correspond to the study-specific event (anxiety) rates and 95% confidence intervals (CIs). The diamond represents the pooled prevalence and 95% CI of the overall population. The overall pooled PTSD using a random effects DerSimonian-Laird method was 11.4% (95% CI: 3.6–30.9).
Figure A4
Figure A4
Forest plot for the studies on the prevalence of psychological distress among healthcare workers. The squares and horizontal lines correspond to the study-specific event (anxiety) rates and 95% confidence intervals (CIs). The diamond represents the pooled prevalence and 95% CI of the overall population. The overall pooled psychological distress using a random effects DerSimonian-Laird method was 46.1% (95% CI: 36.0–56.6).
Figure A5
Figure A5
Forest plot for the studies on the prevalence of burnout among healthcare workers. The squares and horizontal lines correspond to the study-specific event (anxiety) rates and 95% confidence intervals (CIz). The diamond represents the pooled prevalence and 95% CI of the overall population. The overall pooled burnout using a random effects DerSimonian-Laird method was 37.4% (95% CI: 14.8–67.2).
Figure A6
Figure A6
Funnel plot for studies on the prevalence of anxiety (Egger test: P = 0.15; Begg test: P = 0.90). The vertical solid line represents the summary effect estimates.
Figure A7
Figure A7
Funnel plot for studies on the prevalence of depression (Egger test: P = 0.90; Begg test: P = 0.64). The vertical solid line represents the summary effect estimates.
Figure A8
Figure A8
Funnel plot for studies on the prevalence of stress (Egger test: P = 0.69; Begg test: P = 0.86). The vertical solid line represents the summary effect estimates.
Figure A9
Figure A9
Funnel plot for studies on the prevalence of insomnia (Egger test: P = 0.01; Begg test: P = 0.03). The vertical solid line represents the summary effect estimates.
Figure A10
Figure A10
Funnel plot for studies on the prevalence of impaired sleep quality (Egger test: P = 0.22; Begg test: P = 0.22). The vertical solid line represents the summary effect estimates.
Figure A11
Figure A11
Funnel plot for studies on the prevalence of PTSD (Egger test: P = 0.22; Begg test: P = 0.90). The vertical solid line represents the summary effect estimates.
Figure A12
Figure A12
Funnel plot for studies on the prevalence of psychological distress (Egger test: P = 0.45; Begg test: P = 0.73). The vertical solid line represents the summary effect estimates.
Figure A13
Figure A13
Funnel plot for studies on the prevalence of burnout (Egger test: P = 0.47; Begg test: P = 0.60). The vertical solid line represents the summary effect estimates.
Figure 1
Figure 1
PRISMA (Preferred Reporting Items for Systematic Reviews and Meta-Analysis) flow diagram detailing the disposition of screened, included, and excluded records.
Figure 2
Figure 2
Forest plot for the studies on the prevalence of anxiety among healthcare workers. The squares and horizontal lines correspond to the study-specific event (anxiety) rates and 95% confidence intervals (CIs). The diamond represents the pooled prevalence and 95% CIs of the overall population. The overall pooled anxiety using a random effects DerSimonian-Laird method was 34.4% (95% CI: 29.5–39.7).
Figure 3
Figure 3
Forest plot for the studies on the prevalence of depression among healthcare workers. The squares and horizontal lines correspond to the study-specific event (anxiety) rates and 95% confidence intervals (CIs). The diamond represents the pooled prevalence and 95% CI of the overall population. The overall pooled depression using a random effects DerSimonian-Laird method was 31.8% (95% CI: 26.8–37.2).
Figure 4
Figure 4
Forest plot for the studies on the prevalence of stress among healthcare workers. The squares and horizontal lines correspond to the study-specific event (anxiety) rates and 95% confidence intervals (CIs). The diamond represents the pooled prevalence and 95% CIs of the overall population. The overall pooled stress using a random effects DerSimonian-Laird method was 40.3% (95% CI 31.4–50.0).

References

    1. Shereen M.A., Khan S., Kazmi A., Bashir N., Siddique R. COVID-19 infection: Origin, transmission, and characteristics of human coronaviruses. J. Adv. Res. 2020;24:91–98. doi: 10.1016/j.jare.2020.03.005. - DOI - PMC - PubMed
    1. Huang C., Wang Y., Li X., Ren L., Zhao J., Hu Y., Zhang L., Fan G., Xu J., Gu X., et al. Clinical features of patients infected with 2019 novel coronavirus in Wuhan, China. Lancet. 2020;395:497–506. doi: 10.1016/S0140-6736(20)30183-5. - DOI - PMC - PubMed
    1. Liu X., Kakade M., Fuller C.J., Fan B., Fang Y., Kong J., Guan Z., Wu P. Depression after exposure to stressful events: Lessons learned from the severe acute respiratory syndrome epidemic. Compr. Psychiatry. 2012;53:15–23. doi: 10.1016/j.comppsych.2011.02.003. - DOI - PMC - PubMed
    1. Bai Y.-M., Lin C.-C., Lin C.-Y., Chao-Cheng L., Chue C.-M., Chou P. Survey of Stress Reactions Among Health Care Workers Involved With the SARS Outbreak. Psychiatr. Serv. 2004;55:1055–1057. doi: 10.1176/appi.ps.55.9.1055. - DOI - PubMed
    1. Nickell L.A., Crighton E.J., Tracy C.S., Al-Enazy H., Bolaji Y., Hanjrah S., Hussain A., Makhlouf S., Upshur R.E.G. Psychosocial effects of SARS on hospital staff: Survey of a large tertiary care institution. Can. Med. Assoc. J. 2004;170:793–798. doi: 10.1503/cmaj.1031077. - DOI - PMC - PubMed

Publication types