. 2020 Dec 4;21(23):9278.
doi: 10.3390/ijms21239278.

Fluorescence-Based Nanoparticle Tracking Analysis and Flow Cytometry for Characterization of Endothelial Extracellular Vesicle Release

Affiliations

Fluorescence-Based Nanoparticle Tracking Analysis and Flow Cytometry for Characterization of Endothelial Extracellular Vesicle Release

Johannes Oesterreicher et al. Int J Mol Sci. .

Abstract

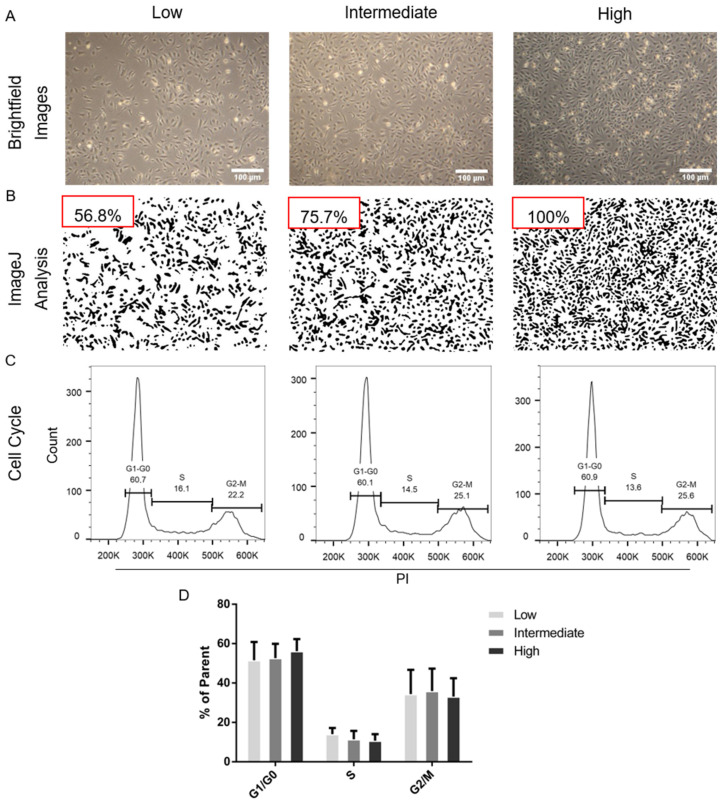
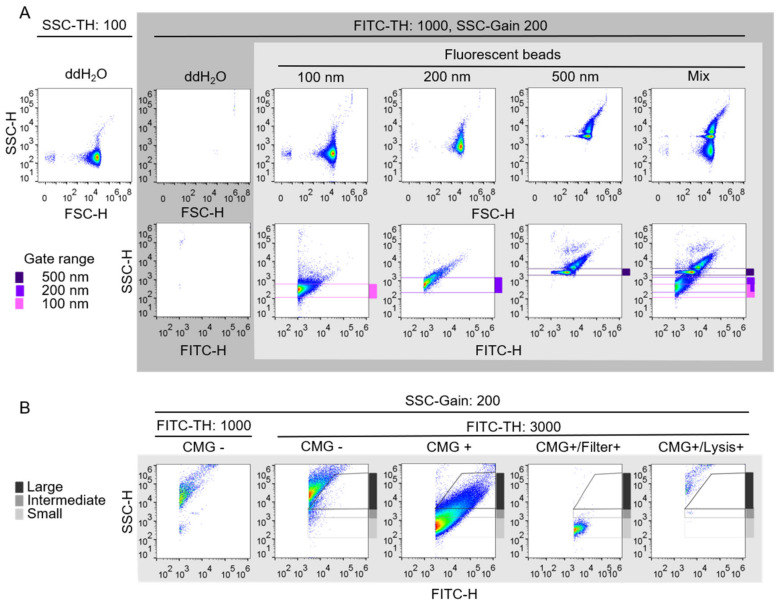
As extracellular vesicles (EVs) have become a prominent topic in life sciences, a growing number of studies are published on a regular basis addressing their biological relevance and possible applications. Nevertheless, the fundamental question of the true vesicular nature as well as possible influences on the EV secretion behavior have often been not adequately addressed. Furthermore, research regarding endothelial cell-derived EVs (EndoEVs) often focused on the large vesicular fractions comprising of microvesicles (MV) and apoptotic bodies. In this study we aimed to further extend the current knowledge of the influence of pre-isolation conditions, such as cell density and conditioning time, on EndoEV release from human umbilical vein endothelial cells (HUVECs). We combined fluorescence nanoparticle tracking analysis (NTA) and the established fluorescence-triggered flow cytometry (FT-FC) protocol to allow vesicle-specific detection and characterization of size and surface markers. We found significant effects of cell density and conditioning time on both abundance and size distribution of EndoEVs. Additionally, we present detailed information regarding the surface marker display on EVs from different fractions and size ranges. Our data provide crucial relevance for future projects aiming to elucidate EV secretion behavior of endothelial cells. Moreover, we show that the influence of different conditioning parameters on the nature of EndoEVs has to be considered.

Keywords: endothelial cells; extracellular vesicles; fluorescence triggering flow cytometry; nano particle tracking.


Conflict of interest statement

J.G. is co-founder of Evercyte GmbH. All other authors declare no conflicts of interest.

Figures

Figure 1
Figure 1
Achieved cell confluences and corresponding cell cycle distributions. Cell numbers for seeding were calculated to reach the respective confluences of 50–60% (Low), 70–80% (Medium) and 90–100% (High) after 24 h growth in endothelial growth medium (EGM-2). (A) Brightfield images of cell monolayers were obtained with 4× magnification. White scale bars indicating 100 µm. (B) Acquired images were analyzed using ImageJ to gain total surface coverage values for “Low” (56.8%) and “Medium” (75.7%) in relation to “High” (set as 100%). (C) Representative histograms plotted against propidium iodide fluorescence intensity of different confluence groups. (D) Quantification of the cell cycle distribution. “Low” shows mean values of 51.6% of the parent population in G1–G0, 14.0% in S and 34.4% in G2-M. 52.7% 56.2% in G1–G0, 11.5% and 10.7% in S and 35.9% and 33.1% in G2-M were detected for the “Intermediate” and “High” confluence groups, respectively. EGM-2 figure endothelial growth medium; (AC) representative samples, (D) n = 2 cell donors.
Figure 2
Figure 2
Establishment of fluorescence triggered flow cytometry. (A) To exclude unspecific events of particles present in commonly used reagents (top left), the size-dependent SSC default event trigger was changed to a FITC-dependent threshold trigger (top, grey box), resulting in a clearance of background events. FITC-labeled silica beads with different sizes (100, 200 and 500 nm) were applied individually and, subsequently, as a mix to initially confirm differentiated detection of nanometer-sized objects (light grey box). To confirm size-dependent FITC intensity, the FSC was changed to FITC-H (bottom, grey box). The SSC gain was increased to enable better separation and identification of the applied beads. Subsequently, initial gating was performed based on the known sizes of the applied beads shown in blue, purple, and pink (bottom, light grey box). (B) To distinguish between labeled vesicles and autofluorescence debris, unstained human umbilical vein endothelial cells (HUVECs) S0.5 cell supernatant fraction was analyzed (first from the left) and the FITC threshold was increased to minimize the detection of unspecific events (second from the left). The before applied size gates shown in A were merged to gain size range gates for small (≤200 nm), intermediate (>200–<500 nm) and large EVs (≥500 nm) before application of CellMask Green-stained HUVECs S0.5 for conformation of enabled detection (third from the left). Filtration of the S0.5 sample with a 0.22 µm polyvinylidene fluoride syringe filter results in loss of signals above the ≤200 nm gate, indicating correct size approximation (fourth from the left). Loss of signal in extracellular vesicle gates after lysis as proof of the vesicular nature of detected events (fifth from the left).
Figure 3
Figure 3
Distinct characteristics of human umbilical vein endothelial cell derived extracellular vesicles EVs. (A) The obtained cell culture supernatants (SN) were cleared from debris and large particle conglomerates via centrifugation at 500 and 2000× g for 5 min each. The cleared SN (S0.5) was used to analyze total particle and extracellular vesicle (EV) count via scatter and fluorescence mode nanoparticle tracking analysis (NTA). Their total size distribution was assessed via fluorescence-triggered flow cytometry (FT-FC). The large and denser subfraction of EVs was obtained by centrifugation for 30 min at 10,000× g (P10). Small and less dense EVs were enriched by ultracentrifugation for 65 min at 100,000× g (P100). Both subfractions were analyzed via FT-FC to obtain information on the respective surface marker composition. The remaining supernatant after the differential centrifugation procedure (S100) was analyzed for particle and EV count in order to check the efficiency of the enrichment. (B) Resulting representative density scatter plots of FT-FC analyzed EV enrichment fractions show less events detected in large EV gates (dark grey) for P100 enrichment fraction as compared to P10. Only a few events could be detected in S100 indicating a successful enrichment. (C) Quantification of EV presence in respective size range gates for FT-FC, showing increased proportion of “Small” vesicles (light grey) with a mean value of 89% and a decrease of “Intermediate” (grey) and “Large” (dark grey) vesicles with a mean of 7% and 3% in P100 compared to P10 with 83%, 11% and 6%, respectively. (D) Size distributions and particle counts of enrichment fractions analyzed via scatter mode NTA, for a representative sample. (E) Heatmap depicting percentages of CMG-stained and antibody-labeled EVs in the different size ranges (light grey, grey and dark grey), positive for the respective protein target indicated via color code subdivided in donor and individual enrichment fraction. Error bars indicate the mean values ± standard error of mean in scatter plots. (BD) Representative samples, (D) n = 2 cell donors.
Figure 4
Figure 4
Increasing cell confluence influences release and size of endothelial derived extracellular vesicles. (A) Significant differences in traced particles in the scatter mode with 184.9 for “Low”, 228.8 for “Medium” and 236.8 for “High” were detected. No significant difference between particle traces detected in fluorescence mode were found between the mean values of traced particles, 13.6 for “Low”, 14.3 for “Intermediate” and 14.1 for “High”. (B) Normalization of fluorescent extracellular vesicles (EVs) against their respective particle numbers detected in the scatter mode revealed increased EV:particle ratios of lower cell density groups with mean values of 7.4% in “Low”, 6.7% in “Medium” and 6.0% in “High”. (C) Size distributions of EVs, analyzed via fluorescence-triggered flow cytometry (FT-FC), shows significant shifts from small EV release to increased large vesicle numbers in the different confluence groups. The confluence group “Low” shows an EV size distribution with 41.53% in “Small” (≤200 nm), 23% in “Intermediate” (>200–<500 nm) and 29% in “Large” (≥500 nm). For “Medium” and “High” 39% and 37% in “Small”, 24% and 24% in “Intermediate”, and 30% and 33% in “Large” were detected, respectively. n = 3 cell donors, **** = p < 0.0001, *** = p < 0.001, ** = p < 0.01, * = p < 0.05, ns = p > 0.05. Error bars indicate the mean values ± the standard deviation in bar graphs and ± standard error of mean in scatter plots.
Figure 5
Figure 5
Increasing condition time influences release and size distribution of endothelial derived extracellular vesicles. (A) Significant different numbers of traced particles in the scatter mode from different conditioning times were detected with a mean of 102 in the “24 h” group and 205 in the “48 h” group. The number of extracellular vesicles (EVs) detected in the fluorescence mode was significantly different with mean values of 10.6 for the “24 h” group and 13.5 for the “48 h” group. (B) Normalization of EVs detected via fluorescence to the total traced particles in the scatter mode shows a significantly reduced EV release over extended conditioning periods, with a mean of 10.5% EVs from the “24 h” group and 6.3% from the “48 h” group. (C) Fluorescence-triggered flow cytometry (FT-FC) analyses of EV size distributions reveal an inverse correlation of EV sizes and conditioning times. Mean values of 43% “Small” (≤200 nm), 23% “Intermediate” (>200–<500 nm) and 26% “Large” (≥500 nm) in the respective size gates were detected for the “24 h” group. A percentage of 40% in “Small”, 24% in “Intermediate” and 30% in “Large” were detected in the “48 h” group. n = 3 cell donors, **** = p < 0.0001, * = p < 0.05, ns = p > 0.05. Error bars indicate the mean values ± the standard deviation in bar graphs and ± standard error of mean in scatter plots.

Similar articles

Cited by

References

    1. De Jong O.G., van Balkom B.W.M., Schiffelers R.M., Bouten C.V.C., Verhaar M.C. Extracellular vesicles: Potential roles in regenerative medicine. Front. Immunol. 2014;5:1–13. doi: 10.3389/fimmu.2014.00608. - DOI - PMC - PubMed
    1. Tsiapalis D., O’Driscoll L. Mesenchymal Stem Cell Derived Extracellular Vesicles for Tissue Engineering and Regenerative Medicine Applications. Cells. 2020;9:991. doi: 10.3390/cells9040991. - DOI - PMC - PubMed
    1. Zhou Y., Xiao Y. The Development of Extracellular Vesicle-Integrated Biomaterials for Bone Regeneration. Adv. Exp. Med. Biol. 2020;1250:97–108. doi: 10.1007/978-981-15-3262-7_7. - DOI - PubMed
    1. Hromada C., Mühleder S., Grillari J., Redl H., Holnthoner W. Endothelial Extracellular Vesicles-Promises and Challenges. Front. Physiol. 2017;8:275. doi: 10.3389/fphys.2017.00275. - DOI - PMC - PubMed
    1. Li Q., Huang Q.-P., Wang Y.-L., Huang Q.-S. Extracellular vesicle-mediated bone metabolism in the bone microenvironment. J. Bone Miner. Metab. 2018;36:1–11. doi: 10.1007/s00774-017-0860-5. - DOI - PubMed