. 2020 Dec 4;9(12):2610.
doi: 10.3390/cells9122610.

pH Mapping of Skeletal Muscle by Chemical Exchange Saturation Transfer (CEST) Imaging

Affiliations

pH Mapping of Skeletal Muscle by Chemical Exchange Saturation Transfer (CEST) Imaging

Yu-Wen Chen et al. Cells. .

Abstract

Magnetic resonance imaging (MRI) is extensively used in clinical and basic biomedical research. However, MRI detection of pH changes still poses a technical challenge. Chemical exchange saturation transfer (CEST) imaging is a possible solution to this problem. Using saturation transfer, alterations in the exchange rates between the solute and water protons because of small pH changes can be detected with greater sensitivity. In this study, we examined a fatigued skeletal muscle model in electrically stimulated mice. The measured CEST signal ratio was between 1.96 ppm and 2.6 ppm in the z-spectrum, and this was associated with pH values based on the ratio between the creatine (Cr) and the phosphocreatine (PCr). The CEST results demonstrated a significant contrast change at the electrical stimulation site. Moreover, the pH value was observed to decrease from 7.23 to 7.15 within 20 h after electrical stimulation. This pH decrease was verified by 31P magnetic resonance spectroscopy and behavioral tests, which showed a consistent variation over time.

Keywords: CEST; MRI; muscle; pH.


Conflict of interest statement

The authors declare no conflict of interest.

Figures

Figure 1
Figure 1
The background curve (blue) is generated by two Lorentzian functions, which include direct saturation of water molecules (red) and the magnetization transfer (MT) (purple), respectively. This background signal also consists of the one simulated by Equation (4) (cyan dash line).
Figure 2
Figure 2
The z-spectra of (a) Cr and (b) PCr phantoms at various pH values measured by chemical exchange saturation transfer (CEST) NMR spectroscopy. (c) The integration (symbol) and fitting (line) results of signals at the peak around 1.96 ppm in (a) and 1.96 and 2.6 ppm in (b). (d) The relationship between the Cr/PCr and the pH was fitted by Equation (3). Data points denoted by ■ were from reference [46]. (e) The calibration curve of pH as a function of the ratio of the 1.96 ppm to 2.6 ppm signals, only showing the range used (pH = 7–7.25).
Figure 2
Figure 2
The z-spectra of (a) Cr and (b) PCr phantoms at various pH values measured by chemical exchange saturation transfer (CEST) NMR spectroscopy. (c) The integration (symbol) and fitting (line) results of signals at the peak around 1.96 ppm in (a) and 1.96 and 2.6 ppm in (b). (d) The relationship between the Cr/PCr and the pH was fitted by Equation (3). Data points denoted by ■ were from reference [46]. (e) The calibration curve of pH as a function of the ratio of the 1.96 ppm to 2.6 ppm signals, only showing the range used (pH = 7–7.25).
Figure 3
Figure 3
(a) The z-spectra of skeletal muscles before (red) and after (blue) electrical stimulation measured by CEST imaging. The box on the right shows a magnified view of the z-spectra between 1 and 4 ppm. (b) The original data curve was subtracted from the fitted background curve (the Lorentzian difference analysis (LDA) method). Then, the processed data were deconvoluted by three Lorentzian distributions at 1.96 (red), 2.6 (green), and 3.5 (blue) ppm. Then, the fitting areas were utilized to determine the pH values.
Figure 4
Figure 4
(a) Time-dependent pH variation in CEST images by region of interest (ROI) analysis of gastrocnemius muscle region. The ROI is shown in (b). The pH of the electrical stimulation group () and control group () by ROI analysis through time. The 0-h data in the electrical stimulation group refer to the readings taken before electrical stimulation. The deviation between 0-h data in the electrical stimulation and control group may be due to the influence of implanted electrodes (tungsten wires). (c) The mean, maximum, and minimum plots of pH of electrical stimulation (green) and control group (red) with different times. A t-test was utilized to test statistical significance of the difference in means. The differences between the electrical stimulation and control group at 3-h and 20-h post-stimulation data are significant (*** p < 0.001). (d) A similar plot showing the pH of the electrical stimulation group at different time points. The t-test shows that the differences between the pH readings of pre-stimulation and 3-h and 20-h post-stimulation groups are statistically significant (** p < 0.01, *** p < 0.001, respectively).
Figure 5
Figure 5
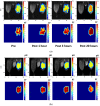
(a) The time-dependent pH mapping of the electrically stimulated mouse leg (up) and R2 mapping (bottom) to show the coefficient of determination of pH mapping. The pH mapping of the control group and the T2WI of the electrically stimulated mouse leg are presented in (b,c), respectively, for comparison. The T2WI of the electrically stimulated mouse leg shows only a slightly difference in the gastrocnemius region at 1- and 3-h post-stimulation, and is not distinguishable from the pre-stimulation image after 20 h. (d) The pathology of the skeletal muscle of the control group 1 h and 20 h after stimulation.
Figure 5
Figure 5
(a) The time-dependent pH mapping of the electrically stimulated mouse leg (up) and R2 mapping (bottom) to show the coefficient of determination of pH mapping. The pH mapping of the control group and the T2WI of the electrically stimulated mouse leg are presented in (b,c), respectively, for comparison. The T2WI of the electrically stimulated mouse leg shows only a slightly difference in the gastrocnemius region at 1- and 3-h post-stimulation, and is not distinguishable from the pre-stimulation image after 20 h. (d) The pathology of the skeletal muscle of the control group 1 h and 20 h after stimulation.
Figure 6
Figure 6
(a) 31P MRS of the electrical stimulation group. (b) A close-up (−2.0–8.0 ppm) of the 31P MRS data showing the Pi chemical shift variation over time. The frequency at which Pi moves up-field with time. The chemical shift between PCr and Pi was measured by 31P MRS and then using Equation (5). (c) The time-dependent pH of the electrical stimulation group () and control group () using 31P MRS analysis. (d) The von Frey test results for the paws with () and without () electrical stimulation.
Figure 7
Figure 7
The correlation of pH measurements using 31P MRS and CEST methods. The relationship between pH values measured by these two methods is almost linear. The difference may be attributed to differences in the size of the area measured.

Similar articles

Cited by

References

    1. Wan J.J., Qin Z., Wang P.Y., Sun Y., Liu X. Muscle fatigue: General understanding and treatment. Exp. Mol. Med. 2017;49:e384. doi: 10.1038/emm.2017.194. - DOI - PMC - PubMed
    1. Calderón J.C., Bolaños P., Caputo C. The excitation-contraction coupling mechanism in skeletal muscle. Biophys. Rev. 2014;6:133–160. doi: 10.1007/s12551-013-0135-x. - DOI - PMC - PubMed
    1. Aalkjaer C., Peng H.L. pH and smooth muscle. Acta Physiol. Scand. 1997;161:557–566. doi: 10.1046/j.1365-201X.1997.00263.x. - DOI - PubMed
    1. Street D., Bangsbo J., Juel C. Interstitial pH in human skeletal muscle during and after dynamic graded exercise. J. Physiol. 2001;537:993–998. doi: 10.1113/jphysiol.2001.012954. - DOI - PMC - PubMed
    1. Sjøgaard G., Adams R.P., Saltin B. Water and ion shifts in skeletal muscle of humans with intense dynamic knee extension. Pt 2Am. J. Physiol. 1985;248:R190–R196. doi: 10.1152/ajpregu.1985.248.2.R190. - DOI - PubMed

Publication types