. 2020 Dec 8;52(1):72.
doi: 10.1186/s12711-020-00592-0.

A systems biology framework integrating GWAS and RNA-seq to shed light on the molecular basis of sperm quality in swine

Affiliations

A systems biology framework integrating GWAS and RNA-seq to shed light on the molecular basis of sperm quality in swine

Marta Gòdia et al. Genet Sel Evol. .

Abstract

Background: Genetic pressure in animal breeding is sparking the interest of breeders for selecting elite boars with higher sperm quality to optimize ejaculate doses and fertility rates. However, the molecular basis of sperm quality is not yet fully understood. Our aim was to identify candidate genes, pathways and DNA variants associated to sperm quality in swine by analysing 25 sperm-related phenotypes and integrating genome-wide association studies (GWAS) and RNA-seq under a systems biology framework.

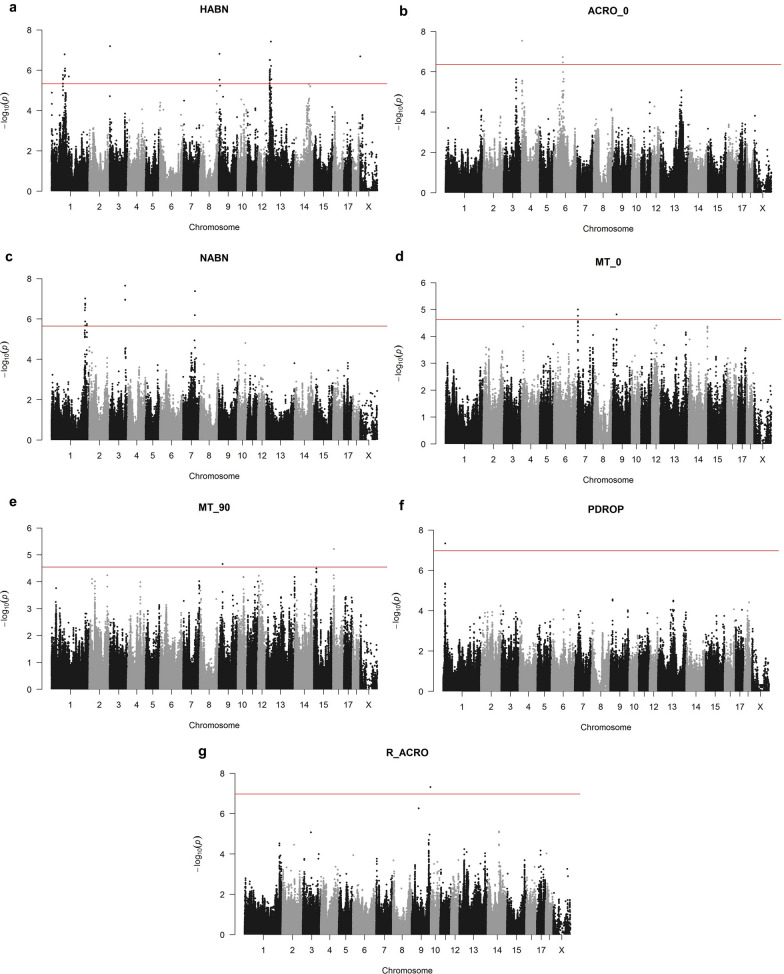
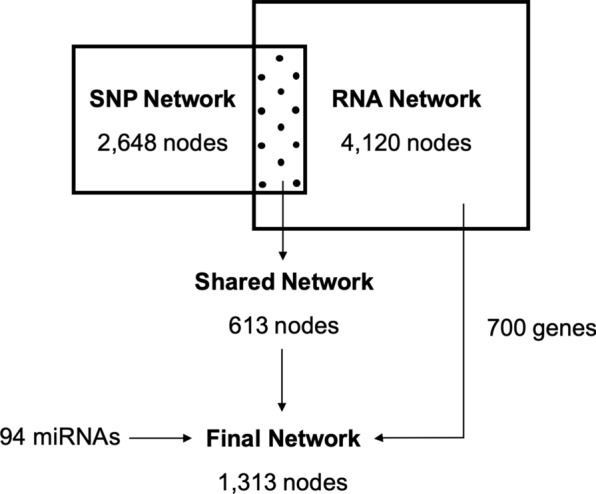
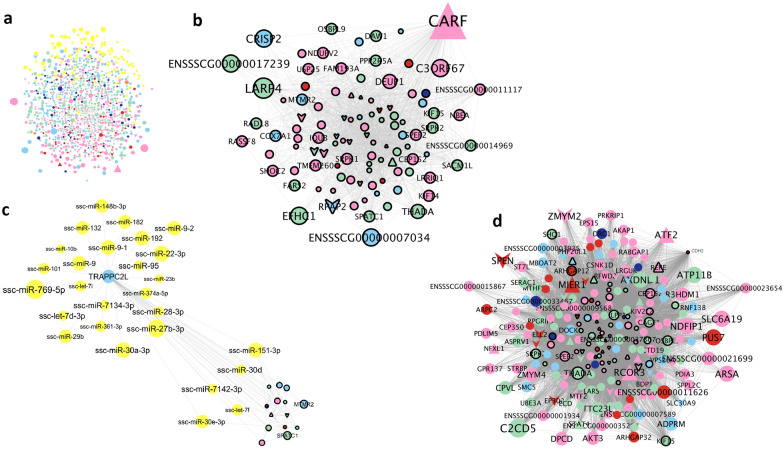
Results: By GWAS, we identified 12 quantitative trait loci (QTL) associated to the percentage of head and neck abnormalities, abnormal acrosomes and motile spermatozoa. Candidate genes included CHD2, KATNAL2, SLC14A2 and ABCA1. By RNA-seq, we identified a wide repertoire of mRNAs (e.g. PRM1, OAZ3, DNAJB8, TPPP2 and TNP1) and miRNAs (e.g. ssc-miR-30d, ssc-miR-34c, ssc-miR-30c-5p, ssc-miR-191, members of the let-7 family and ssc-miR-425-5p) with functions related to sperm biology. We detected 6128 significant correlations (P-value ≤ 0.05) between sperm traits and mRNA abundances. By expression (e)GWAS, we identified three trans-expression QTL involving the genes IQCJ, ACTR2 and HARS. Using the GWAS and RNA-seq data, we built a gene interaction network. We considered that the genes and interactions that were present in both the GWAS and RNA-seq networks had a higher probability of being actually involved in sperm quality and used them to build a robust gene interaction network. In addition, in the final network we included genes with RNA abundances correlated with more than four semen traits and miRNAs interacting with the genes on the network. The final network was enriched for genes involved in gamete generation and development, meiotic cell cycle, DNA repair or embryo implantation. Finally, we designed a panel of 73 SNPs based on the GWAS, eGWAS and final network data, that explains between 5% (for sperm cell concentration) and 36% (for percentage of neck abnormalities) of the phenotypic variance of the sperm traits.

Conclusions: By applying a systems biology approach, we identified genes that potentially affect sperm quality and constructed a SNP panel that explains a substantial part of the phenotypic variance for semen quality in our study and that should be tested in other swine populations to evaluate its relevance for the pig breeding sector.


Conflict of interest statement

The authors declare that they have no competing interests.

Figures

Fig. 1
Fig. 1
Manhattan plots depicting the genetic associations between SNPs and the sperm quality traits that showed genome-wide significant values. Significant associations have been found with the percentage of: a Percentage of cells with head abnormalities (HABN); b percentage of cells with abnormal acrosomes after 5 min incubation at 37°C (ACRO_5); c percentage of cells with neck abnormalities (NABN); d percentage of motile spermatozoa after 5 min incubation at 37°C (MT_5); e Percentage of motile spermatozoa after 90 min incubation at 37°C (MT_90); f Percentage of cells with proximal droplets (PDROP); g Ratio of the percentage of abnormal acrosomes at 5 min versus 90 min incubation times (R_ACRO). The x-axis represents chromosome length (Mb), and the y-axis shows the negative log10 P-values of the genetic associations. The horizontal red line represents the significance threshold (FDR ≤ 0.05)
Fig. 2
Fig. 2
Number of nodes (genes) in each of the gene network analyses. The SNP network involved 2648 nodes connected by 2,984,616 edges (interactions). The RNA Network included 4120 nodes connected by 1,173,995 edges. The shared network included the 613 nodes and 16,591 edges present in both the SNP and the RNA networks. The final network included (i) the shared network, (ii) 700 additional genes corresponding to genes that correlated with more than four traits and their interacting genes (iii) as well as 94 co-associated miRNAs. These miRNAs interacted with 202 nodes involving 1564 edges
Fig. 3
Fig. 3
Co-association network based on the AWM and transcriptomics data. a Full network with 1313 genes and 94 miRNAs; b Subset of the network showing the transcription factor CARF and all its predicted interactions; c Subset of the network with the TRAPPC2L interactions, which included several miRNAs; d Subset of the network with the CHD2 gene interactions. The node color corresponds to the phenotype group with the highest correlation value, as follows: concentration (red), abnormal acrosomes (green), abnormalities and droplets (pink), osmotic resistance test (orange), motility (light blue) and viability (dark blue). miRNAs are depicted in yellow. Node and text sizes correspond to the number of significant phenotypes correlated with that gene or miRNA. Nodes with a black line border correspond to genes identified in the shared network. Node shape indicates classification as: triangle (TF), V (TF co-factor) and ellipse (other genes and miRNAs)

References

    1. Boe-Hansen GB, Fortes MRS, Satake N. Morphological defects, sperm DNA integrity, and protamination of bovine spermatozoa. Andrology. 2018;6:627–633. doi: 10.1111/andr.12486. - DOI - PubMed
    1. Gòdia M, Swanson G, Krawetz SA. A history of why fathers' RNA matters. Biol Reprod. 2018;99:147–159. doi: 10.1093/biolre/ioy007. - DOI - PubMed
    1. Krausz C, Escamilla AR, Chianese C. Genetics of male infertility: from research to clinic. Reproduction. 2015;150:R159–R174. doi: 10.1530/REP-15-0261. - DOI - PubMed
    1. Gadea J. Sperm factors related to in vitro and in vivo porcine fertility. Theriogenology. 2005;63:431–444. doi: 10.1016/j.theriogenology.2004.09.023. - DOI - PubMed
    1. Diniz DB, Lopes MS, Broekhuijse ML, Lopes PS, Harlizius B, Guimaraes SE, et al. A genome-wide association study reveals a novel candidate gene for sperm motility in pigs. Anim Reprod Sci. 2014;151:201–207. doi: 10.1016/j.anireprosci.2014.10.014. - DOI - PubMed