

All-cause mortality supports the COVID-19 mortality in Belgium and comparison with major fatal events of the last century
- PMID: 33292536
- PMCID: PMC7662738
- DOI: 10.1186/s13690-020-00496-x
All-cause mortality supports the COVID-19 mortality in Belgium and comparison with major fatal events of the last century
Abstract
Background: The COVID-19 mortality rate in Belgium has been ranked among the highest in the world. To assess the appropriateness of the country's COVID-19 mortality surveillance, that includes long-term care facilities deaths and deaths in possible cases, the number of COVID-19 deaths was compared with the number of deaths from all-cause mortality. Mortality during the COVID-19 pandemic was also compared with historical mortality rates from the last century including those of the Spanish influenza pandemic.
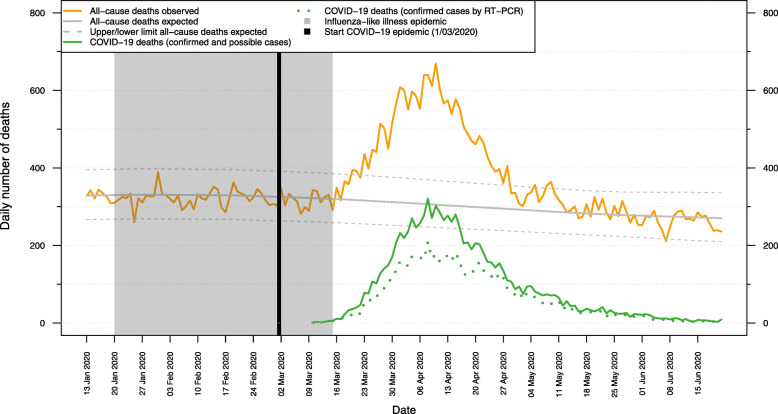
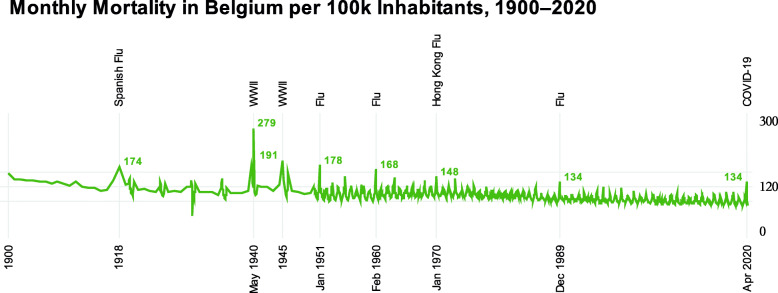
Methods: Excess mortality predictions and COVID-19 mortality data were analysed for the period March 10th to June 21st 2020. The number of COVID-19 deaths and the COVID-19 mortality rate per million were calculated for hospitals, nursing homes and other places of death, according to diagnostic status (confirmed/possible infection). To evaluate historical mortality, monthly mortality rates were calculated from January 1900 to June 2020.
Results: Nine thousand five hundred ninety-one COVID-19 deaths and 39,076 deaths from all-causes were recorded, with a correlation of 94% (Spearman's rho, p < 0,01). During the period with statistically significant excess mortality (March 20th to April 28th; total excess mortality 64.7%), 7917 excess deaths were observed among the 20,159 deaths from all-causes. In the same period, 7576 COVID-19 deaths were notified, indicating that 96% of the excess mortality were likely attributable to COVID-19. The inclusion of deaths in nursing homes doubled the COVID-19 mortality rate, while adding deaths in possible cases increased it by 27%. Deaths in laboratory-confirmed cases accounted for 69% of total COVID-19-related deaths and 43% of in-hospital deaths. Although the number of deaths was historically high, the monthly mortality rate was lower in April 2020 compared to the major fatal events of the last century.
Conclusions: Trends in all-cause mortality during the first wave of the epidemic was a key indicator to validate the Belgium's high COVID-19 mortality figures. A COVID-19 mortality surveillance limited to deaths from hospitalised and selected laboratory-confirmed cases would have underestimated the magnitude of the epidemic. Excess mortality, daily and monthly number of deaths in Belgium were historically high classifying undeniably the first wave of the COVID-19 epidemic as a fatal event.
Keywords: All-cause mortality; COVID-19; Excess mortality; Mortality; Pandemic.
Conflict of interest statement
HVO is Editor-in-Chief of Archives of Public Health. The authors declare that they have no competing interests.
Figures
References
-
- WHO (2020) 2019-nCoV outbreak is an emergency of international concern. http://www.euro.who.int/en/health-topics/health-emergencies/coronavirus-.... Accessed 20 May 2020.
-
- Sciensano Epistat - Belgian COVID-19 opendata. https://epistat.wiv-isp.be/covid/. Accessed 12 Sept 2020.
-
- Johns Hopkins University Mortality Analyses - COVID-19. In: Johns Hopkins Coronavirus Resource Center. https://coronavirus.jhu.edu/data/mortality. Accessed 26 Jun 2020.
-
- ECDC Weekly surveillance summary, surveillance system description, definition of COVID-19 deaths by country. https://covid19-surveillance-report.ecdc.europa.eu/. Accessed 12 Sept 2020.
-
- Sciensano COVID-19 surveillance, frequently asked questions. https://covid-19.sciensano.be/sites/default/files/Covid19/COVID-19_FAQ_E.... Accessed 12 Sept 2020.
LinkOut - more resources
Full Text Sources
Miscellaneous
