. 2020 Dec 8:371:m4266.
doi: 10.1136/bmj.m4266.

Association between low density lipoprotein and all cause and cause specific mortality in Denmark: prospective cohort study

Affiliations

Association between low density lipoprotein and all cause and cause specific mortality in Denmark: prospective cohort study

Camilla Ditlev Lindhardt Johannesen et al. BMJ. .

Erratum in

Abstract

Objective: To determine the association between levels of low density lipoprotein cholesterol (LDL-C) and all cause mortality, and the concentration of LDL-C associated with the lowest risk of all cause mortality in the general population.

Design: Prospective cohort study.

Setting: Denmark; the Copenhagen General Population Study recruited in 2003-15 with a median follow-up of 9.4 years.

Participants: Individuals randomly selected from the national Danish Civil Registration System.

Main outcome measures: Baseline levels of LDL-C associated with risk of mortality were evaluated on a continuous scale (restricted cubic splines) and by a priori defined centile categories with Cox proportional hazards regression models. Main outcome was all cause mortality. Secondary outcomes were cause specific mortality (cardiovascular, cancer, and other mortality).

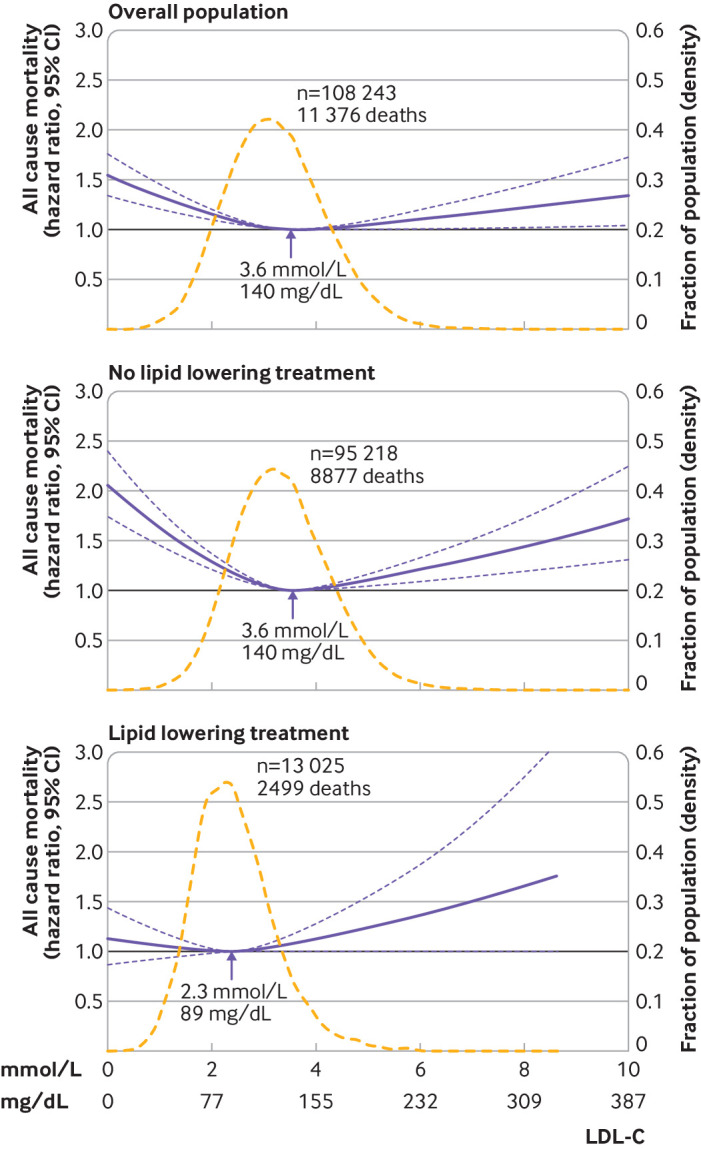
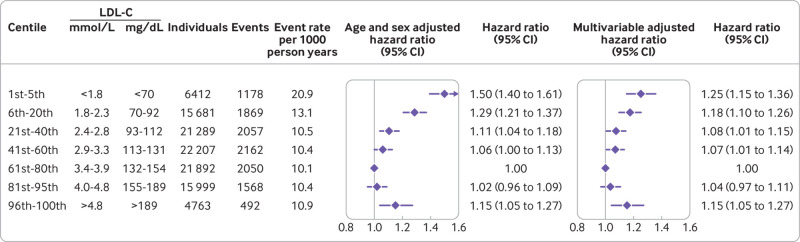
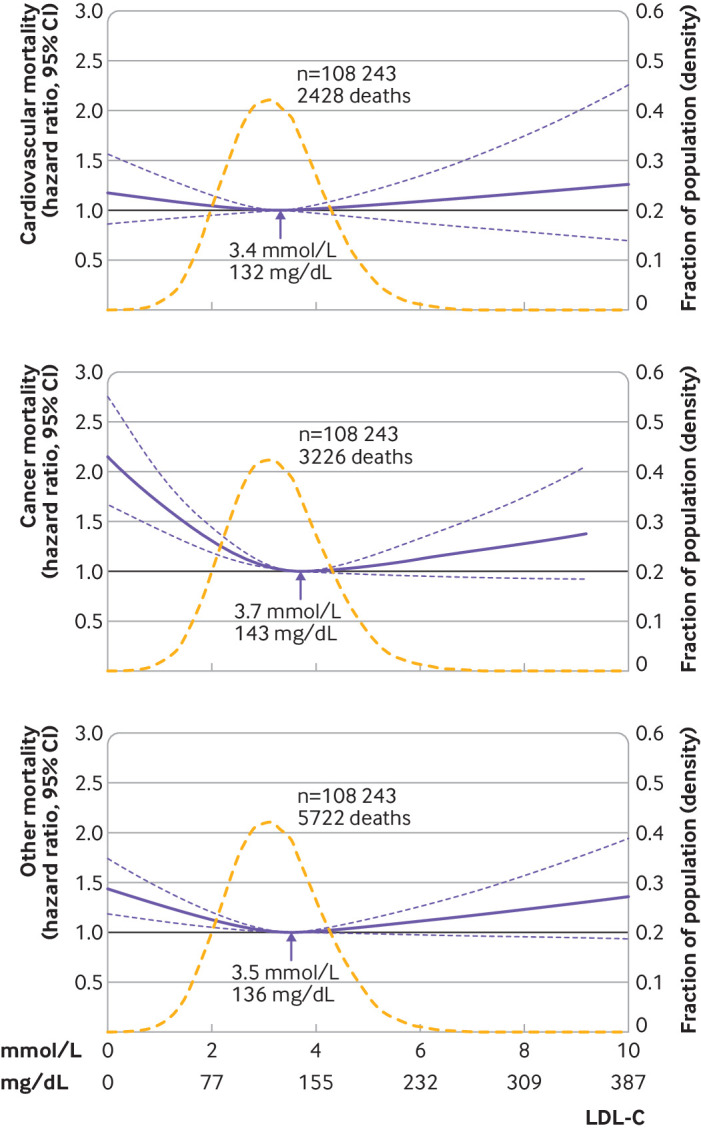
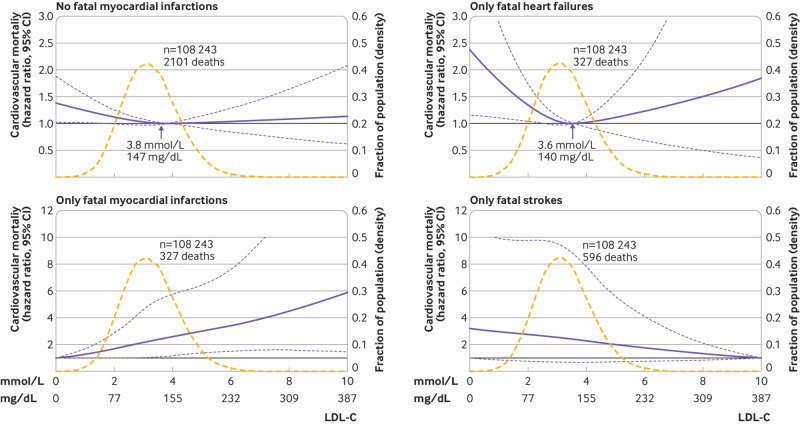
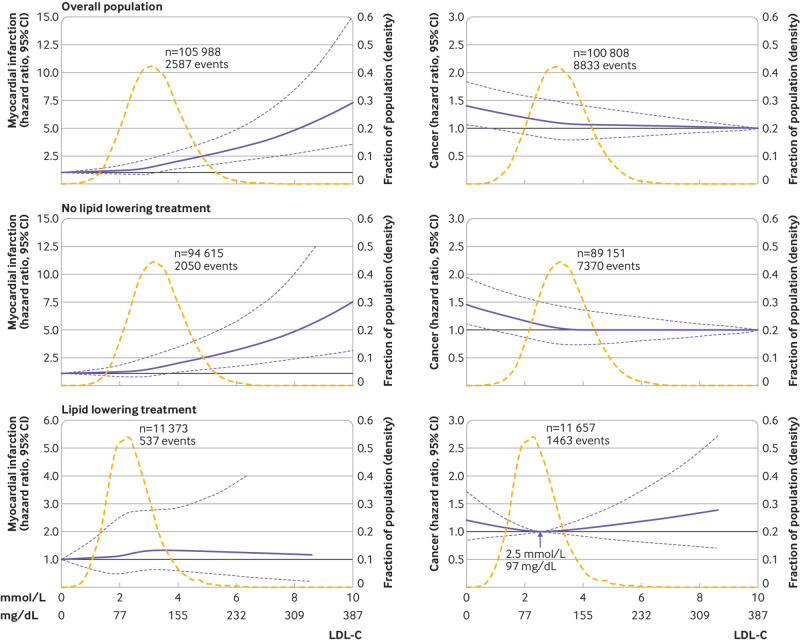
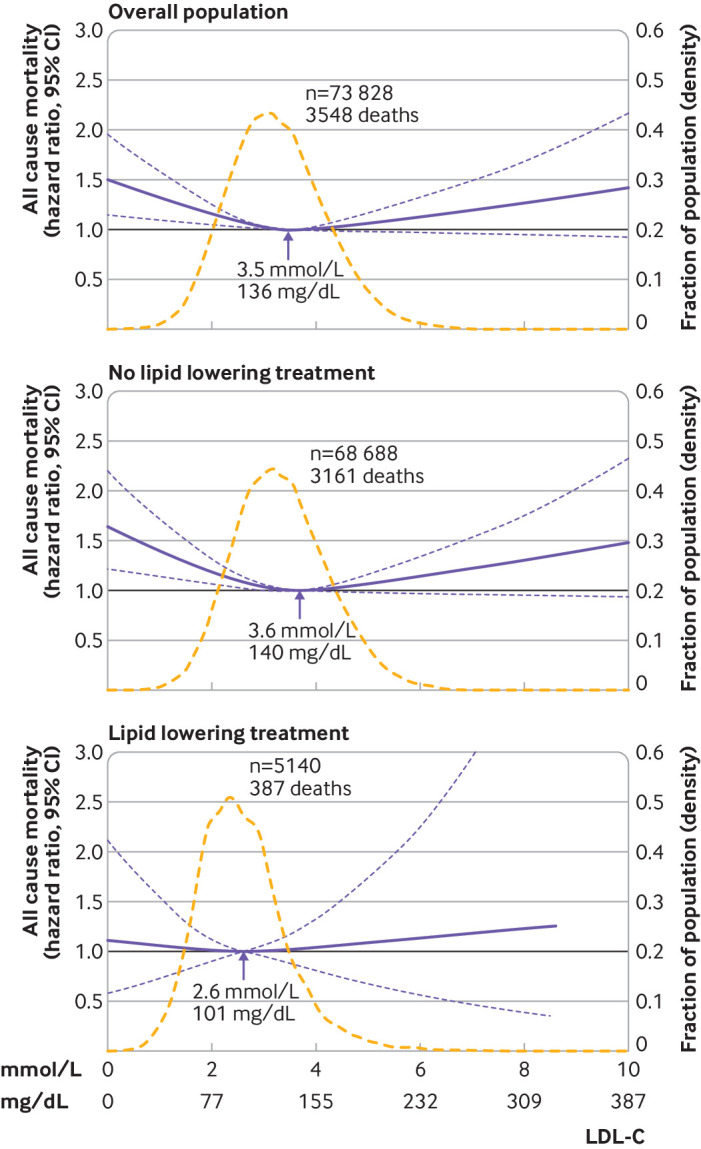
Results: Among 108 243 individuals aged 20-100, 11 376 (10.5%) died during the study, at a median age of 81. The association between levels of LDL-C and the risk of all cause mortality was U shaped, with low and high levels associated with an increased risk of all cause mortality. Compared with individuals with concentrations of LDL-C of 3.4-3.9 mmol/L (132-154 mg/dL; 61st-80th centiles), the multivariable adjusted hazard ratio for all cause mortality was 1.25 (95% confidence interval 1.15 to 1.36) for individuals with LDL-C concentrations of less than 1.8 mmol/L (<70 mg/dL; 1st-5th centiles) and 1.15 (1.05 to 1.27) for LDL-C concentrations of more than 4.8 mmol/L (>189 mg/dL; 96th-100th centiles). The concentration of LDL-C associated with the lowest risk of all cause mortality was 3.6 mmol/L (140 mg/dL) in the overall population and in individuals not receiving lipid lowering treatment, compared with 2.3 mmol/L (89 mg/dL) in individuals receiving lipid lowering treatment. Similar results were seen in men and women, across age groups, and for cancer and other mortality, but not for cardiovascular mortality. Any increase in LDL-C levels was associated with an increased risk of myocardial infarction.

Conclusions: In the general population, low and high levels of LDL-C were associated with an increased risk of all cause mortality, and the lowest risk of all cause mortality was found at an LDL-C concentration of 3.6 mmol/L (140 mg/dL).


Conflict of interest statement

Competing interests: All authors have completed the ICMJE uniform disclosure form at www.icmje.org/coi_disclosure.pdf and declare: support from Herlev and Gentofte Hospital’s Research Fund and the Department of Clinical Biochemistry, Herlev and Gentofte Hospital, Copenhagen University Hospital, Denmark for the submitted work; no financial relationships with any organisations that might have an interest in the submitted work in the previous three years; no other relationships or activities that could appear to have influenced the submitted work.

Figures

Fig 1
Fig 1
Multivariable adjusted hazard ratios for all cause mortality according to levels of low density lipoprotein cholesterol (LDL-C) on a continuous scale. Solid blue lines are multivariable adjusted hazard ratios, with dashed blue lines showing 95% confidence intervals derived from restricted cubic spline regressions with three knots. Reference lines for no association are indicated by the solid bold lines at a hazard ratio of 1.0. Dashed yellow curves show the fraction of the population with different levels of LDL-C. Arrows indicate the concentration of LDL-C with the lowest risk of all cause mortality. Analyses were adjusted for age, sex, current smoking, cumulative number of pack years, systolic blood pressure, lipid lowering treatment, diabetes, cardiovascular disease, cancer, and chronic obstructive pulmonary disease at baseline. Based on individuals from the Copenhagen General Population Study followed for a mean 9.4 years
Fig 2
Fig 2
Hazard ratios for all cause mortality according to categories of levels of low density lipoprotein cholesterol (LDL-C), sex and age adjusted, and multivariable adjusted. Multivariable adjusted analyses were adjusted for age, sex, current smoking, cumulative number of pack years, systolic blood pressure, lipid lowering treatment, diabetes, cardiovascular disease, cancer, and chronic obstructive pulmonary disease at baseline. Based on individuals from the Copenhagen General Population Study followed for a mean 9.4 years
Fig 3
Fig 3
Multivariable adjusted hazard ratios for cause specific mortality according to levels of low density lipoprotein cholesterol (LDL-C) on a continuous scale in the overall population. Solid blue lines are multivariable adjusted hazard ratios, with dashed blues lines showing 95% confidence intervals derived from restricted cubic spline regressions with three knots. Reference lines for no association are indicated by solid bold lines at a hazard ratio of 1.0. Dashed yellow curves show fraction of population with different levels of LDL-C. Arrows indicate the concentration of LDL-C with the lowest risk of mortality. Analyses were adjusted for age, sex, current smoking, cumulative number of pack years, systolic blood pressure, lipid lowering treatment, diabetes, cardiovascular disease, cancer, and chronic obstructive pulmonary disease at baseline. Based on individuals from the Copenhagen General Population Study followed for a mean 9.4 years
Fig 4
Fig 4
Multivariable adjusted hazard ratios for different cardiovascular mortality endpoints according to levels of low density lipoprotein cholesterol (LDL-C) on a continuous scale. Solid blue lines are multivariable adjusted hazard ratios, with dashed blue lines showing 95% confidence intervals derived from restricted cubic spline regressions with three knots. Reference lines for no association are indicated by solid bold lines at a hazard ratio of 1.0. Dashed yellow curves show fraction of population with different levels of LDL-C. Arrows indicate the concentration of LDL-C with the lowest risk of mortality. Analyses were adjusted for age, sex, current smoking, cumulative number of pack years, systolic blood pressure, lipid lowering treatment, diabetes, cardiovascular disease, cancer, and chronic obstructive pulmonary disease at baseline. Based on individuals from the Copenhagen General Population Study followed for a mean 9.4 years
Fig 5
Fig 5
Multivariable adjusted hazard ratios for myocardial infarction and cancer according to levels of low density lipoprotein cholesterol (LDL-C) on a continuous scale. Solid blue lines are multivariable adjusted hazard ratios, with dashed blue lines showing 95% confidence intervals derived from restricted cubic spline regressions, with four knots for myocardial infarction and three knots for cancer. Reference lines for no association are indicated by solid bold lines at a hazard ratio of 1.0. Dashed yellow curves show fraction of population with different levels of LDL-C. Arrow indicates the concentration of LDL-C with the lowest risk of cancer. Analyses were adjusted for age, sex, current smoking, cumulative number of pack years, systolic blood pressure, lipid lowering treatment, diabetes, cardiovascular disease, cancer, and chronic obstructive pulmonary disease at baseline. Based on individuals from the Copenhagen General Population Study followed for a mean 9.4 years
Fig 6
Fig 6
Multivariable adjusted hazard ratios for all cause mortality according to levels of low density lipoprotein cholesterol (LDL-C) on a continuous scale with the start of follow-up at year 5 and after exclusion of individuals with known atherosclerotic cardiovascular disease, cancer, and chronic obstructive pulmonary disease at baseline. Solid blue lines are multivariable adjusted hazard ratios, with dashed blue lines showing 95% confidence intervals derived from restricted cubic spline regressions with three knots. Reference lines for no association are indicated by solid bold lines at a hazard ratio of 1.0. Dashed yellow curves show fraction of population with different levels of LDL-C. Arrows indicate the concentration of LDL-C with the lowest risk of all cause mortality. Analyses were adjusted for age, sex, current smoking, cumulative number of pack years, systolic blood pressure, lipid lowering treatment, diabetes, cardiovascular disease, cancer, and chronic obstructive pulmonary disease at baseline. Based on individuals from the Copenhagen General Population Study followed for a mean 9.4 years

References

    1. Ference BA, Ginsberg HN, Graham I, et al. Low-density lipoproteins cause atherosclerotic cardiovascular disease. 1. Evidence from genetic, epidemiologic, and clinical studies. A consensus statement from the European Atherosclerosis Society Consensus Panel. Eur Heart J 2017;38:2459-72. 10.1093/eurheartj/ehx144 - DOI - PMC - PubMed
    1. Baigent C, Keech A, Kearney PM, et al. Cholesterol Treatment Trialists’ (CTT) Collaborators Efficacy and safety of cholesterol-lowering treatment: prospective meta-analysis of data from 90,056 participants in 14 randomised trials of statins. Lancet 2005;366:1267-78. 10.1016/S0140-6736(05)67394-1 - DOI - PubMed
    1. Baigent C, Blackwell L, Emberson J, et al. Cholesterol Treatment Trialists’ (CTT) Collaboration Efficacy and safety of more intensive lowering of LDL cholesterol: a meta-analysis of data from 170,000 participants in 26 randomised trials. Lancet 2010;376:1670-81. 10.1016/S0140-6736(10)61350-5 - DOI - PMC - PubMed
    1. Navarese EP, Robinson JG, Kowalewski M, et al. Association between baseline LDL-C level and total and cardiovascular mortality after LDL-C lowering: a systematic review and meta-analysis. JAMA 2018;319:1566-79. 10.1001/jama.2018.2525 - DOI - PMC - PubMed
    1. Schupf N, Costa R, Luchsinger J, Tang MX, Lee JH, Mayeux R. Relationship between plasma lipids and all-cause mortality in nondemented elderly. J Am Geriatr Soc 2005;53:219-26. 10.1111/j.1532-5415.2005.53106.x - DOI - PubMed

Substances