. 2020 Dec 22;117(51):32348-32357.
doi: 10.1073/pnas.2011224117. Epub 2020 Dec 8.

Dynamics of RNA polymerase II and elongation factor Spt4/5 recruitment during activator-dependent transcription

Affiliations

Dynamics of RNA polymerase II and elongation factor Spt4/5 recruitment during activator-dependent transcription

Grace A Rosen et al. Proc Natl Acad Sci U S A. .

Abstract

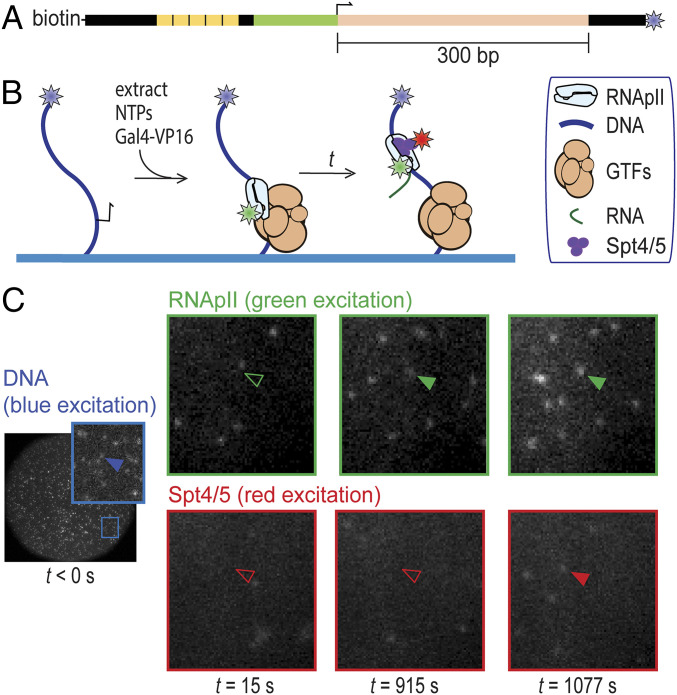
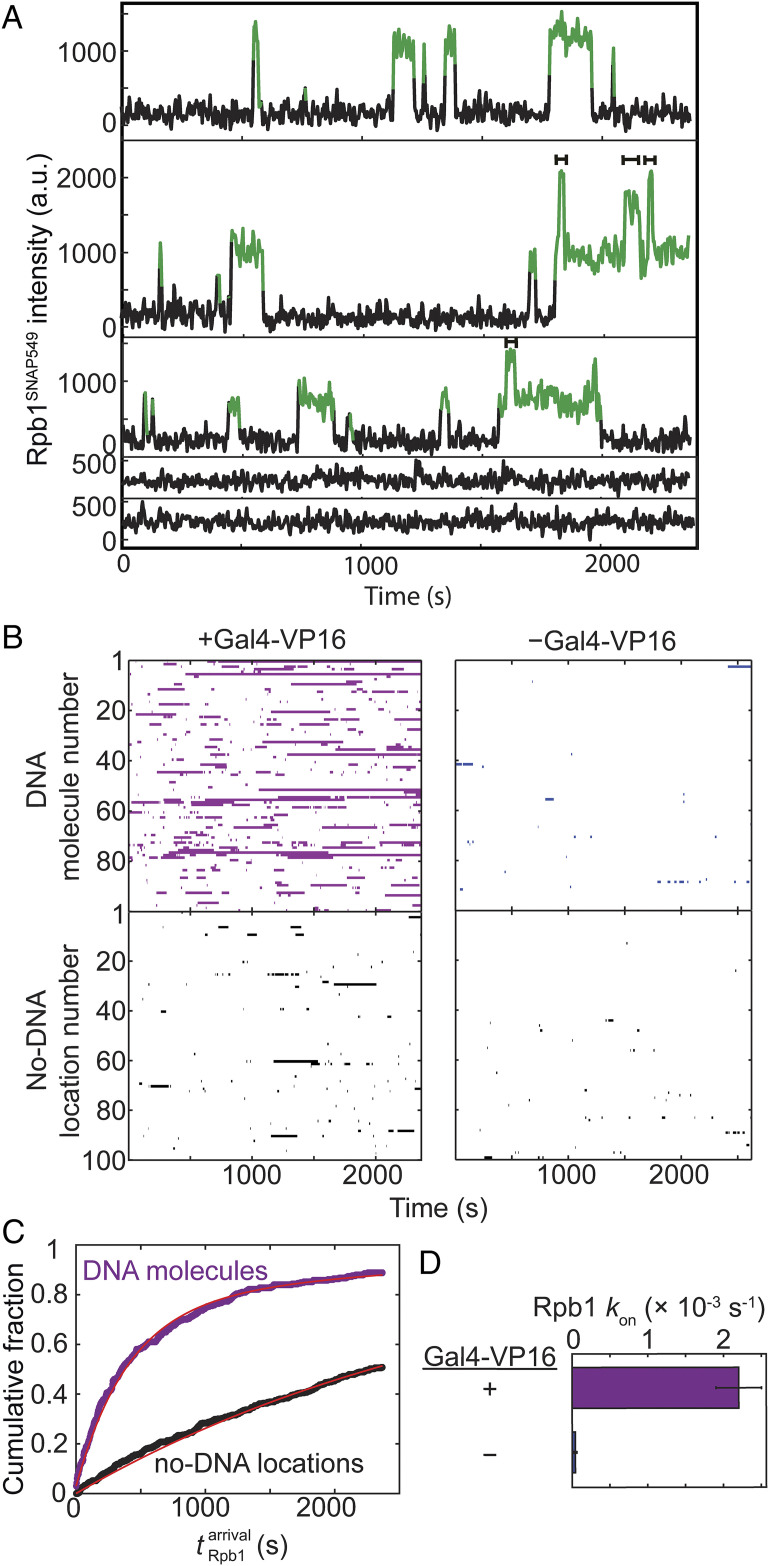
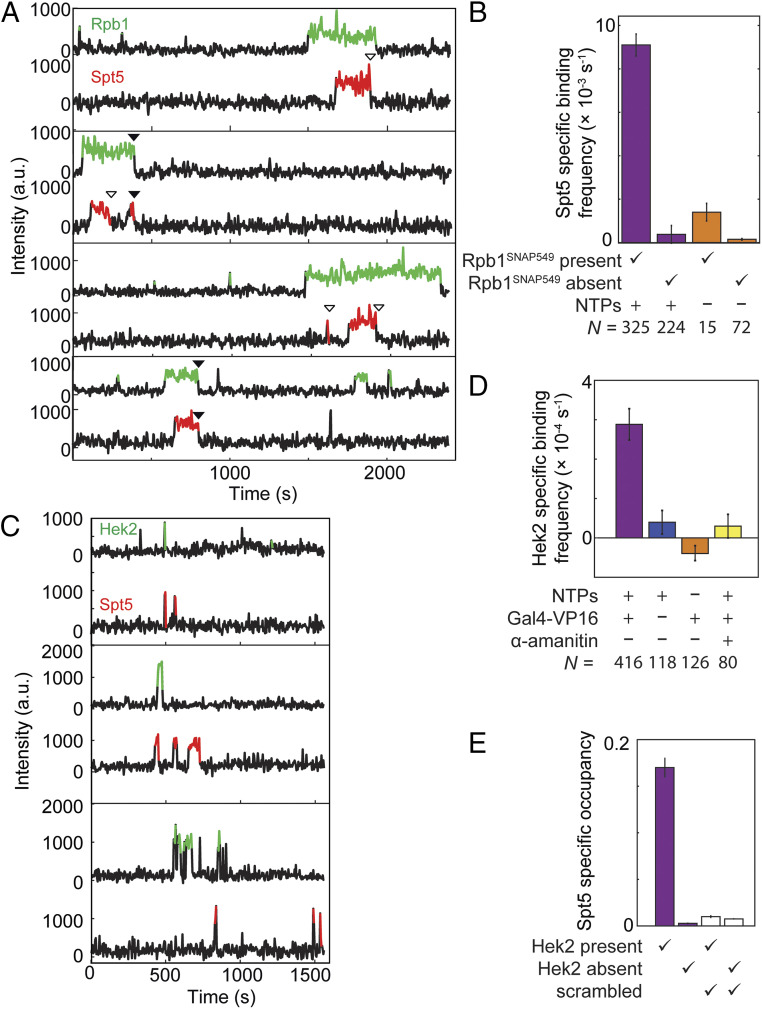
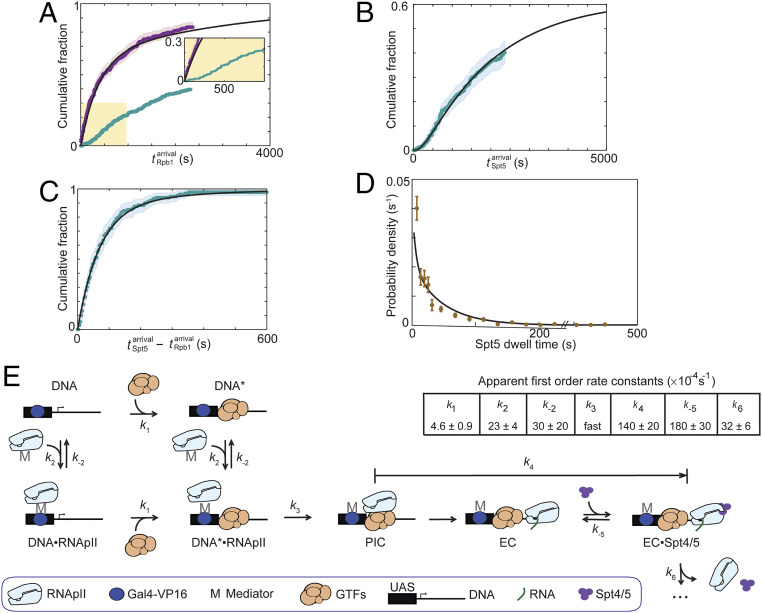
In eukaryotes, RNA polymerase II (RNApII) transcribes messenger RNA from template DNA. Decades of experiments have identified the proteins needed for transcription activation, initiation complex assembly, and productive elongation. However, the dynamics of recruitment of these proteins to transcription complexes, and of the transitions between these steps, are poorly understood. We used multiwavelength single-molecule fluorescence microscopy to directly image and quantitate these dynamics in a budding yeast nuclear extract that reconstitutes activator-dependent transcription in vitro. A strong activator (Gal4-VP16) greatly stimulated reversible binding of individual RNApII molecules to template DNA. Binding of labeled elongation factor Spt4/5 to DNA typically followed RNApII binding, was NTP dependent, and was correlated with association of mRNA binding protein Hek2, demonstrating specificity of Spt4/5 binding to elongation complexes. Quantitative kinetic modeling shows that only a fraction of RNApII binding events are productive and implies a rate-limiting step, probably associated with recruitment of general transcription factors, needed to assemble a transcription-competent preinitiation complex at the promoter. Spt4/5 association with transcription complexes was slowly reversible, with DNA-bound RNApII molecules sometimes binding and releasing Spt4/5 multiple times. The average Spt4/5 residence time was of similar magnitude to the time required to transcribe an average length yeast gene. These dynamics suggest that a single Spt4/5 molecule remains associated during a typical transcription event, yet can dissociate from RNApII to allow disassembly of abnormally long-lived (i.e., stalled) elongation complexes.

Keywords: CoSMoS; Gal4-VP16; Saccharomyces cerevisiae.


Conflict of interest statement

The authors declare no competing interest.

Figures

Fig. 1.
Fig. 1.
Detection of RNApII and Spt4/5 binding to individual surface-tethered DNA488 molecules in Rpb1SNAP549/Spt5DHFR-Cy5 S. cerevisiae nuclear extract. (A) Schematic of DNA488 transcription template. This DNA contains five upstream Gal4 binding sites (yellow) and the CYC1 core promoter (green) with its transcription start site (bent arrow), followed by a 300-bp cassette (pink) encoding a G-less RNA. The template has attached biotin and AF488 dye (blue star) moieties. (B) Experimental scheme. DNA488 molecules immobilized on the surface of a flow chamber (blue) were at time t = 0 incubated with yeast nuclear extract containing dye (stars)-labeled proteins Rpb1SNAP549 and Spt5DHFR-Cy5 along with unlabeled general transcription factors (GTFs) and other nuclear proteins. Reactions were supplemented with recombinant Gal4-VP16 activator. RNApII and Spt4/5 binding to DNA were detected as colocalization of spots of green- and red-excited fluorescence at locations of blue-excited DNA spots. (C) Images of the same microscope field of view (65 × 65 µm) in the red-, green-, and blue-excited fluorescence channels taken at various times before (blue) and after (red and green) extract addition at time t = 0. Insets show magnified views of the marked region. Absence or presence of a spot of fluorescence colocalized with a particular DNA molecule are shown by open and filled arrowheads, respectively.
Fig. 2.
Fig. 2.
Kinetics of RNApII association with promoter DNA in the experiment shown in Fig. 1. (A) Example time records showing Rpb1SNAP549 fluorescence colocalized at the positions of three different single DNA488 molecules (Top three records) and two control locations without visible DNA488 molecules (Bottom two). Green points designate times at which there was a colocalized spot of Rpb1SNAP549 fluorescence as detected by an objective spot-recognition algorithm (60). Brackets mark time intervals during which more than one Rpb1SNAP549 molecule was present. (B) Rastergrams of Rpb1SNAP549 colocalization at the locations of 100 randomly selected DNA488 molecules (Top) and 100 randomly selected control no-DNA locations (Bottom) from the same recording. Each horizontal line of the plot is data from a single location showing times with (colored bars) or without (white space) a colocalized Rpb1SNAP549 fluorescent spot. Data are from the experiment of Fig. 1 (purple) plus a negative control experiment in which no Gal4-VP16 activator was added (blue). (C) Cumulative distribution of the time intervals prior to the first Rpb1SNAP549 association seen on each DNA488 molecule (purple) and at no-DNA488 control locations (black) in the presence of Gal4-VP16, along with fits (red) to an exponential binding model (a single rate-limiting step). Parameters of this and analogous fits to the negative control and the numbers of observations for all fits are given in SI Appendix, Table S1. (D) Apparent first-order rate constants (± SE) for Rpb1 association with template DNA derived from the model fits.
Fig. 3.
Fig. 3.
Correlation of Spt4/5 binding at individual DNA molecules with binding of RNApII (A and B) or Hek2 (CE). (A) Example time records of Rpb1SNAP549 and Spt5DHFR-Cy5 fluorescence at four individual DNA488 locations, taken from the Rpb1SNAP549/Spt5DHFR-Cy5 experiment shown in Fig. 1. Colored intervals indicate times at which a fluorescent Rpb1SNAP549 (green) and/or Spt5DHFR-Cy5 (red) spot colocalized to the DNA488 molecule being monitored. Each Spt5DHFR-Cy5 departure is marked according to whether it occurred before (open triangles) or simultaneously with (closed triangles) Rpb1SNAP549 departure. Additional example records are shown in SI Appendix, Fig. S3. (B) DNA-specific binding frequencies (± SE) of Spt5DHFR-Cy5, calculated separately for time intervals when Rpb1SNAP549 was present or absent at the DNA. DNA-specific binding frequency is calculated as the frequency seen at DNA locations that is in excess of the background nonspecific binding seen at no-DNA locations. (C) Examples of time records of Hek2SNAP549 and Spt5DHFR-Cy5 fluorescence over time at three individual DNA488 locations taken from an experiment using a dual-tagged Hek2SNAP549/Spt5DHFR-Cy5 yeast nuclear extract in the presence of NTPs and Gal4-VP16. (D) DNA-specific binding frequencies (± SE) of Hek2SNAP549 under transcription conditions (purple) and in negative controls (blue, orange, and yellow); see SI Appendix, Table S3. (E) Mean fraction (± SEM) of time that a DNA488 molecule had a colocalized Spt5DHFR-Cy5, after correction for nonspecific surface binding. Separate analyses were conducted for time points at which Hek2SNAP549 was present or absent (SI Appendix, Table S4). Data may underestimate the true occupancy of DNA locations by Spt4/5 due to possible incomplete labeling of Spt5DHFR-Cy5, but this factor is constant across all four bars. Open bars show results of a scrambled negative control analysis of the same data (SI Appendix, Materials and Methods) showing that the correlation of Spt5 binding with Hek2 binding is not a statistical artifact. Data in D (purple bar) and E are aggregated from the experiment in C and one additional replicate.
Fig. 4.
Fig. 4.
RNApII and Spt4/5 binding dynamics during activated transcription initiation in Rpb1SNAP549/Spt5DHFR-Cy5 extract. (A) Cumulative distribution of n = 268 time intervals measured from the addition of extract (t = 0) until the first Rpb1SNAP549 binding was observed at each DNA molecule. Separate curves show the distributions for all Rpb1SNAP549 first binding events (purple; same data as in Fig. 2C); and for the n = 129 first productive events (i.e., the first Rpb1SNAP549 binding event during which Spt5DHFR-Cy5 was also seen to bind) (turquoise). Inset: Magnified view. (B) Cumulative distribution of n = 129 time intervals from addition of extract until Spt5DHFR-Cy5 binding in the first productive events. (C) Cumulative distribution of n = 129 time differences between the first Spt5DHFR-Cy5 binding and Rpb1SNAP549 binding in the first productive events. Note expanded time scale compared to A and B. Shading in AC indicates 95% confidence interval. (D) Distribution (probability density ± SE) of Spt5DHFR-Cy5 dwell times during productive binding events (brown; n = 312). (E) Minimal kinetic scheme consistent with the data in AD and the rate constants determined by globally fitting those data to the scheme. Complexes represented in the schematics are plausible suggestions but are not intended to convey conclusive details of molecular structures or interactions. In the scheme shown, RNApII can bind either at the upstream Gal4 binding sites (UAS), presumed to be via an indirect interaction through Mediator and Gal4-VP16, or at the promoter, presumed to require a minimal set of RNApII general transcription factors (GTFs). Arrows represent the rate-limiting step in each transformation; additional non-rate-limiting processes are not shown and are ignored in the quantitative modeling. Rate constants k1, k2, k−2, and k4 were determined by global fitting of the model to data underlying AC, and k−5 and k6 by fitting to the data underlying D and the measured partition ratio (SI Appendix, Materials and Methods). k3 was fixed to a value (1 s−1) faster than the experimental time resolution because the data show no evidence for a rate limitation by this step. For simplicity, this illustration does not show steps in which Rpb1SNAP549 or Spt5DHFR-Cy5 molecules bound nonspecifically to the slide surface, but these kinetic processes (SI Appendix, Fig. S7) were included in the determination of the rate constants shown. Black lines in AD show the distributions calculated from the model using the rate constant values in E.

Similar articles

Cited by

References

    1. Thomas M. C., Chiang C. M., The general transcription machinery and general cofactors. Crit. Rev. Biochem. Mol. Biol. 41, 105–178 (2006). - PubMed
    1. Sikorski T. W., Buratowski S., The basal initiation machinery: Beyond the general trancription factors. Curr. Opin. Chem. Biol. 21, 344–351 (2010). - PMC - PubMed
    1. Luse D. S., The RNA polymerase II preinitiation complex. Through what pathway is the complex assembled? Transcription 5, e27050 (2014). - PMC - PubMed
    1. Mayer A., et al. , Uniform transitions of the general RNA polymerase II transcription complex. Nat. Struct. Mol. Biol. 17, 1272–1278 (2010). - PubMed
    1. Vos S. M., et al. , Structure of activated transcription complex Pol II-DSIF-PAF-SPT6. Nature 560, 607–612 (2018). - PubMed

Publication types

MeSH terms

Substances

LinkOut - more resources