. 2021 Jan 6;8(1):ENEURO.0257-20.2020.
doi: 10.1523/ENEURO.0257-20.2020. Print 2021 Jan-Feb.

Calmodulin Bidirectionally Regulates Evoked and Spontaneous Neurotransmitter Release at Retinal Ribbon Synapses

Affiliations

Calmodulin Bidirectionally Regulates Evoked and Spontaneous Neurotransmitter Release at Retinal Ribbon Synapses

Chao-Qun Liang et al. eNeuro. .

Abstract

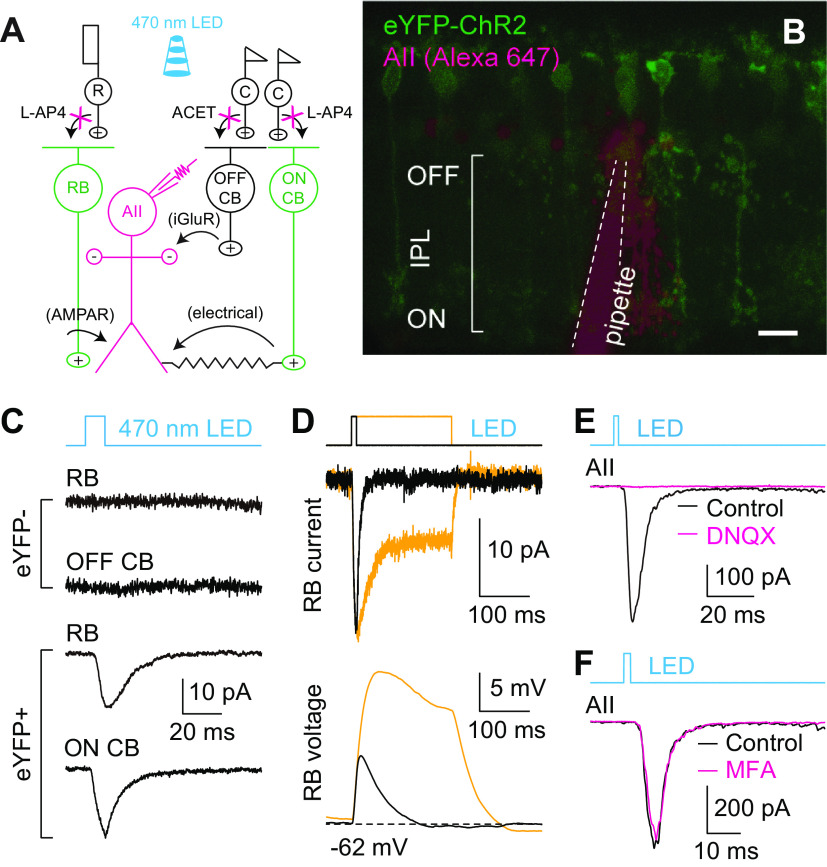
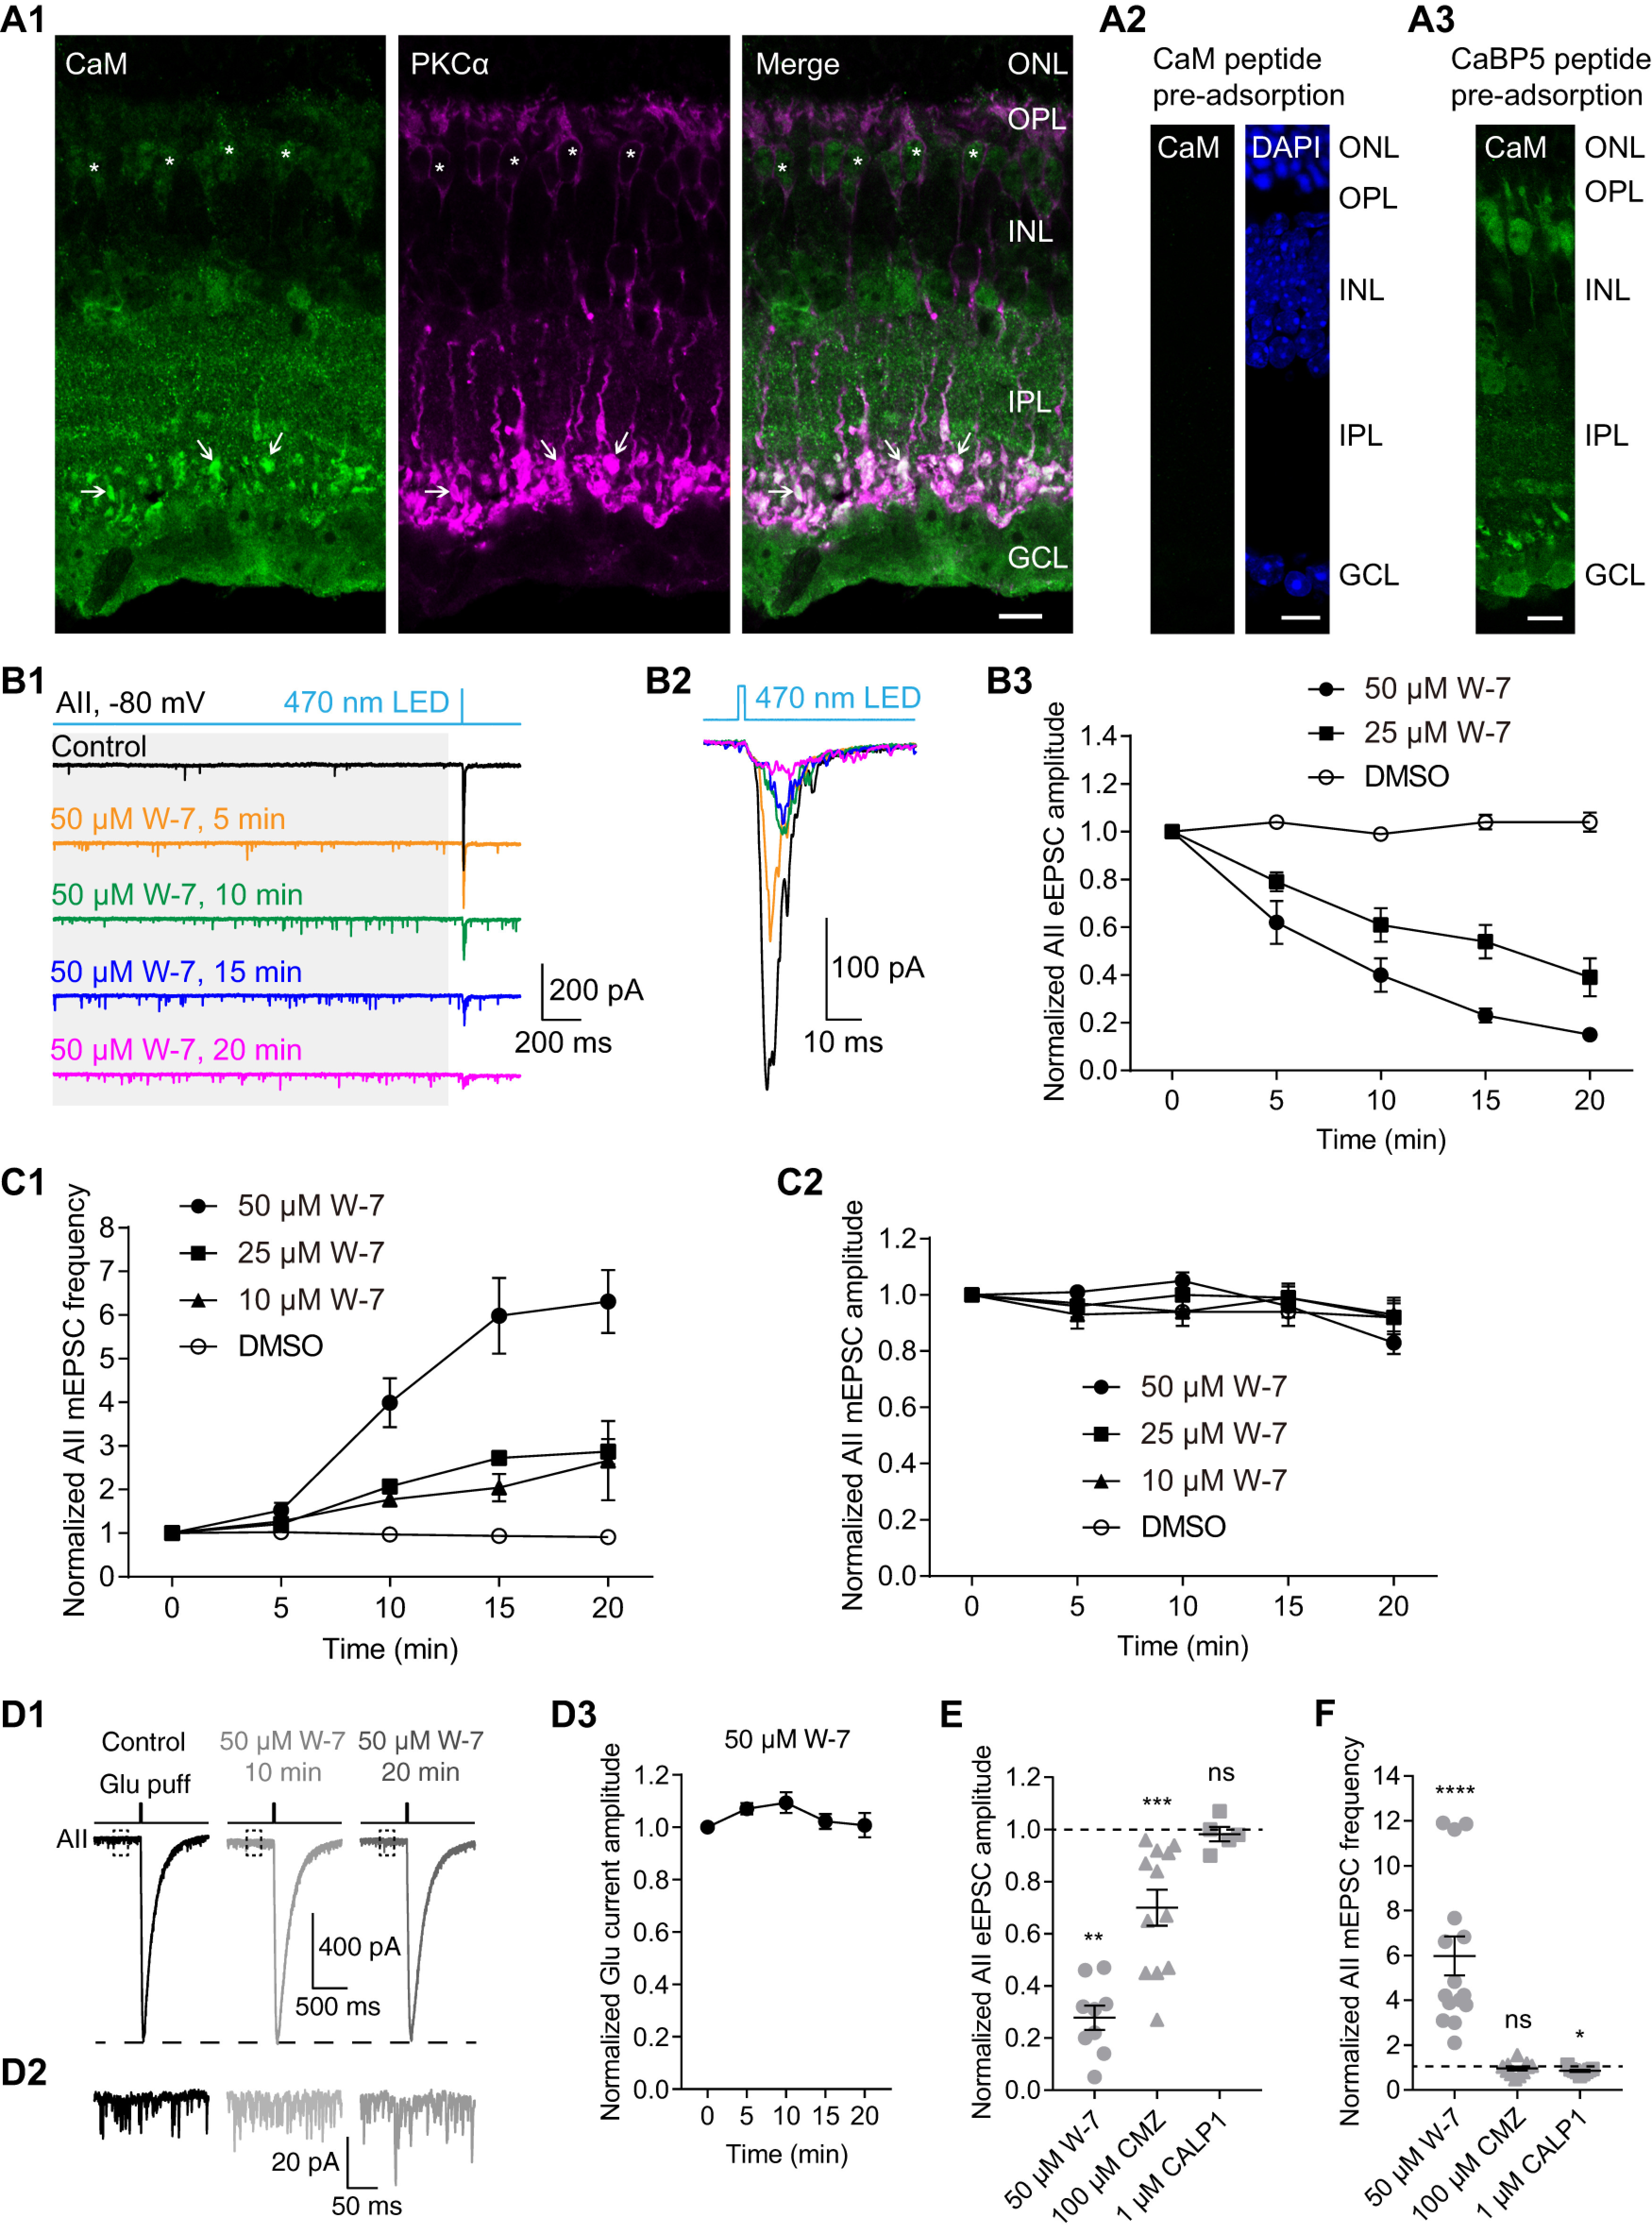
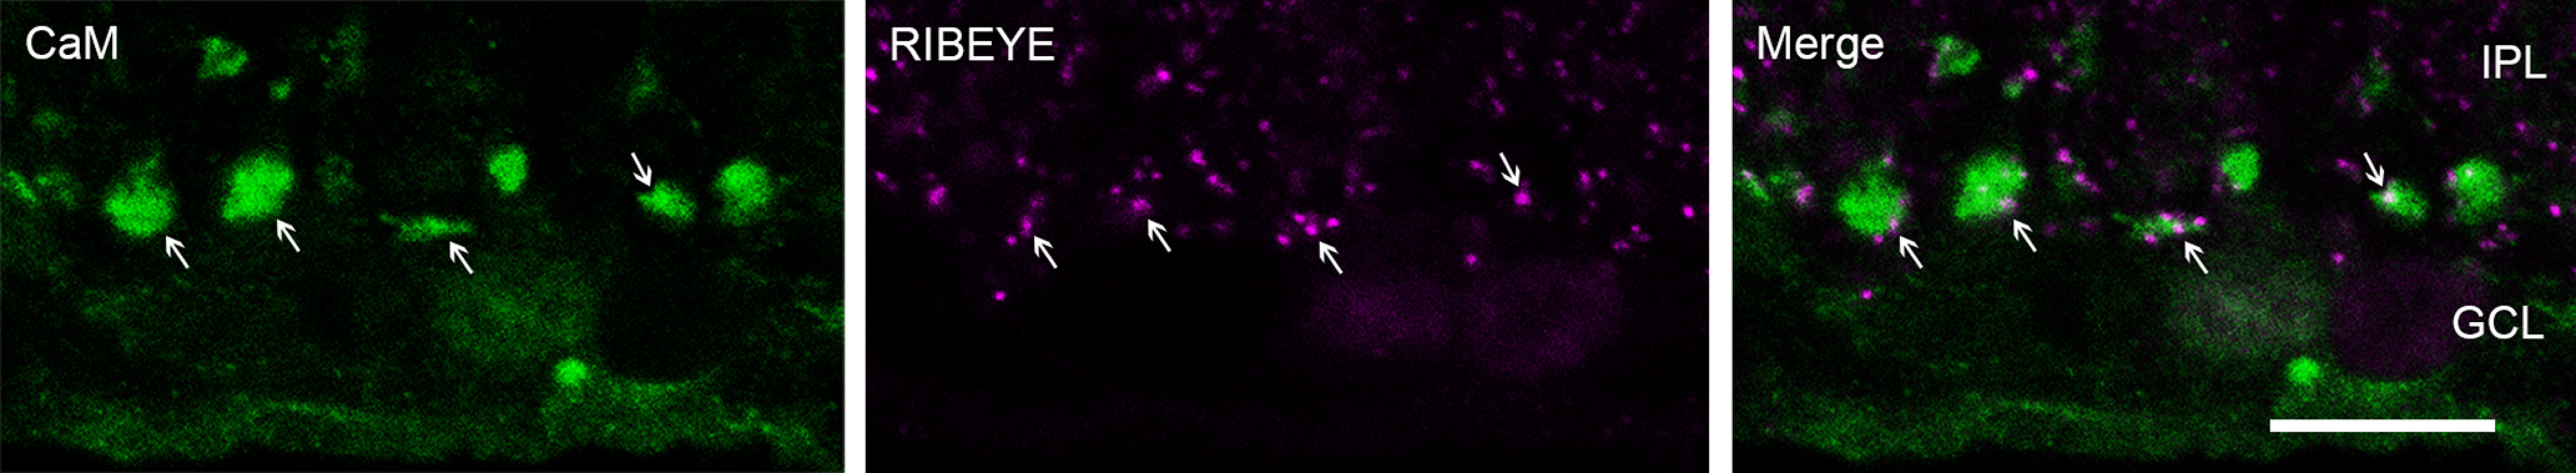
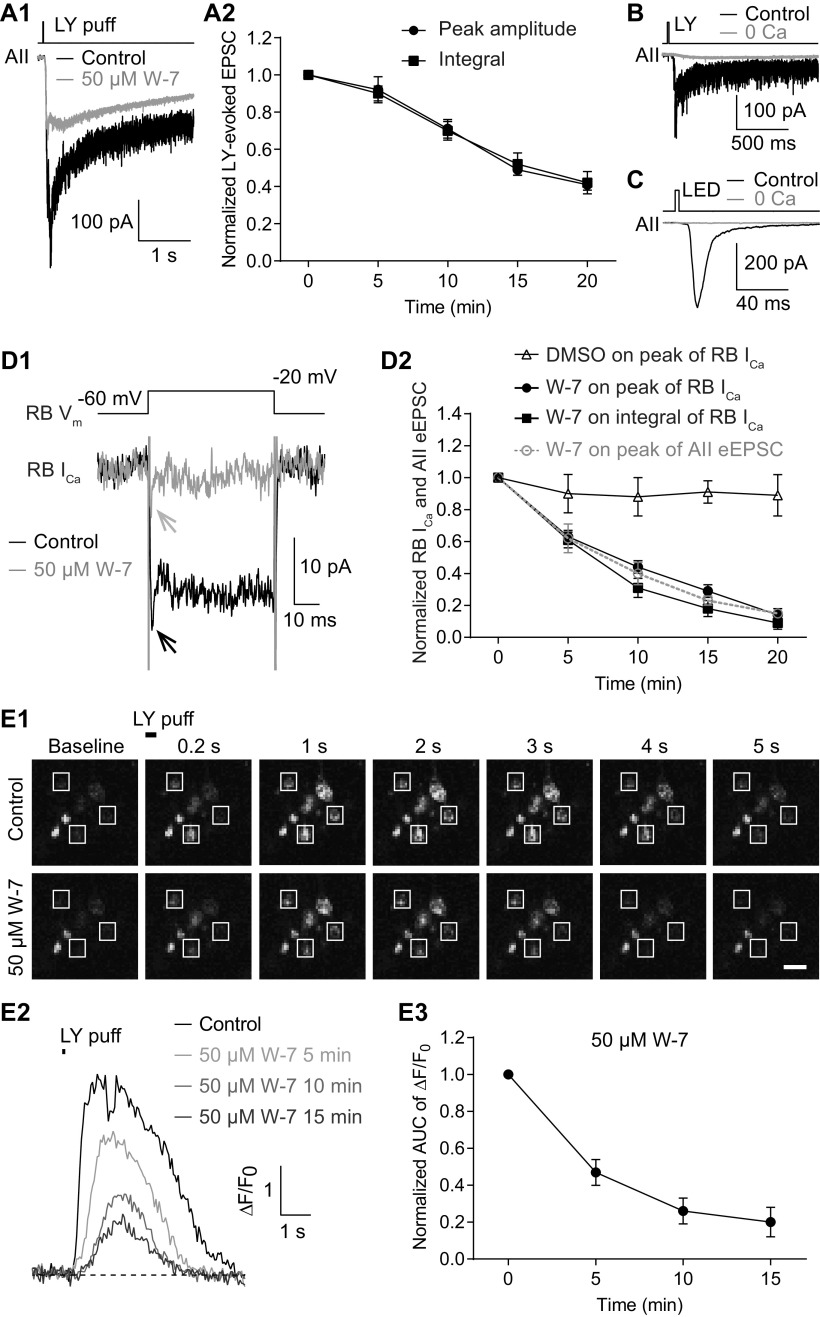
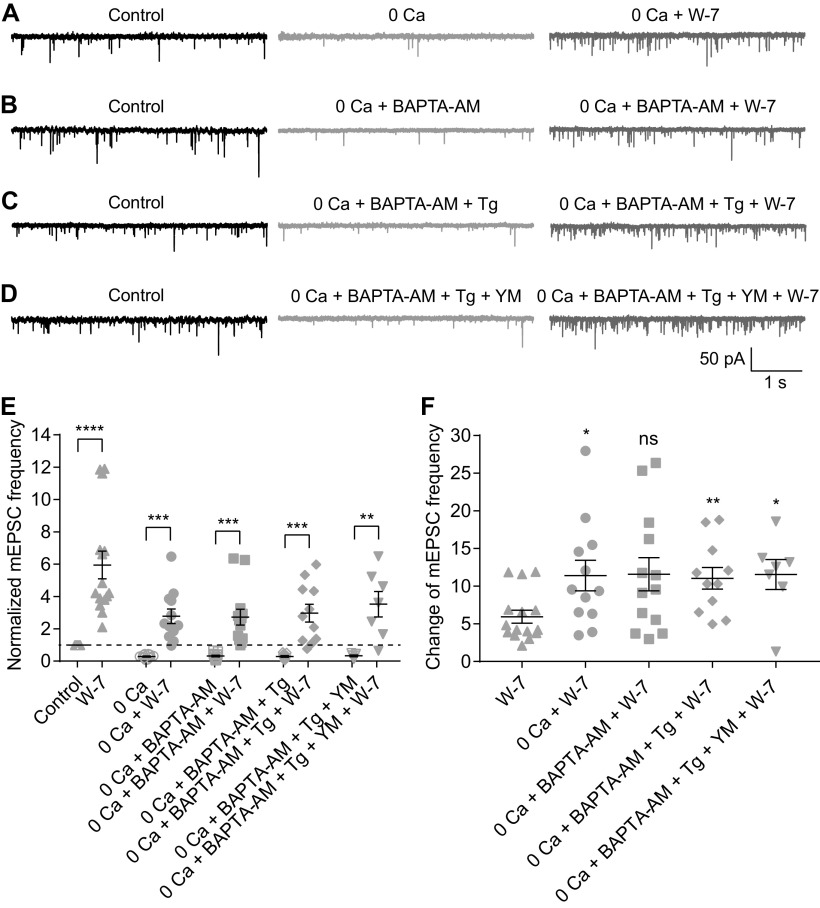
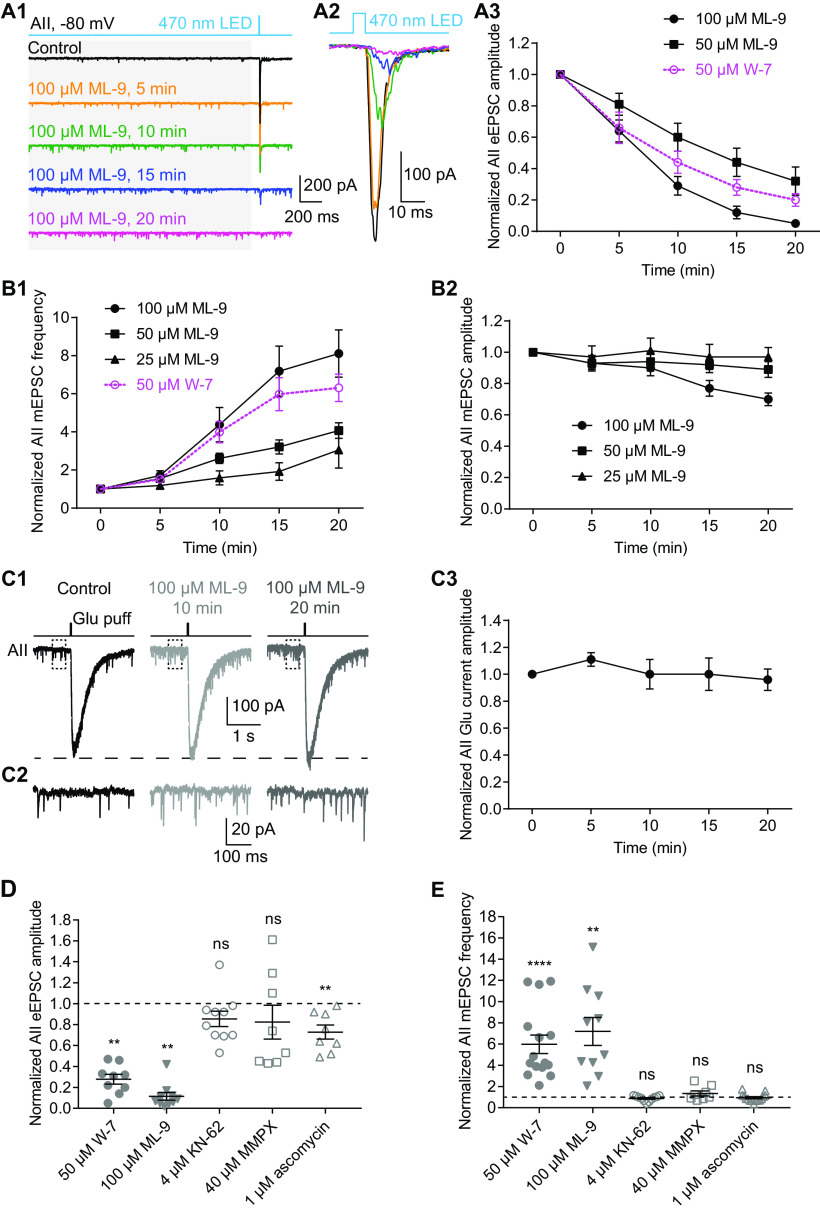
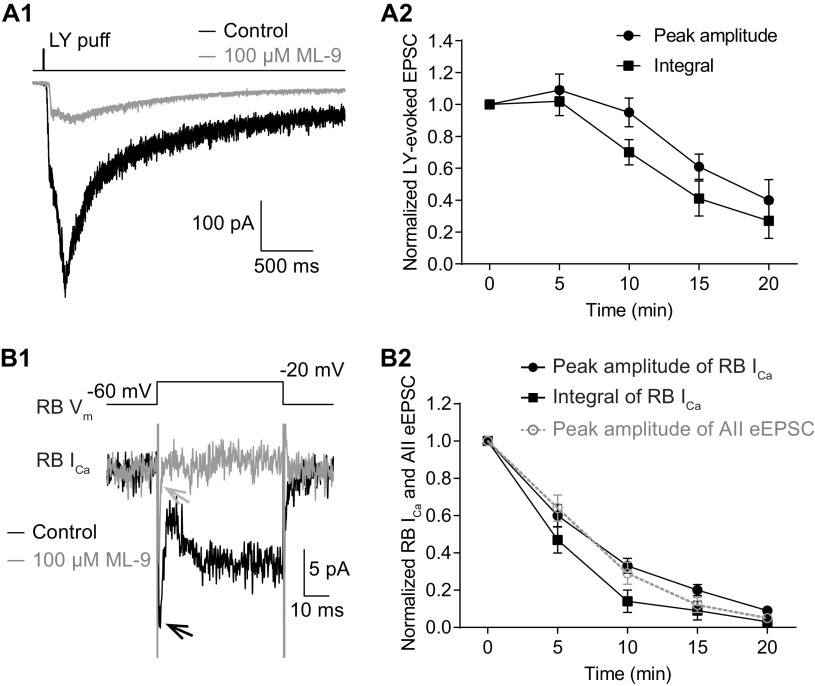
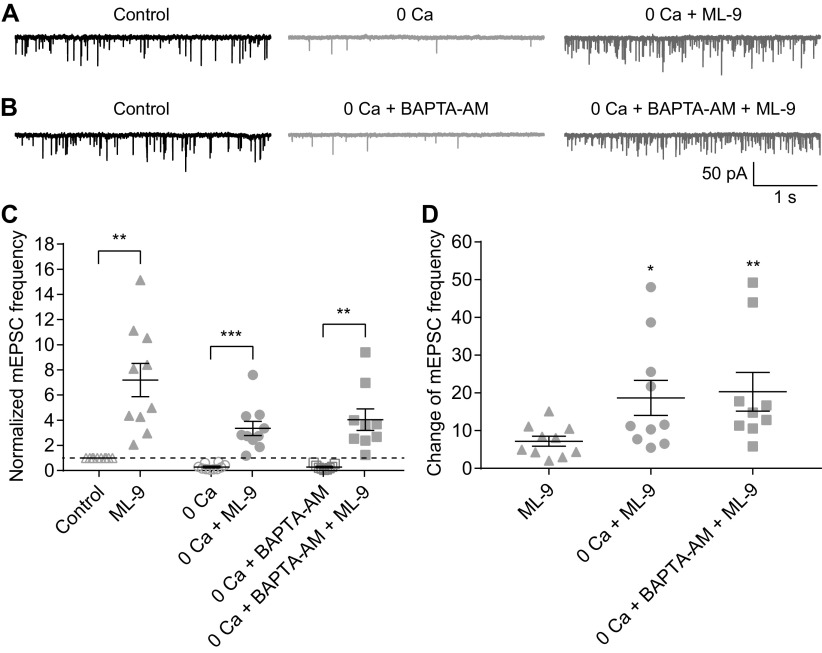
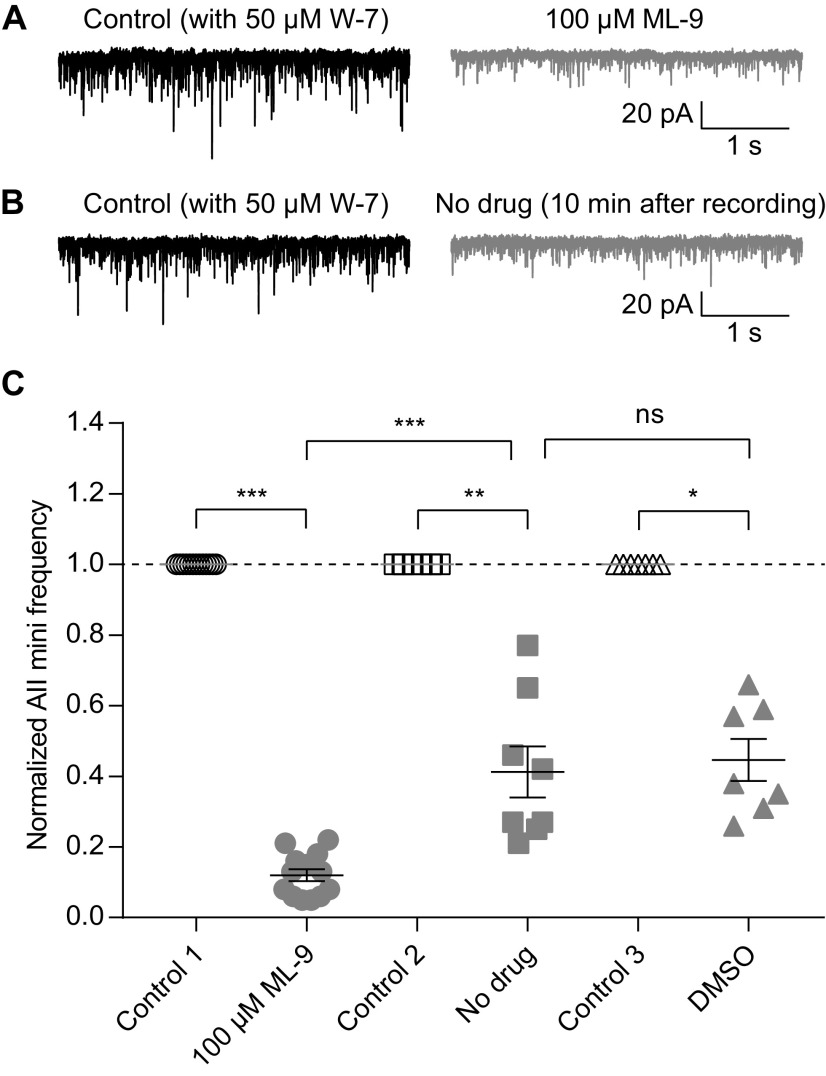
For decades, a role for the Ca2+-binding protein calmodulin (CaM) in Ca2+-dependent presynaptic modulation of synaptic transmission has been recognized. Here, we investigated the influence of CaM on evoked and spontaneous neurotransmission at rod bipolar (RB) cell→AII amacrine cell synapses in the mouse retina. Our work was motivated by the observations that expression of CaM in RB axon terminals is extremely high and that [Ca2+] in RB terminals normally rises sufficiently to saturate endogenous buffers, making tonic CaM activation likely. Taking advantage of a model in which RBs can be stimulated by expressed channelrhodopsin-2 (ChR2) to avoid dialysis of the presynaptic terminal, we found that inhibition of CaM dramatically decreased evoked release by inhibition of presynaptic Ca channels while at the same time potentiating both Ca2+-dependent and Ca2+-independent spontaneous release. Remarkably, inhibition of myosin light chain kinase (MLCK), but not other CaM-dependent targets, mimicked the effects of CaM inhibition on evoked and spontaneous release. Importantly, initial antagonism of CaM occluded the effect of subsequent inhibition of MLCK on spontaneous release. We conclude that CaM, by acting through MLCK, bidirectionally regulates evoked and spontaneous release at retinal ribbon synapses.

Keywords: AII amacrine cell; calmodulin; myosin light chain kinase; neurotransmitter release; retinal rod bipolar cell; ribbon synapse.


Figures

Figure 1.
Figure 1.
Optogenetic study of transmission at RB→AII synapses. A, A diagram illustrating optogenetic study of synaptic transmission between RB cells and AII amacrine cells in the retinas of Pcp2-cre::Ai32 mice. After synaptic transmission between photoreceptors and bipolar cells is blocked with L-AP4 and ACET, 470-nm light flashes could stimulate light-sensitive ChR2 channels and thus directly activate ChR2-eYFP-expressing RBs and ON CB cells (green), and finally evoked responses in postsynaptic AII amacrine cells (magenta) could be recorded. B, A two-photon image showing ChR2-eYFP expression (green) in a retinal slice made from a Pcp2-cre::Ai32 mouse; an AII amacrine cell (magenta) was recorded and filled with Alexa Fluor 647 by a patch pipette (outlined by dashed lines). Scale bar: 10 μm. C, Representative traces showing ChR2-mediated currents recorded in an eYFP+ RB and an eYFP+ ON CB, but not in either eYFP– RB or eYFP– OFF CB, during brief flashes of 470-nm LED. Vhold = −60 mV. D, Representative traces showing ChR2-mediated current (voltage-clamp mode; Vhold = −60 mV) and membrane potential (voltage; current-clamp mode) changes recorded in an eYFP+ RB during brief (10 ms) and long (200 ms) light stimuli. E, During brief flashes, the eEPSCs recorded in AII amacrine cells postsynaptic to RBs were blocked almost completely by DNQX (20 μm). F, The eEPSCs recorded during brief flashes were only slightly influenced by the gap junction blocker, MFA (100 μm).
Figure 2.
Figure 2.
CaM bidirectionally regulates evoked and spontaneous neurotransmitter release from RBs. A1, Confocal images showing immunofluorescence double labeling of CaM (green) and PKCα (magenta), a specific cell marker of RBs, in a frozen retinal slice. In the merged image (green + magenta), expression of CaM could be clearly seen in the axon terminals (arrow) and somata (asterisk) of RBs. Scale bar: 10 μm. ONL: outer nuclear layer; OPL: outer plexiform layer; INL: inner nuclear layer; IPL: inner plexiform layer; GCL: ganglion cell layer. A2, No labeling was observed in the negative control where the anti-CaM antibody was preincubated with the CaM immunopeptide. DAPI staining showed the three major cell body layers in the retina. Scale bar: 10 μm. A3, Preadsorption of the anti-CaM antibody with the CaBP5 immunopeptide did not change the staining pattern for CaM. Scale bar: 10 μm. B1, Two-millisecond flashes of 470-nm LED were presented to stimulate ChR2 in Pcp2-cre::Ai32 mice with L-AP4 and ACET in the bath to block synaptic transmission between photoreceptors and bipolar cells; all the inhibitory connections were also blocked. The evoked responses (eEPSCs) and the small responses induced by spontaneous release before light onset (mEPSCs; see gray background area) in AII amacrine cells were recorded. Vhold = −80 mV. Individual traces showed that the CaM antagonist, W-7 (50 μm) strongly increased mEPSC frequency and reduced eEPSC amplitude. B2, Average traces of eEPSCs recorded in the same AII in B1. B3, Statistics of the effects of 25 μm (n = 6) and 50 μm (n = 9) W-7 on eEPSC amplitude. The amplitudes were normalized to the amplitude at time 0 in each cell before averaging across cells. C1, Statistics of the effects of 10 μm (n = 8), 25 μm (n = 13), and 50 μm (n = 15) W-7 on mEPSC frequency. The frequencies were normalized to the frequency at time 0 in each cell before averaging across cells. C2, Statistics of the effects of 10 μm (n = 8), 25 μm (n = 13), and 50 μm (n = 15) W-7 on mEPSC amplitude. The amplitudes were normalized to the amplitude at time 0 in each cell before averaging across cells. D1, Individual traces showing that W-7 (50 μm) had no inhibitory effect on AMPA receptor-mediated currents recorded in an AII evoked by glutamate (1 mm) applied onto the AII dendrites at the border of the IPL and GCL. Vhold = −80 mV. D2, Magnification of the traces in the dashed line frames of D1, showing increase of mEPSC frequency by W-7. D3, Statistics of the effects of 50 μm W-7 (n = 7) on the amplitude of glutamate-evoked currents. The amplitudes were normalized to the amplitude at time 0 in each cell before averaging across cells. E, Summary data showing the effects of 50 μm W-7 (circles), 100 μm CMZ (triangles), another CaM antagonist, and 1 μm CALP1 (squares), a CaM agonist, on eEPSC amplitude after bath application for 15 min. The amplitudes were normalized to the amplitude at time 0 in each cell before averaging across cells. The data were also illustrated as mean ± SEM. Wilcoxon signed-rank tests were used (control vs W-7, n = 9, p = 0.0039; control vs CMZ, n = 12, p = 0.0005; control vs CALP1, n = 5, p = 0.6250); **p < 0.01, ***p < 0.001; ns: not statistically different. Note that CMZ reduced eEPSC amplitude too, but CALP1 did not enhance eEPSC amplitude under control conditions. F, Summary data showing the effects of 50 μm W-7 (circles), 100 μm CMZ (triangles), and 1 μm CALP1 (squares) on mEPSC frequency. The frequencies were normalized to the frequency at time 0 in each cell before averaging across cells. The data were also illustrated as mean ± SEM. Wilcoxon signed-rank tests were used (control vs W-7, n = 15, p < 0.0001; control vs CMZ, n = 12, p = 0.6377; control vs CALP1, n = 9, p = 0.0273); *p < 0.05, ****p < 0.0001; ns: not statistically different. Note that CMZ did not change the mEPSC frequency, but activation of CaM by CALP1 slightly reduced mEPSC frequency.
Figure 3.
Figure 3.
CaM is ubiquitously expressed at sites both near and away from ribbons in RB axon terminals. Confocal images showing immunofluorescence double labeling of CaM (green) and RIBEYE (magenta), a ribbon-specific protein, in the axon terminals of RBs. In the merged image (green + magenta), expression of CaM can be seen near ribbons (arrow) and away from ribbon sites. IPL: inner plexiform layer; GCL: ganglion cell layer. Scale bar: 10 μm.
Figure 4.
Figure 4.
Inhibition of CaM strongly reduces evoked release from RBs by suppressing Ca2+ influx into their axon terminals. A1, Average traces showing that EPSCs recorded in an AII, evoked by puffing LY 341495 (LY), an mGluR6 antagonist, onto the dendrites of RBs located at the OPL, were strongly reduced by application of 50 μm W-7. Vhold = −80 mV. A2, LY-evoked EPSCs decreased over time with application of 50 μm W-7 (n = 7). The peak amplitudes and integrals of EPSCs were normalized to the amplitude and integral at time 0, respectively, in each cell before averaging across cells. B, LY-evoked EPSCs were completely abolished by removing extracellular Ca2+ (0 Ca). C, The EPSCs recorded in an AII, evoked by brief flashes of 470-nm LED in a Pcp2-cre::Ai32 mouse, were abolished completely by removing extracellular Ca2+ (0 Ca). D1, Average traces showing that W-7 (50 μm) strongly suppressed the voltage step-generated Ca currents (ICa) in an RB. D2, Statistics of the effects of 50 μm W-7 (n = 7) and DMSO control on the peak amplitude and integral of RB ICa. The suppression of ICa recorded in RBs was closely related to the inhibition of eEPSCs recorded in AIIs (data adapted from Fig. 2B3, superimposed in gray). E1, Calcium imaging pictures from a Pcp2-cre::Ai38 mouse showing that LY-evoked changes of Ca2+ signals in RB axon terminals (white frames), detected by the Ca2+ indicator GCaMP3, were reduced strongly by application of 50 μm W-7. Scale bar: 1 μm. E2, Representative ΔF/F0 traces showing suppression of Ca2+ signals in an RB axon terminal by 50 μm W-7. E3, Summary data showing that LY-evoked Ca2+ signals in RB axon terminals (n = 21 terminals from 3 retinal slices), measured as areas under the curve (AUCs) of ΔF/F0 traces, were strongly suppressed by 50 μm W-7 over time. All the data were illustrated as mean ± SEM.
Figure 5.
Figure 5.
Both Ca2+-dependent and Ca2+-independent spontaneous release are enhanced, but to different extents, when CaM is inhibited. A–D, Representative traces showing mEPSCs recorded in AIIs under four experimental conditions in different combinations of removal of extracellular calcium (0 Ca), 10 μm BAPTA-AM, 1 μm Tg, and 1 μm YM-58483 (YM). The traces showing mEPSCs after bath application of 50 μm W-7 for 15 min under each condition were also presented. E, Summary data for AII mEPSC frequency under four experimental conditions in A–D. The data under control and W-7 conditions (adapted from Fig. 2C1, empty and full up triangles, respectively) were also presented for direct comparison. The frequencies were normalized to the frequency under control condition in each cell before averaging across cells. The data were also illustrated as mean ± SEM. Paired Student’s t tests were used (0 Ca vs 0 Ca + W-7, n = 12, p = 0.0001; 0 Ca + BAPTA-AM vs 0 Ca + BAPTA-AM + W-7, n = 13, p = 0.0002; 0 Ca + BAPTA-AM + Tg vs 0 Ca + BAPTA-AM + Tg + W-7, n = 11, p = 0.0004; 0 Ca + BAPTA-AM + Tg + YM vs 0 Ca + BAPTA-AM + Tg + YM + W-7, n = 7, p = 0.0062) except for comparison of control and W-7 data by Wilcoxon signed-rank test (n = 15, p < 0.0001); **p < 0.01, ***p < 0.001, ****p < 0.0001. F, Summary data for the relative effect of W-7 on AII mEPSC frequency under control and four experimental conditions. The change in each cell was calculated as the ratio of mEPSC frequencies before and 15 min after application of W-7. The data were also illustrated as mean ± SEM. Mann–Whitney tests were used (W-7 vs 0 Ca + W-7, p = 0.0214; W-7 vs 0 Ca + BAPTA-AM + W-7, p = 0.0954; W-7 vs 0 Ca + BAPTA-AM + Tg + W-7, p = 0.0045; W-7 vs 0 Ca + BAPTA-AM + Tg + YM + W-7, p = 0.0262); *p < 0.05, **p < 0.01; ns: not statistically different.
Figure 6.
Figure 6.
Inhibition of MLCK, but not other CaM targets, differentially regulates evoked and spontaneous release from RBs. A1, Five-millisecond flashes of 470-nm LED were presented to stimulate ChR2-expressing RBs in Pcp2-cre::Ai32 mice. The mEPSCs (in gray background area) and eEPSCs in AIIs were recorded. Vhold = −80 mV. Individual traces showed that a specific MLCK inhibitor, ML-9 (100 μm) strongly increased mEPSC frequency and reduced eEPSC amplitude. A2, Average traces of eEPSCs recorded in the same AII in A1. A3, Statistics of the effects of 50 μm (n = 5) and 100 μm (n = 10) ML-9 on eEPSC amplitude. The amplitudes were normalized to the amplitude at time 0 in each cell before averaging across cells. The data of 50 μm W-7 (adapted from Fig. 2B3, superimposed in magenta) were also included for direct comparison. B1, Statistics of the effects of 25 μm (n = 7), 50 μm (n = 13), and 100 μm (n = 10) ML-9 on mEPSC frequency. The frequencies were normalized to the frequency at time 0 in each cell before averaging across cells. The data of 50 μm W-7 (adapted from Fig. 2C1, superimposed in magenta) were also included for direct comparison. B2, Statistics of the effects of 25 μm (n = 7), 50 μm (n = 13), and 100 μm (n = 10) ML-9 on mEPSC amplitude. The amplitudes were normalized to the amplitude at time 0 in each cell before averaging across cells. C1, Individual traces showing that ML-9 (100 μm) had no inhibitory effect on AMPA receptor-mediated currents recorded in an AII evoked by glutamate (1 mm) applied onto the AII dendrites at the border of the IPL and GCL. Vhold = −80 mV. C2, Magnification of the traces in the dashed line frames of C1, showing increase of mEPSC frequency by ML-9. C3, Statistics of the effects of 100 μm ML-9 (n = 4) on the amplitude of glutamate-evoked currents. The amplitudes were normalized to the amplitude at time 0 in each cell before averaging across cells. D, Summary data showing the effects of bath application of W-7 (50 μm; full circles; adapted from Fig. 2E), ML-9 (100 μm; full down triangles), KN-62 (4 μm; empty circles), MMPX (40 μm; empty squares), and ascomycin (1 μm; empty up triangles), respectively, for 15 min on the amplitude of eEPSCs recorded in AIIs. In each group of data, the amplitudes were normalized to the amplitude before application of a drug in each cell before averaging across cells. The data were also illustrated as mean ± SEM. Wilcoxon signed-rank tests were used (control vs W-7, n = 9, p = 0.0039; control vs ML-9, n = 10, p = 0.0020; control vs KN-62, n = 10, p = 0.0586; control vs MMPX, n = 8, p = 0.4609; control vs ascomycin, n = 8, p = 0.0078); **p < 0.01, ****p < 0.0001; ns: not statistically different. E, Summary data showing the effects of bath application of W-7 (50 μm), ML-9 (100 μm), KN-62 (4 μm), MMPX (40 μm), and ascomycin (1 μm) for 15 min on mEPSC frequency. In each group of data, the frequencies were normalized to the frequency before application of a drug in each cell before averaging across cells. The data were also illustrated as mean ± SEM. Wilcoxon signed-rank tests were used (control vs W-7, n = 15, p < 0.0001; control vs ML-9, n = 10, p = 0.0020; control vs KN-62, n = 11, p = 0.2139; control vs MMPX, n = 8, p = 0.3828; control vs ascomycin, n = 15, p = 0.3591); **p < 0.01, ****p < 0.0001; ns: not statistically different.
Figure 7.
Figure 7.
Inhibition of MLCK strongly reduces evoked release by suppressing calcium currents in RBs. A1, Average traces showing that EPSCs recorded in an AII, evoked by puffing LY 341495 (LY), an mGluR6 antagonist, onto the dendrites of RBs located at the OPL, were strongly reduced by application of 100 μm ML-9. Vhold = −80 mV. A2, LY-evoked EPSCs decreased over time with bath application of 100 μm ML-9 (n = 5). The peak amplitudes and integrals of EPSCs were normalized to the amplitude and integral at time 0, respectively, in each cell before averaging across cells. All the data were illustrated as mean ± SEM. B1, Average traces showing that ML-9 (100 μm) strongly suppressed the voltage step-generated calcium currents (ICa) in an RB. B2, Statistics of the effects of 100 μm ML-9 (n = 10) on the peak amplitude and integral of RB ICa. The suppression of ICa recorded in RBs was closely related to the inhibition of eEPSCs recorded in AIIs (adapted from Fig. 6A3, superimposed in gray). All the data were illustrated as mean ± SEM.
Figure 8.
Figure 8.
Both Ca2+-dependent and Ca2+-independent spontaneous release are enhanced, but to different extents, when MLCK is inhibited. A, B, Representative traces showing AII mEPSCs under control, and different combinations of removal of extracellular calcium (0 Ca), 10 μm BAPTA-AM and 100 μm ML-9 conditions. C, Summary data for AII mEPSC frequency under two experimental conditions in A (empty and full circles) and B (empty and full squares). The data under control and ML-9 conditions (adapted from Fig. 6B1, empty and full triangles, respectively) were also presented for direct comparison. The frequencies were normalized to the frequency under control condition in each cell before averaging across cells. The data were also illustrated as mean ± SEM. Wilcoxon signed-rank tests were used (control vs ML-9, n = 10, p = 0.0020; 0 Ca + BAPTA-AM vs 0 Ca + BAPTA-AM + ML-9, n = 9, p = 0.0039) except for comparison of 0 Ca and 0 Ca + ML-9 data by paired Student’s t test (n = 10, p = 0.0001); **p < 0.01, ***p < 0.001. D, Summary data for changes of AII mEPSC frequency after bath application of 100 μm ML-9 for 15 min under control and two experimental conditions. The change in each cell was calculated as the ratio of mEPSC frequencies before and 15 min after application of ML-9. The data were also illustrated as mean ± SEM. Mann–Whitney tests were used (ML-9 vs 0 Ca + ML-9, p = 0.0232; ML-9 vs 0 Ca + BAPTA-AM + ML-9, p =0.0030); *p < 0.05, **p < 0.01.
Figure 9.
Figure 9.
Inhibition of CaM occludes the effect of MLCK inhibition on spontaneous release. A, Representative traces showing that, after preincubation with 50 μm W-7, 100 μm ML-9 did not increase, but instead reduced, AII mEPSC frequency. B, Representative traces showing that, after preincubation with 50 μm W-7, AII mEPSC frequency decreased significantly after 10-min recording. C, Summary data for AII mEPSC frequency under three experimental conditions in A (empty and full circles), B (empty and full squares), and DMSO control (empty and full triangles). The frequencies were normalized to the frequency under control condition in each cell before averaging across cells. The data were also illustrated as mean ± SEM. Wilcoxon signed-rank tests (control 1 vs ML-9, n = 13, p = 0.0002; control 2 vs no drug, n = 8, p = 0.0078; control 3 vs DMSO, n = 7, p = 0.0156) or unpaired Student’s t test (ML-9 vs no drug, p = 0.0001; no drug vs DMSO, p = 0.7337) were used for comparison; *p < 0.05, **p < 0.01, ***p < 0.001; ns: not statistically significant.

Similar articles

Cited by

References

    1. Abrahamsson T, Chou CYC, Li SY, Mancino A, Costa RP, Brock JA, Nuro E, Buchanan KA, Elgar D, Blackman AV, Tudor-Jones A, Oyrer J, Farmer WT, Murai KK, Sjöström PJ (2017) Differential regulation of evoked and spontaneous release by presynaptic NMDA receptors. Neuron 96:839–855. 10.1016/j.neuron.2017.09.030 - DOI - PubMed
    1. Acuna C, Liu X, Gonzalez A, Südhof TC (2015) RIM-BPs mediate tight coupling of action potentials to Ca(2+)-triggered neurotransmitter release. Neuron 87:1234–1247. 10.1016/j.neuron.2015.08.027 - DOI - PubMed
    1. Andreae LC, Burrone J (2018) The role of spontaneous neurotransmission in synapse and circuit development. J Neurosci Res 96:354–359. 10.1002/jnr.24154 - DOI - PMC - PubMed
    1. Bai H, Xue R, Bao H, Zhang L, Yethiraj A, Cui Q, Chapman ER (2016) Different states of synaptotagmin regulate evoked versus spontaneous release. Nat Commun 7:10971. 10.1038/ncomms10971 - DOI - PMC - PubMed
    1. Bal M, Leitz J, Reese AL, Ramirez DM, Durakoglugil M, Herz J, Monteggia LM, Kavalali ET (2013) Reelin mobilizes a VAMP7-dependent synaptic vesicle pool and selectively augments spontaneous neurotransmission. Neuron 80:934–946. 10.1016/j.neuron.2013.08.024 - DOI - PMC - PubMed

LinkOut - more resources