. 2020 Dec 8;5(1):52.
doi: 10.1038/s41525-020-00158-5.

A computational model for classification of BRCA2 variants using mouse embryonic stem cell-based functional assays

Affiliations

A computational model for classification of BRCA2 variants using mouse embryonic stem cell-based functional assays

Kajal Biswas et al. NPJ Genom Med. .

Abstract

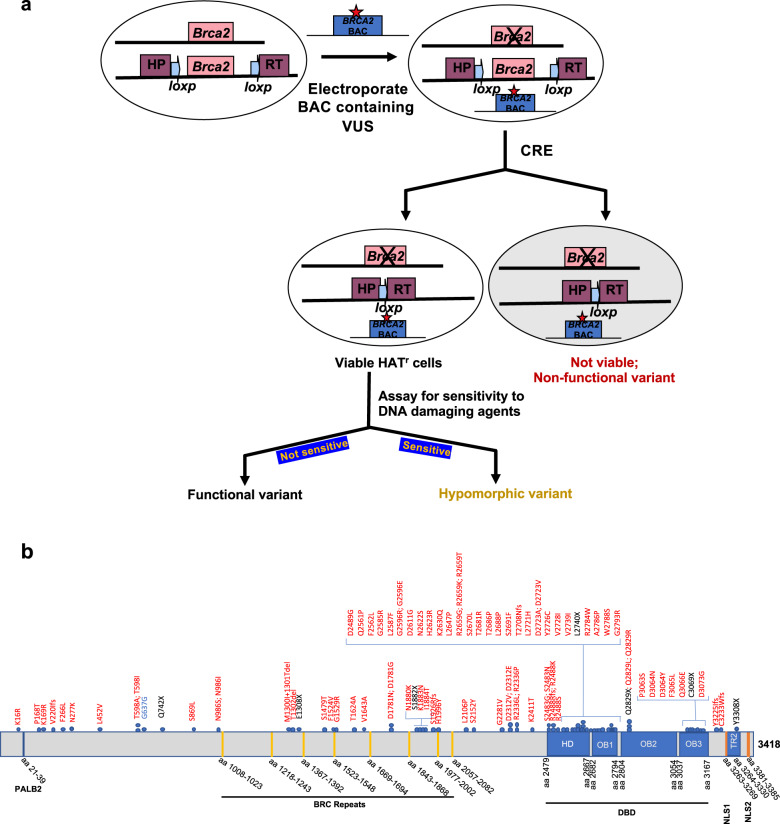
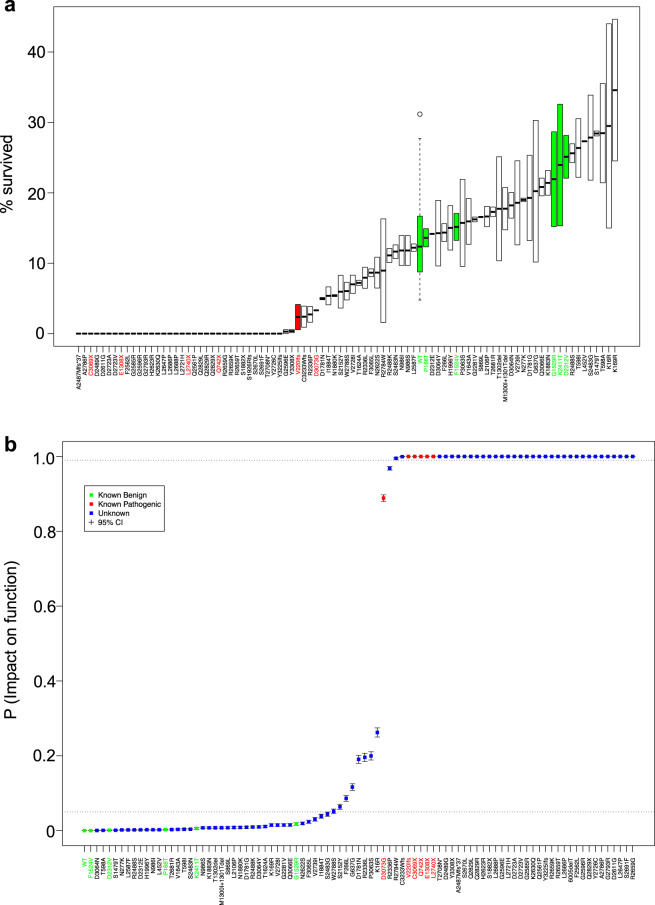
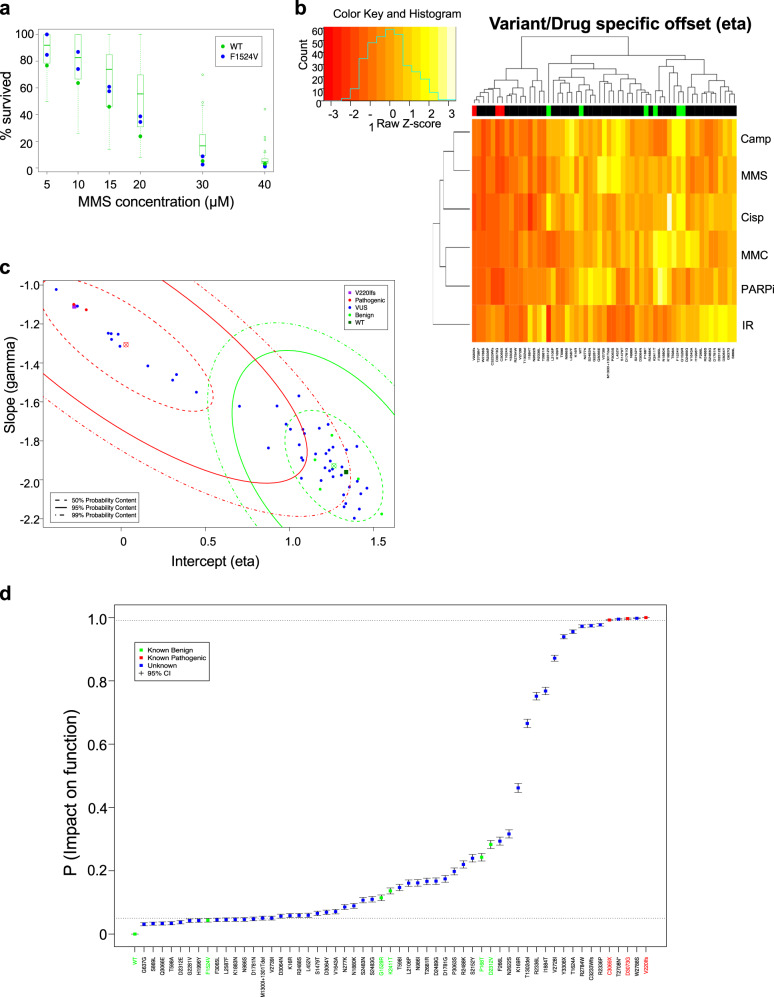
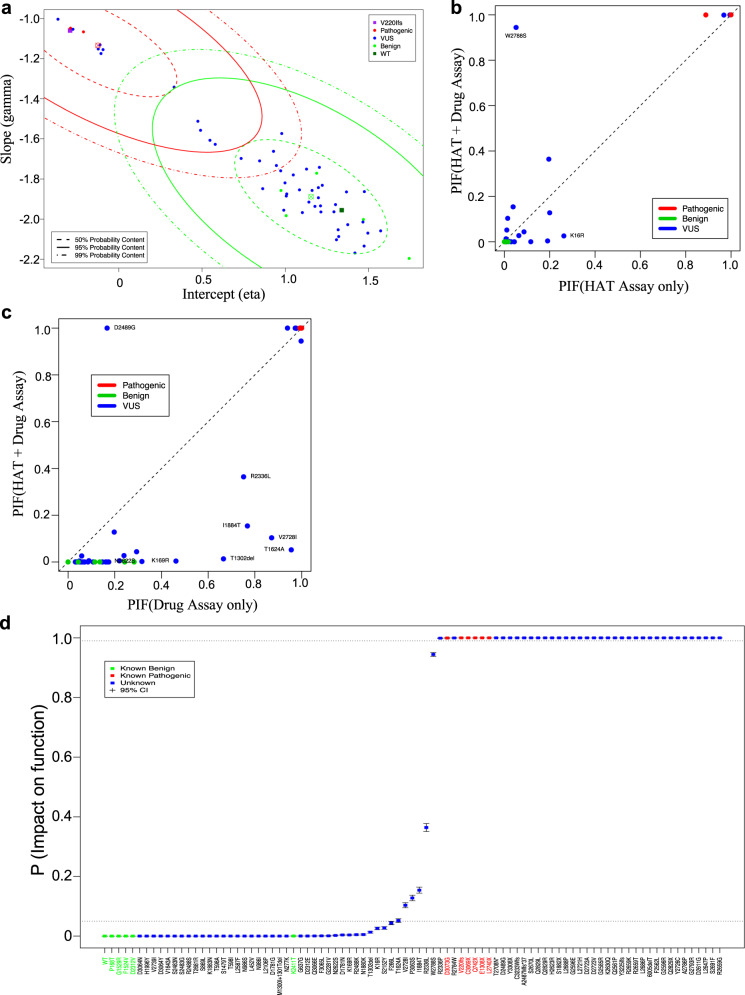
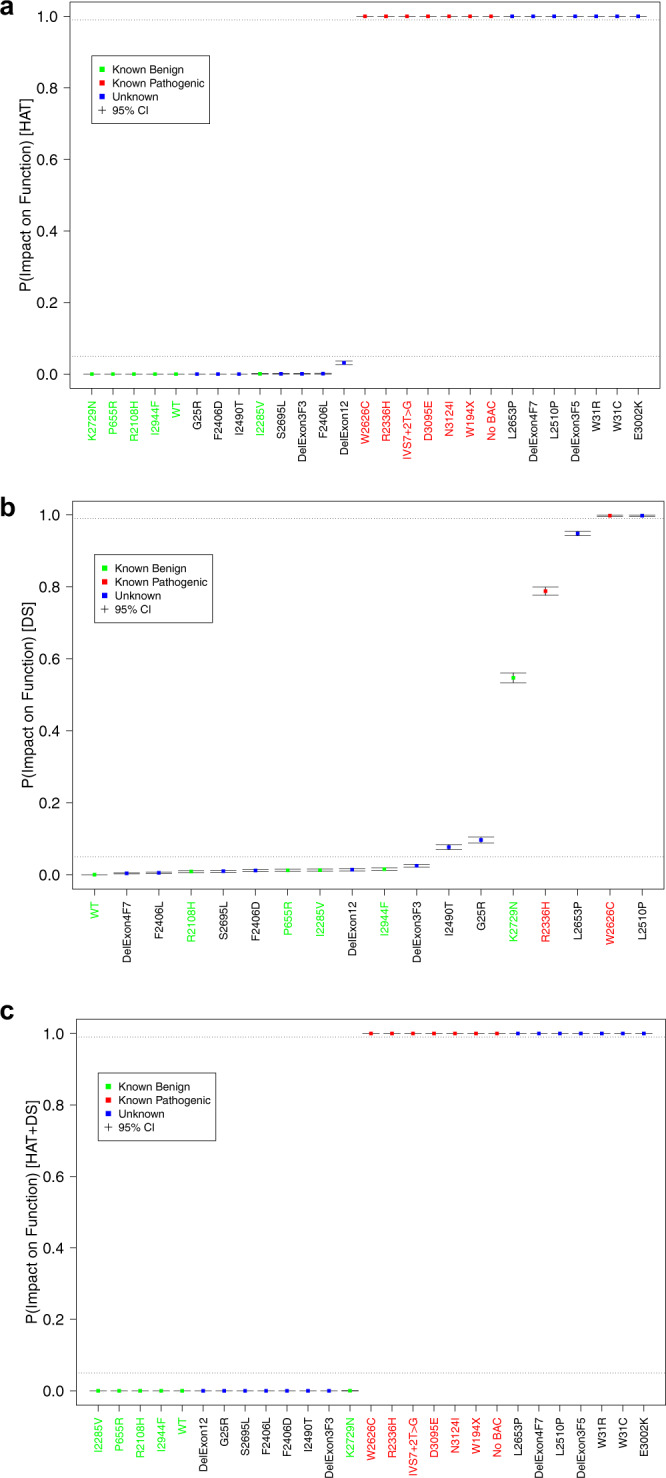
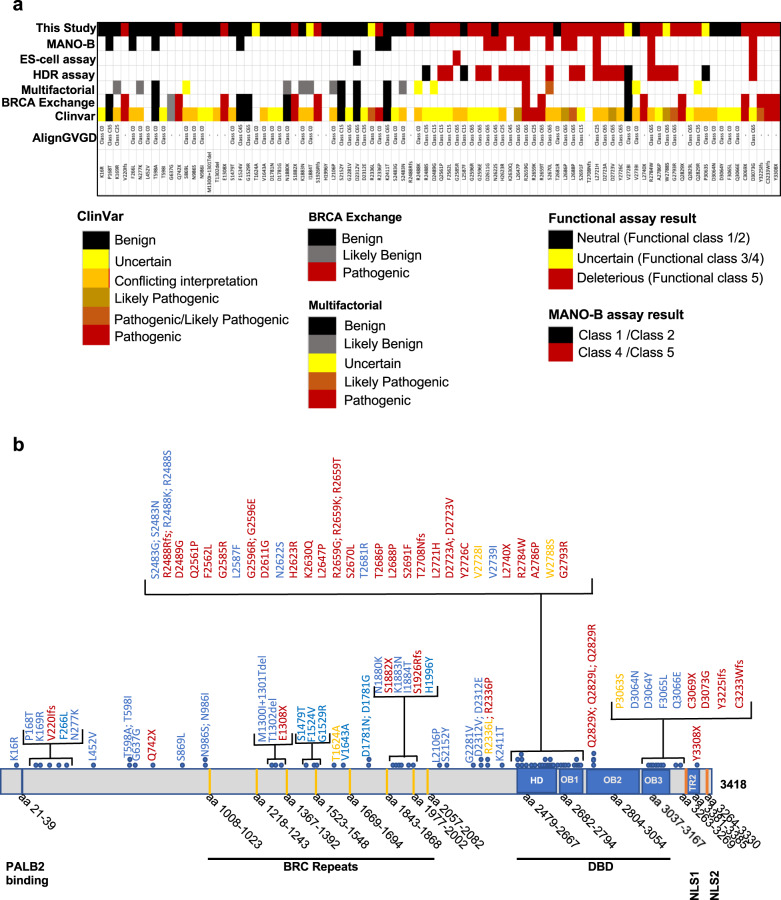
Sequencing-based genetic tests to identify individuals at increased risk of hereditary breast and ovarian cancers have resulted in the identification of more than 40,000 sequence variants of BRCA1 and BRCA2. A majority of these variants are considered to be variants of uncertain significance (VUS) because their impact on disease risk remains unknown, largely due to lack of sufficient familial linkage and epidemiological data. Several assays have been developed to examine the effect of VUS on protein function, which can be used to assess their impact on cancer susceptibility. In this study, we report the functional characterization of 88 BRCA2 variants, including several previously uncharacterized variants, using a well-established mouse embryonic stem cell (mESC)-based assay. We have examined their ability to rescue the lethality of Brca2 null mESC as well as sensitivity to six DNA damaging agents including ionizing radiation and a PARP inhibitor. We have also examined the impact of BRCA2 variants on splicing. In addition, we have developed a computational model to determine the probability of impact on function of the variants that can be used for risk assessment. In contrast to the previous VarCall models that are based on a single functional assay, we have developed a new platform to analyze the data from multiple functional assays separately and in combination. We have validated our VarCall models using 12 known pathogenic and 10 neutral variants and demonstrated their usefulness in determining the pathogenicity of BRCA2 variants that are listed as VUS or as variants with conflicting functional interpretation.


Conflict of interest statement

The authors declare no competing interests.

Figures

Fig. 1
Fig. 1. Mouse ES cell-based functional assay for BRCA2 variants.
a Schematic representation of the functional assay. BAC DNA encoding human BRCA2 gene with any variant was introduced into PL2F7 mES cells containing a conditional allele and a knockout allele of Brca2. Conditional allele was further deleted by CRE and the recombinants were selected on HAT containing media. Depending on the impact of BRCA2 variants, HATr cells may or may not be viable. Viable HATr cells were further tested for sensitivity to different DNA damaging agents to distinguish between variants that have no impact on function and those that have some loss of function (hypomorphic). Star in the BAC construct represents variant. Two halves of HPRT mini gene are marked in solid boxes as HP and RT. Solid arrows denote loxP sites. b Schematic diagram of BRCA2 protein with different domains and position of variants selected. Different domains are marked as colored boxes and the amino acids (aa) for the respective domains are noted below. HD helical domain, DBD DNA-binding domain, OB oligonucleotide binding fold, TR2 C-terminal RAD51-binding site, NLS nuclear localization signal,,. Variants selected for analysis are denoted as colored solid circles on top. Missense, silent or synonymous and nonsense variants are marked in red, blue, and black colors, respectively.
Fig. 2
Fig. 2. Probability of impact on function (PIF) estimates of cell survival.
a Cell survival fractions are plotted for each variant ordered by average survival fraction. Known neutral variants are highlighted in green and known pathogenic variants are highlighted in red. The box plotted for each variant range from the lower replicate value up to the upper replicate value with the mean value highlighted at the midpoint; for the WT we have plotted a box and whisker plot of the distribution of WT values across batches (the box ranges from the first-to-third quartile with a horizontal line plotted at the median, whiskers extend from the box down to the smallest value and from the box up to the largest value within ±1.5 standard deviations of the median and points beyond this limit are depicted individually). b A plot of the estimated PIFs from the cell survival data VarCall model, depicted in increasing order. Posterior mean estimates are plotted as dots; whiskers extend from the lower to upper limits of 95% posterior credible intervals.
Fig. 3
Fig. 3. The drug sensitivity data and probability of impact on function (PIF) estimates.
a A plot of the observed MMS assay survival fractions for variant F1524V (blue points); paired wildtype values are plotted as green points and the distributions of WT values across batches are depicted as boxplots (open circles represent outlier values). Note the characteristic nonlinear decline in survival fraction from 1.0 (100%) to zero as a function of concentration. This relationship is modeled well using the chosen family of dose response curves. b Bi-clustered heatmaps of the drug sensitivity model intercept parameters from the drug sensitivity model. Cells in the plot represent variant- (column) and drug-specific (row) effects. Higher survival percentage values are plotted in shades of yellow; lower values in shades of red and orange. The lower the value of eta, the faster the survival fractions decline as a function of dose, i.e., the greater the sensitivity of the variant. Variants tend to co-cluster as likely pathogenic or likely neutral based on these estimates (the green and red bars at the top of the plot indicate the known benign and known pathogenic variants, respectively). c Slope vs. intercept scatter plot of the estimated variant-level drug sensitivity effects for each variant. Contours of the bivariate VarCall mixture model components are plotted in green (neutral component) and red (pathogenic). Variants plotted at similar contour levels for both components will have equivocal PIF estimates; variants plotted at dissimilar levels (e.g., those in the upper left corner) will be more clearly classified (see panel d). d Estimated PIFs plot from the drug sensitivity data VarCall model, depicted in increasing order. Dots represent posterior mean estimates with the whiskers extend from the lower to upper limits of 95% posterior credible intervals.
Fig. 4
Fig. 4. Classification parameters and estimates from the model combining the cell survival and drug sensitivity data.
a Slope vs. intercept scatter plot for the combined model. b Plot of the PIF from the HAT model (x-axis) against the PIF from the combined model (y-axis). c Plot of the PIF from the drug assay model (x-axis) against the PIF from the combined model (y-axis). d Plot showing the estimated PIFs plot from the combined VarCall model of HAT survival and drug sensitivity data, depicted in increasing order. Posterior mean estimates and represented as dots and the whiskers extend from the lower to upper limits of 95% posterior credible intervals.
Fig. 5
Fig. 5. Classification of variants using combined data of drug sensitivity assay and cell survival.
Boxplots of the PIFs estimated for the validation set variants, plotted in increasing order. a Based on HAT model, b based on the DS model, and c based on the HAT + DS model. Note that variant del exon 4–7 is estimated to be neutral based on the HAT data and pathogenic based on the drug sensitivity assay. It remains unclassified when the data are combined.
Fig. 6
Fig. 6. Classification of variants analyzed using the VarCall method.
a Variants analyzed using VarCall method are compared to ClinVar, Align GVGD, BRCA Exchange, classification by multifactorial likelihood ratio and published BRCA2 functional assays. Colored boxes represent different classifications listed below. The MANO-B (mixed-allnominated-in-one (MANO)-BRCA) method of classification includes the classification by Ikegami et al. (2020), the ES assay includes the classification of variants using mouse ES cell-based assay reported by Mesman et al. (2019) and the HDR assay includes the classification of variants using HR assay reported by Guidugli et al. (2018),,. The Multifactorial classifications are based on the study by Parson et al.. b Schematic representation of classified variants in different domains of BRCA2. Neutral, hypomorphic and pathogenic variants are marked in blue, yellow, and magenta colors, respectively. Different domains are marked below with the range of amino acids (aa) containing in each domain.

References

    1. Bray F, et al. Global cancer statistics 2018: GLOBOCAN estimates of incidence and mortality worldwide for 36 cancers in 185 countries. CA Cancer J. Clin. 2018;68:394–424. doi: 10.3322/caac.21492. - DOI - PubMed
    1. Kuchenbaecker KB, et al. Risks of breast, ovarian, and contralateral breast cancer for BRCA1 and BRCA2 mutation carriers. J. Am. Med. Assoc. 2017;317:2402–2416. doi: 10.1001/jama.2017.7112. - DOI - PubMed
    1. Wooster R, et al. Identification of the breast cancer susceptibility gene BRCA2. Nature. 1995;378:789–792. doi: 10.1038/378789a0. - DOI - PubMed
    1. Wang Y, et al. Rare variants of large effect in BRCA2 and CHEK2 affect risk of lung cancer. Nat. Genet. 2014;46:736–741. doi: 10.1038/ng.3002. - DOI - PMC - PubMed
    1. van Asperen CJ, et al. Cancer risks in BRCA2 families: estimates for sites other than breast and ovary. J. Med. Genet. 2005;42:711–719. doi: 10.1136/jmg.2004.028829. - DOI - PMC - PubMed