. 2020 Dec 8;11(1):6287.
doi: 10.1038/s41467-020-20058-7.

Nuclear numbers in syncytial muscle fibers promote size but limit the development of larger myonuclear domains

Affiliations

Nuclear numbers in syncytial muscle fibers promote size but limit the development of larger myonuclear domains

Alyssa A W Cramer et al. Nat Commun. .

Abstract

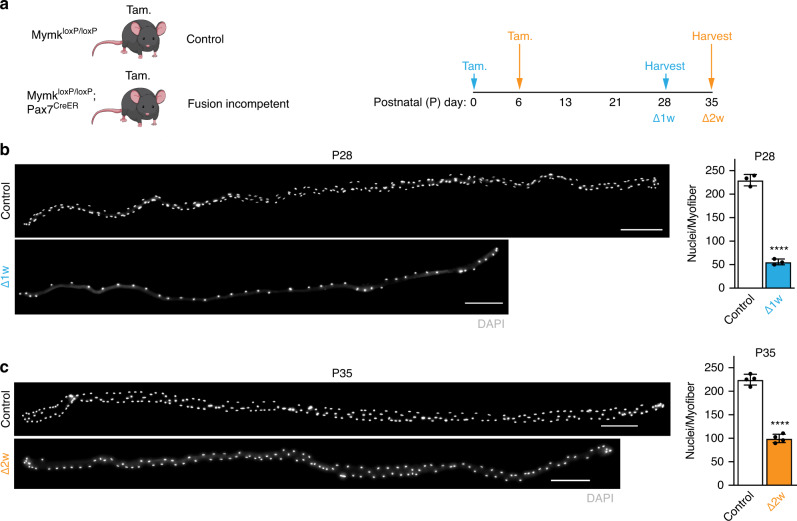
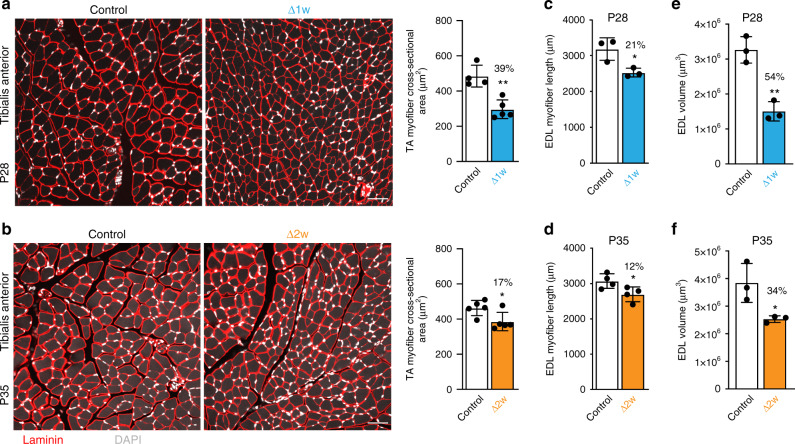
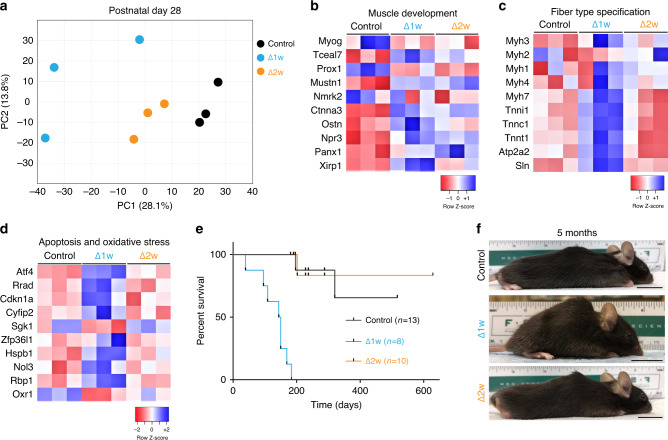
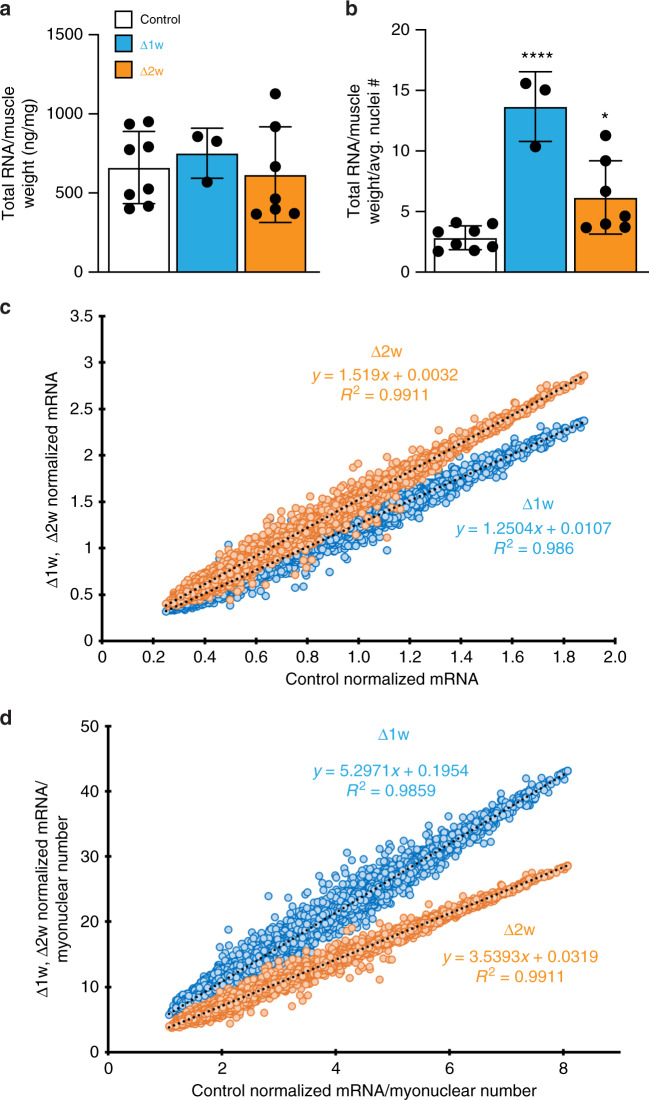
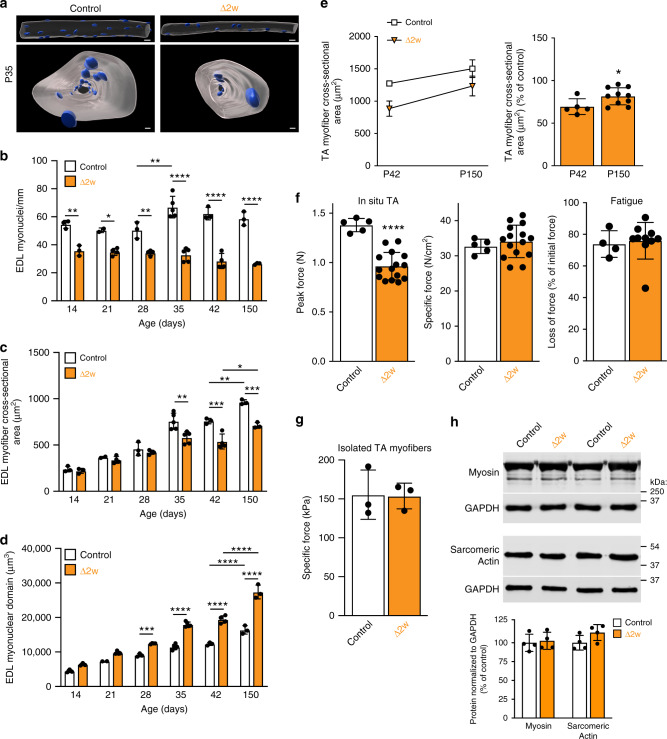
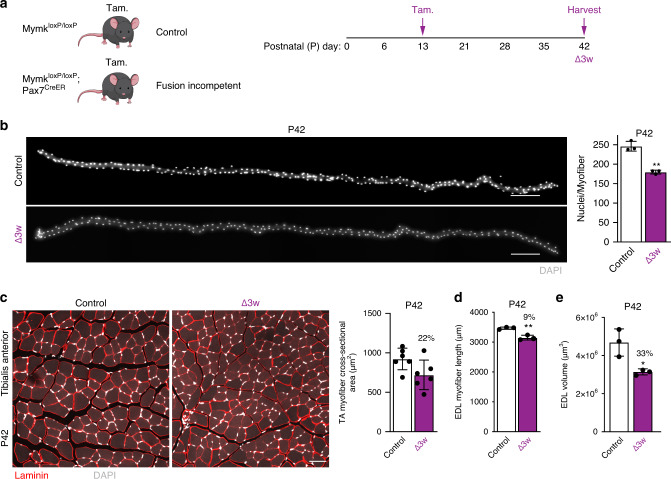
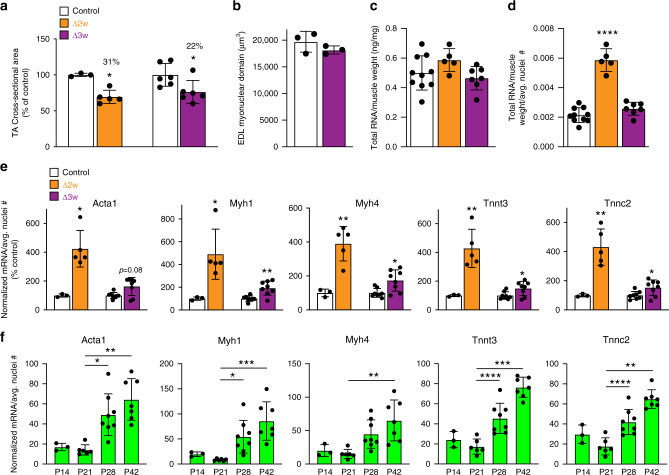
Mammalian cells exhibit remarkable diversity in cell size, but the factors that regulate establishment and maintenance of these sizes remain poorly understood. This is especially true for skeletal muscle, comprised of syncytial myofibers that each accrue hundreds of nuclei during development. Here, we directly explore the assumed causal relationship between multinucleation and establishment of normal size through titration of myonuclear numbers during mouse neonatal development. Three independent mouse models, where myonuclear numbers were reduced by 75, 55, or 25%, led to the discovery that myonuclei possess a reserve capacity to support larger functional cytoplasmic volumes in developing myofibers. Surprisingly, the results revealed an inverse relationship between nuclei numbers and reserve capacity. We propose that as myonuclear numbers increase, the range of transcriptional return on a per nuclear basis in myofibers diminishes, which accounts for both the absolute reliance developing myofibers have on nuclear accrual to establish size, and the limits of adaptability in adult skeletal muscle.


Conflict of interest statement

The authors declare no competing interests.

Figures

Fig. 1
Fig. 1. Temporal genetic ablation of Myomaker in satellite cells during development titrates myonuclear number in myofibers.
a Experimental design used to reduce myonuclear accretion during development. MymkloxP/loxP or MymkloxP/loxP; Pax7CreER mice were treated with tamoxifen (Tam.) to generate control or fusion-incompetent mice, respectively. Tamoxifen was administered at either postnatal (P) day 0 (Δ1w) or P6 (Δ2w) and animals were sacrificed 4 weeks post-tamoxifen. b Single myofiber images (left) and quantified average number of nuclei per myofiber (right) in control and Δ1w EDL muscle at P28. Control myofibers had an average of 230 nuclei/myofiber, while Δ1w mice had an average of 55 nuclei/myofiber. Myonuclei are labeled with DAPI. c Single myofiber images (left) and average number of nuclei per myofiber (right) in Δ2w and control EDL muscle at P35. Control myofibers had an average of 225 nuclei/myofiber, while Δ2w mice had an average of 100 nuclei/myofiber. Myonuclei are labeled using DAPI. In (b) and (c), n = 3 biologically independent animals and 20 myofibers were analyzed per animal. Statistical analyses and data presentation: (b) and (c), two-sided unpaired t-test; ****P < 0.0001. Data are reported as mean ± SD. Scale bar: 200 μm. Source data are provided as a Source Data file.
Fig. 2
Fig. 2. Effects of myonuclear reduction on myofiber dimensions.
a Representative sections of tibialis anterior (TA) muscle of Δ1w and control mice at P28 (left). Analysis of cross-sectional area (CSA; right) revealed a 39% reduction in Δ1w myofiber CSA compared to controls. b Sections of TA muscle of Δ2w and control mice at P35 (left). CSA analysis (right) showed Δ2w myofibers are 17% smaller than controls. Sections in (a) and (b) were immunostained with laminin antibodies (red) and also stained with DAPI to label nuclei (white). c, d Average length of Δ1w EDL myofibers is decreased by 21% compared to controls (c), and Δ2w EDL myofiber length is decreased by 12% (d). e, f Myofiber volume showed a 54% reduction in Δ1w EDL at P28 (e) and a 34% reduction in Δ2w EDL at P35 (f). At least 3 20× images were analyzed per mouse in (a) and (b) (n = 4–5 biologically independent animals). 20 myofibers were analyzed per animal in (cf) (n = 3–4 biologically independent animals). Statistical analyses and data presentation: (af) two-sided unpaired t-test; *p < 0.05, **p < 0.01. Data are represented as mean ± SD. Scale bar: 50 μm. Source data are provided as a Source Data file.
Fig. 3
Fig. 3. Δ1w mice display a maladaptive lethal phenotype in contrast to Δ2w mice.
a PCA plot from microarray analysis showing the differential clustering of Δ1w, Δ2w, and control samples (TA muscle). Δ1w muscle displayed a more divergent profile from that of Δ2w and control muscle, which appeared more similar. b Heat map of muscle development genes showed more pronounced alterations in Δ1w compared to Δ2w muscle. c Heat map of genes associated with muscle fiber type revealed Δ1w muscle exhibit increased expression of slow fiber type genes (Myh7, Tnnt1, Atp2a2, Sln) and reduced expression of fast fiber type genes (Myh4, Myh1). d Heat map showing increased expression of apoptosis and oxidative stress genes in Δ1w muscle. e Survival curve for Δ1w, Δ2w, and control mice. Δ1w mice began dying prematurely prior to three months of age while Δ2w mice did not. f Images of Δ1w, Δ2w, and control mice showed kyphosis in Δ1w mice, while Δ2w mice looked similar to controls. Data presentation: (ad) data generated using microarray data performed on TA muscle at P28; n = 3 per group. Scale bar: 2 cm. Source data are provided as a Source Data file.
Fig. 4
Fig. 4. Myofibers adapt to the reduction in myonuclear numbers by elevating mRNA concentrations.
a Total RNA levels from the tibialis anterior normalized to muscle weight for the indicated groups of mice at P28. b Normalized RNA levels (from a) further normalized to the average number of nuclei/myofiber. For (a) and (b), n = 3–8 biologically independent animals. c Comparison of the mRNA concentration (normalization of sst-rma signals from microarray of 22,207 annotated transcripts to total RNA for the respective sample) of Δ1w and Δ2w muscle to control revealed a greater contribution of mRNA to total RNA (mRNA concentration) being generated in both Δ1w (slope = 1.2504) and Δ2w (slope = 1.519) muscle (represented as the slope of the best-fit line). d Data from c were normalized further to average number of nuclei/myofiber, revealing an even larger increase in the percentage of mRNA:total RNA being generated on a per nucleus basis in Δ1w (slope = 5.2971) and Δ2w (slope = 3.5393) muscle compared to controls. Statistical analyses and data presentation: (a) and (b), one-way ANOVA with a Tukey correction for multiple comparisons; *p < 0.05, ****p < 0.0001. Significance compared to control group. Data are reported as mean ± SD. Source data are provided as a Source Data file.
Fig. 5
Fig. 5. Δ2w mice retain the ability to generate normal muscle quality with enlarged myonuclear domains.
a Representative images showing 3D rendered myonuclei (blue) and myofiber volume (gray) from a section of control and Δ2w EDL myofibers at P35, viewed from the side (top) and through (bottom) the myofiber. Images were used to quantify nuclei number, myofiber area and myonuclear domain. b Number of myonuclei/mm in EDL myofibers from the indicated groups of mice at various ages. c EDL myofiber cross-sectional areas in control and Δ2w muscle. d Quantification of changes in myonuclear domain in control and Δ2w EDL myofibers over time. bd n = 3–5 biologically independent animals. e Comparison of tibialis anterior (TA) cross-sectional area at P42 and 5 months, expressed as growth over time (left), and percentage of control (right), revealed the retained ability of Δ2w muscle to grow at the same rate as control muscle. n = 5–10 biologically independent animals. f Control and Δ2w muscle were subjected to in situ muscle force measurements to assess functional capacity at five months of age. Δ2w tibialis anterior generated a lower peak tetanic force (left), but when normalized to physiological cross-sectional area, Δ2w muscle exhibited similar specific force as controls (middle), indicating the overall functional quality of muscle in the two groups is the same. Fatigue, measured as loss of initial force following continuous isometric stimulations, was similar between the two groups (right). n = 5–15 biologically independent animals. g Contractile function of single myofibers from control and Δ2w tibialis anterior muscles. 6 myofibers were analyzed per animal. n = 3 biologically independent animals. h Representative western blots for myosin and sarcomeric actin from control and Δ2w quadriceps (top). Quantification of the protein signal normalized to GAPDH (bottom). n = 4 biologically independent animals. Statistical analyses and data presentation: (bd) two-way ANOVA with a Tukey correction for multiple comparisons. eh Two-sided unpaired t-test; *p < 0.05, **p < 0.01, ***p < 0.001, ****p < 0.0001. Data are reported as mean ± SD. Scale bars: (a) 30 μm (top), 10 μm (bottom). Source data are provided as a Source Data file.
Fig. 6
Fig. 6. Size characteristics in Δ3w mice.
a Experimental design used to generate a third genetic model, Δ3w mice. The indicated groups of mice were administered tamoxifen (Tam.) at P13 and tissue was collected four weeks later. b Single myofiber images (left) and quantified average number of nuclei per myofiber (right) in Δ3w and control EDL muscle at P42. Control myofibers have an average of 246 nuclei/myofiber, while Δ3w mice have an average of 180 nuclei/myofiber. Myonuclei are labeled with DAPI. c Representative sections of Δ3w and control tibialis anterior (TA) muscle at P42 (left). Analysis of cross-sectional area (right) showed Δ3w myofibers are 22% smaller than controls. Sections in (c) were immunostained with laminin antibodies (red) and stained with DAPI (white). d Average length of Δ3w EDL myofibers is decreased by 9% compared to controls. e Myofiber volume showed a 33% reduction in Δ3w EDL at P42. 20 myofibers were analyzed per animal (n = 3 biologically independent animals) in (b), (d), and (e). At least 3 20× images were analyzed per mouse in (c) (n = 6 biologically independent animals). Statistical analyses and data presentation: (be) two-sided unpaired t-test; *p < 0.05, **p < 0.01. Data are represented as mean ± SD. Scale bars: (b) 200 μm, (c) 50 μm. Source data are provided as a Source Data file.
Fig. 7
Fig. 7. Flexiblity is inversely correlated with myonuclear number.
a A comparison of the cross-sectional area of tibialis anterior muscle in Δ2w and Δ3w mice at postnatal (P) day 42 revealed similar effects on cell size, despite differences in myonuclear number (n = 3–7 biologically independent animals). b Assessment of the myonuclear domain in isolated EDL myofibers from Δ3w mice at P42 (n = 3 biologically independent animals). c Total RNA levels normalized to muscle weight in the various groups of mice (n = 5–10 biologically independent animals). d Normalized RNA levels from (c) were normalized again to the average number of nuclei/myofiber (n = 5–10 biologically independent animals). A significant increase in the amount of RNA per myonucleus is observed in Δ2w muscle, but remains unchanged in Δ3w muscle. e Concentration of transcripts coding for key skeletal muscle structural genes (Acta1, Myh1, Myh4, Tnnt3, and Tnnc2) on a per nuclear basis are increased in Δ2w and Δ3w muscle compared to controls (n = 3–8 biologically independent animals). Δ2w muscle has a larger increase in transcript concentration per nucleus than Δ3w, despite having fewer myonuclei per fiber. To obtain these values, relative transcript levels were determined by semi-quantitative qPCR from P42 samples, which were then normalized to total RNA and average myonuclear numbers for each genotype. f Abundance of transcripts on a per nuclear basis in wild-type tibialis anterior across developmental time points (n = 3–7 biologically independent animals). Statistical analyses and data presentation: a, two-sided unpaired t-test. c, d One-way ANOVA with a Tukey correction for multiple comparisons; significance compared to control group. e, Acta1 (both groups), Myh1 (Δ2w only): Mann–Whitney test. Myh1 (Δ3w only), Myh4, Tnnt3, and Tnnc2 (both groups): two-sided unpaired t-test with Welch’s correction. f One-way ANOVA with Tukey correction for multiple comparisons. Acta1 was analyzed with one-way ANOVA with Kruskal–Wallis correction for multiple comparisons. *p < 0.05, **p < 0.01, ***p < 0.001, ****p < 0.0001. Data are represented as mean ± SD. Source data are provided as a Source Data file.

References

    1. Marguerat S, Bahler J. Coordinating genome expression with cell size. Trends Genet. 2012;28:560–565. doi: 10.1016/j.tig.2012.07.003. - DOI - PubMed
    1. Neurohr GE, et al. Excessive cell growth causes cytoplasm dilution and contributes to senescence. Cell. 2019;176:1083–1097. e1018. doi: 10.1016/j.cell.2019.01.018. - DOI - PMC - PubMed
    1. Zhurinsky J, et al. A coordinated global control over cellular transcription. Curr. Biol. 2010;20:2010–2015. doi: 10.1016/j.cub.2010.10.002. - DOI - PubMed
    1. Petrany, M. J. & Millay, D. P. Cell fusion: merging membranes and making muscle. Trends Cell Biol. 10.1016/j.tcb.2019.09.002 (2019). - PMC - PubMed
    1. Guedes-Dias, P. & Holzbaur, E. L. F. Axonal transport: Driving synaptic function. Science. 10.1126/science.aaw9997 (2019). - PMC - PubMed

Publication types