. 2020 Dec 8;10(1):21422.
doi: 10.1038/s41598-020-77383-6.

A framework to assess the impact of number of trials on the amplitude of motor evoked potentials

Affiliations

A framework to assess the impact of number of trials on the amplitude of motor evoked potentials

Claudia Ammann et al. Sci Rep. .

Abstract

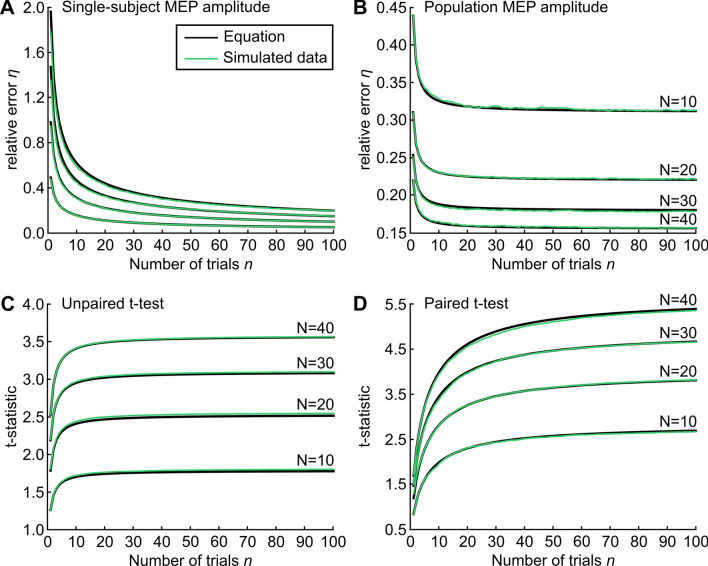
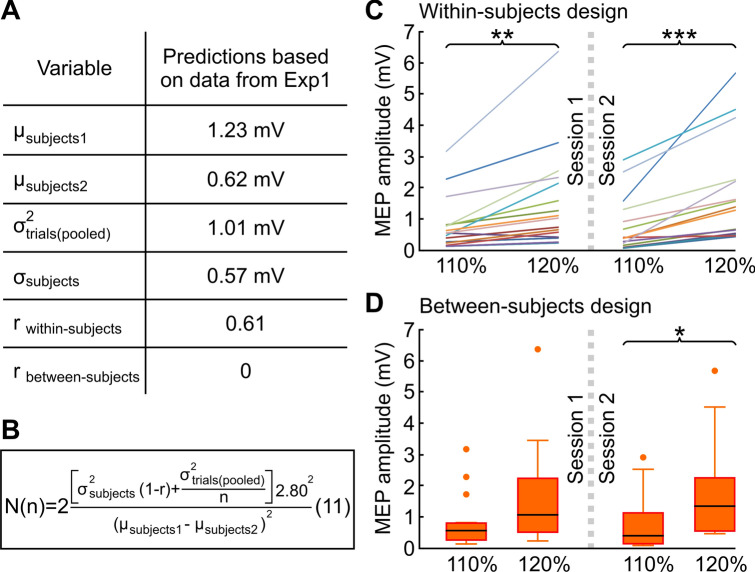
The amplitude of motor evoked potentials (MEPs) elicited by transcranial magnetic stimulation (TMS) is a common yet highly variable measure of corticospinal excitability. The tradeoff between maximizing the number of trials and minimizing experimental time remains a hurdle. It is therefore important to establish how many trials should be used. The aim of this study is not to provide rule-of-thumb answers that may be valid only in specific experimental conditions, but to offer a more general framework to inform the decision about how many trials to use under different experimental conditions. Specifically, we present a set of equations that show how the number of trials affects single-subject MEP amplitude, population MEP amplitude, hypothesis testing and test-retest reliability, depending on the variability within and between subjects. The equations are derived analytically, validated with Monte Carlo simulations, and representatively applied to experimental data. Our findings show that the minimum number of trials for estimating single-subject MEP amplitude largely depends on the experimental conditions and on the error considered acceptable by the experimenter. Conversely, estimating population MEP amplitude and hypothesis testing are markedly more dependent on the number of subjects than on the number of trials. These tools and results help to clarify the impact of the number of trials in the design and reproducibility of past and future experiments.


Conflict of interest statement

The authors declare no competing interests.

Figures

Figure 1
Figure 1
Number of trials for single-subject MEP amplitude, population MEP amplitude and hypothesis testing. (A) Single-subject MEP amplitude. With a given number of trials n (x-axis), the single-subject MEP amplitude is expected to be with 95% probability (i.e. z1-α/2 = 1.96) within a relative error η (y-axis) around the true average, depending on the coefficient of variation (CVtrials= 0.25, 0.50, 0.75, 1.0). The lines represent Eq. (5) (black) and 10,000 single subjects simulated with lognormally distributed MEP amplitudes (green). (B) Population MEP amplitude. Representative example with μsubjects = 1 mV, σsubjects = 0.5 mV, σtrials = 0.5 mV. With a given number of trials n (x-axis), the population MEP amplitude is expected to be with 95% probability (i.e. z1-α/2 = 1.96) within a relative error η (y-axis) around the true average, depending on the number of subjects (N = 10, 20, 30, 40). The lines represent Eq. (9) (black) and 10,000 populations of subjects simulated with lognormally distributed MEP amplitudes (green). (C) Unpaired t-test. Representative example with μsubjects1 = 1.4 mV, μsubjects2 = 1.0 mV, σsubjects = 0.5 mV, σtrials = 0.5 mV and r = 0. The t statistic is plotted as a function of the number of trials n, depending on the number of subjects (N= 10, 20, 30, 40). The lines represent Eq. (10) (black) and 10,000 populations of subjects simulated with lognormally distributed MEP amplitudes (green). (D) Paired t-test. Representative example with μsubjects1 = 1.2 mV, μsubjects2 = 1.0 mV, σsubjects = 0.5 mV, σtrials = 0.5 mV and r = 0.9. The t statistic is plotted as a function of the number of trials n, depending on the number of subjects (N = 10, 20, 30, 40). Lines as in (C). Note that equations (black lines) and simulated data (green lines) are highly overlapping.
Figure 2
Figure 2
Validation with experimental data from Experiment 1. (A) Schematic experimental set up using TMS on the primary motor cortex inducing MEPs in the contralateral FDI muscle. A representative example of a recorded MEP is shown. (B) Peak-to-peak MEP amplitudes (mV) from one representative subject showing all 100 trials. (C) Experimental application of Eq. (5). (D) Average peak-to-peak MEP amplitude (μtrials) and average standard deviation (σtrials) from all subjects (N= 20) are represented. (E) Experimental application of Eq. (9). (C,E) For a 95% c.i., α= 0.05 and z1-α/2= 1.96.
Figure 3
Figure 3
Experimental validation of Eq. (11). (A) Estimations based on data from Experiment 1 to calculate the number of trials needed to detect a difference in MEP amplitude between 110%RMT and 120%RMT. (B) With the numbers from (A), Eq. (11) determines that to detect a significant difference using 10 (or 30) trials in a within-subjects design it would require 10 (or 7) subjects, whereas in a between-subjects design it would require 18 (or 16) subjects. α = 0.05, β = 0.20 (i.e. z1-α/2+z1-β = 2.80). (C) Experimental validation of predictions made by Eq. (11) on MEP amplitude (mV) measured at two different intensities (110%RMT and 120%RMT) for a within-subjects design with 10 trials per TMS intensity and 16 subjects. The session was repeated twice (Experiment 2). Each colored line represents a single subject. Paired t-test; **p < 0.01; ***p < 0.001. (D) Same as in (C) assuming a between-subjects design (i.e. two groups of 16 subjects), showing expected lower statistical power. Results are shown as box plots (horizontal lines: median (Q2), first quartile (Q1) and third quartile (Q3); whiskers: minimum and maximum value excluding outliers; outliers: points larger than Q3 + 1.5(Q3–Q1) or smaller than Q1–1.5(Q3–Q1). Unpaired t-test; *p < 0.05.

References

    1. Barker AT, Jalinous R, Freeston IL. Non-invasive magnetic stimulation of human motor cortex. Lancet. 1985;1:1106–1107. doi: 10.1016/S0140-6736(85)92413-4. - DOI - PubMed
    1. Day BL, et al. Motor cortex stimulation in intact man. 2. Multiple descending volleys. Brain. 1987;110(Pt 5):1191–1209. doi: 10.1093/brain/110.5.1191. - DOI - PubMed
    1. Rothwell JC, et al. Motor cortex stimulation in intact man. 1. General characteristics of EMG responses in different muscles. Brain. 1987;110(Pt 5):1173–1190. doi: 10.1093/brain/110.5.1173. - DOI - PubMed
    1. Di Lazzaro V, Rothwell JC. Corticospinal activity evoked and modulated by non-invasive stimulation of the intact human motor cortex. J. Physiol. 2014;592:4115–4128. doi: 10.1113/jphysiol.2014.274316. - DOI - PMC - PubMed
    1. Bestmann S, Krakauer JW. The uses and interpretations of the motor-evoked potential for understanding behaviour. Exp. brain Res. 2015;233:679–689. doi: 10.1007/s00221-014-4183-7. - DOI - PubMed

Publication types