. 2020 Dec 8;11(1):6296.
doi: 10.1038/s41467-020-20141-z.

Macrophage ATP citrate lyase deficiency stabilizes atherosclerotic plaques

Affiliations

Macrophage ATP citrate lyase deficiency stabilizes atherosclerotic plaques

Jeroen Baardman et al. Nat Commun. .

Abstract

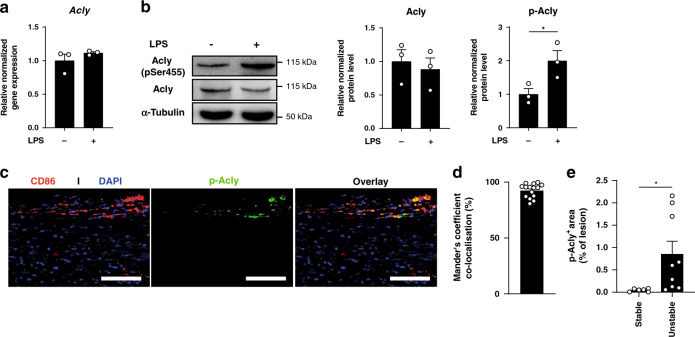
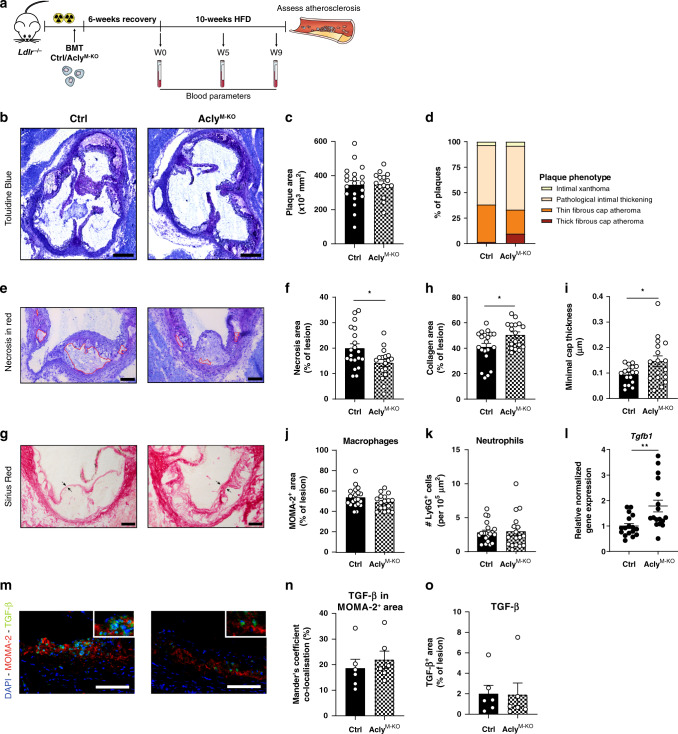
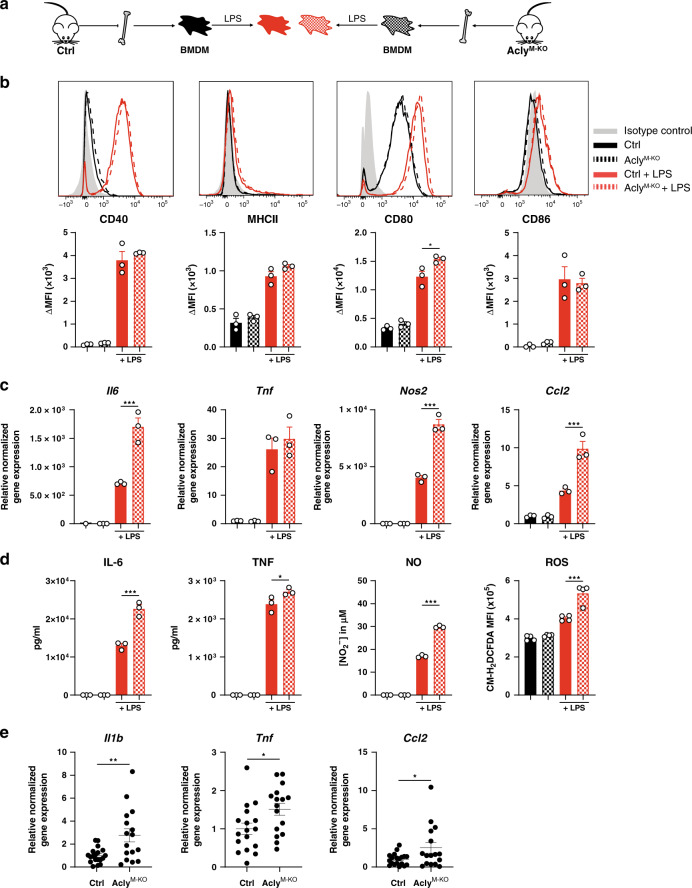
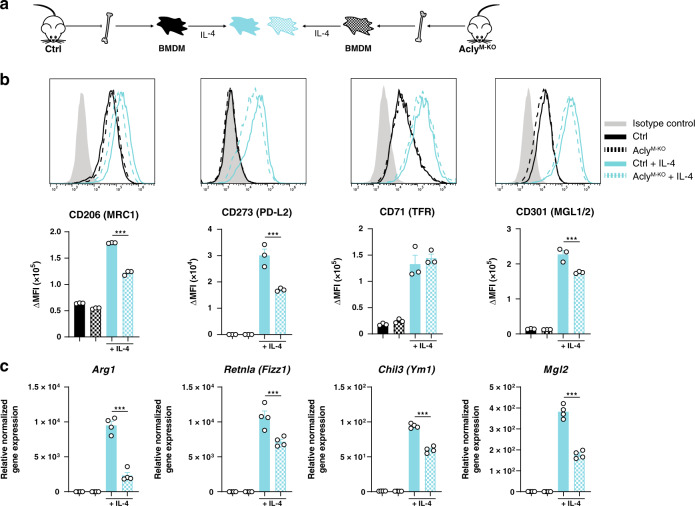
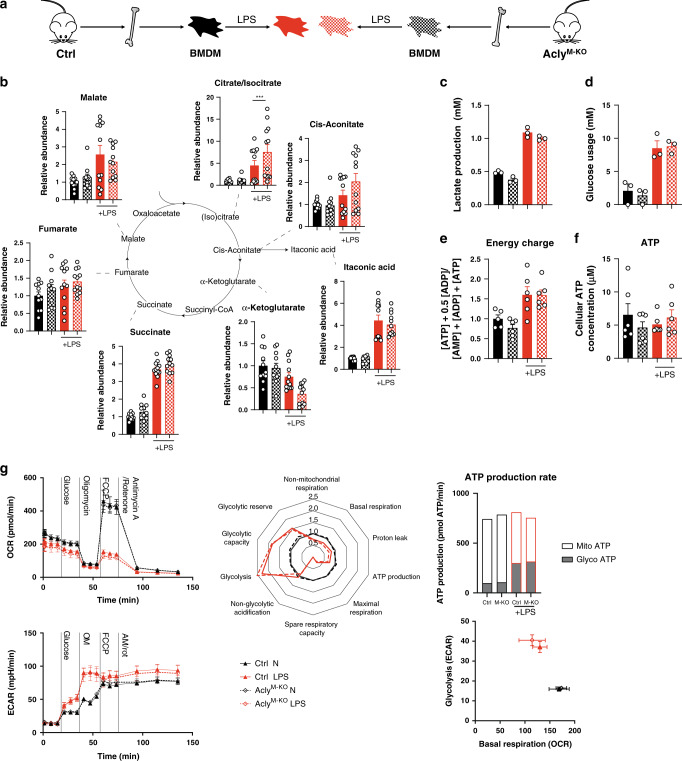
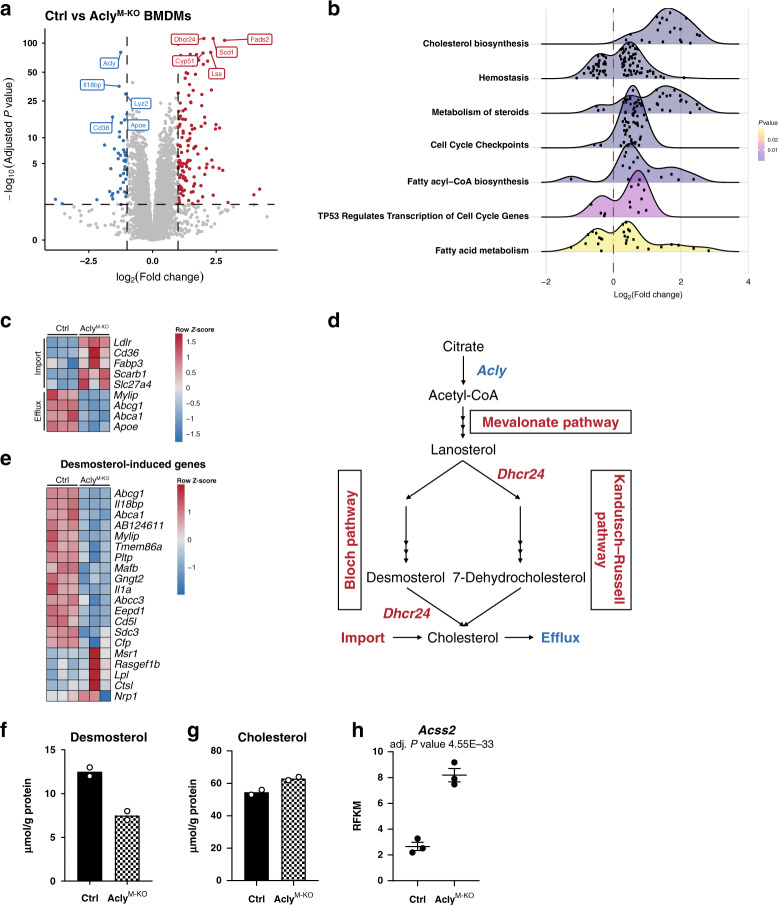
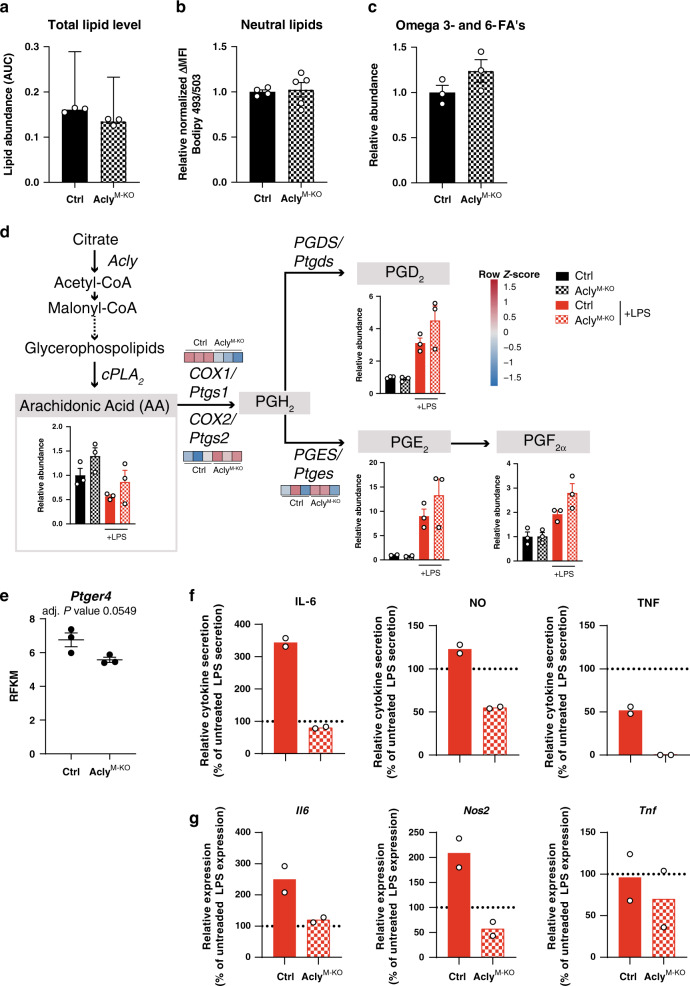
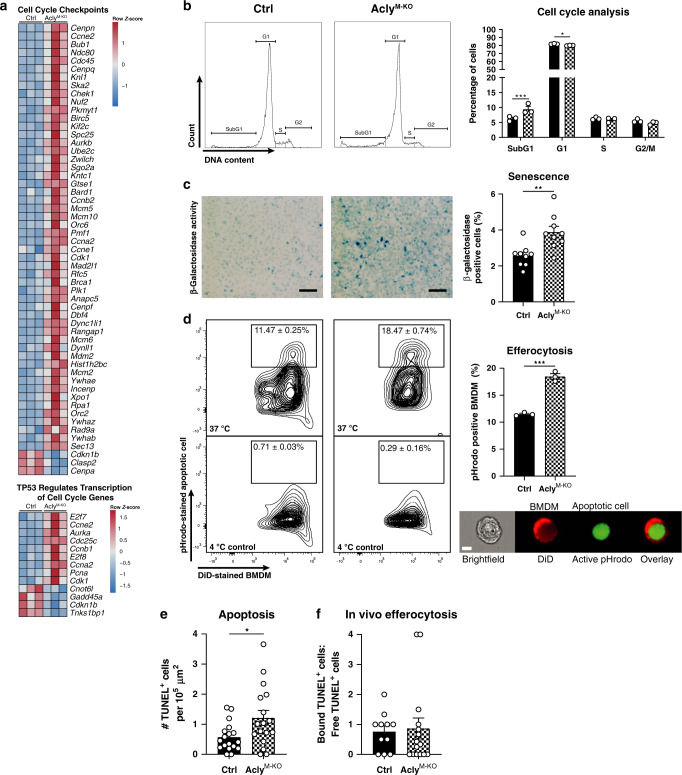
Macrophages represent a major immune cell population in atherosclerotic plaques and play central role in the progression of this lipid-driven chronic inflammatory disease. Targeting immunometabolism is proposed as a strategy to revert aberrant macrophage activation to improve disease outcome. Here, we show ATP citrate lyase (Acly) to be activated in inflammatory macrophages and human atherosclerotic plaques. We demonstrate that myeloid Acly deficiency induces a stable plaque phenotype characterized by increased collagen deposition and fibrous cap thickness, along with a smaller necrotic core. In-depth functional, lipidomic, and transcriptional characterization indicate deregulated fatty acid and cholesterol biosynthesis and reduced liver X receptor activation within the macrophages in vitro. This results in macrophages that are more prone to undergo apoptosis, whilst maintaining their capacity to phagocytose apoptotic cells. Together, our results indicate that targeting macrophage metabolism improves atherosclerosis outcome and we reveal Acly as a promising therapeutic target to stabilize atherosclerotic plaques.


Conflict of interest statement

The authors declare no competing interests.

Figures

Fig. 1
Fig. 1. Acly is phosphorylated in inflammatory conditions in vitro and in vivo.
a Relative normalized expression of Acly in unstimulated and LPS-stimulated macrophages. b Normalized protein levels from cell lysates of unstimulated and LPS-stimulated macrophages. Samples were immunoblotted with antibodies against Acly, phosphorylated Acly (p-Acly) and α-tubulin. Acly/p-Acly quantification on the blots derive from samples of the same experiment and gels/blots were processed in parallel. *P = 0.0441. c Representative immunohistochemical staining for macrophages (CD68) and p-ACLY in human plaques from 16 stable/unstable plaques. Scale bar represents 100 µm. d Quantification of colocalization, percentage of p-Acly+ macrophages overlapping with CD68+ area. e Quantification of p-Acly+ area in the lesion. *P = 0.0402. Values represent mean ± SEM (n = 3 technical replicates of three pooled mice a, n = 3 one representative image of three technical replicates of three pooled mice (b, western blot), n = 7/9 stable/unstable plaques d, e. *P < 0.05; by two-tailed Student’s t test (b, e). Source data are provided as a Source Data file (ae).
Fig. 2
Fig. 2. Acly deletion in macrophages elicits a favorable plaque phenotype.
a In order to asses atherogenesis, bone marrow cells of either control of AclyM-KO were transplanted in lethally irritated Ldlr−/− mice. Six weeks after transplantation, mice were put on a HFD for 10 weeks. b Representative toluidine blue staining of atherosclerotic plaques within the aortic roots of control and AclyM-KO mice. Scale bar represents 500 μm. c Quantification of plaque size. d Plaque phenotypes as classified by an experimental pathologist. e Toluidine blue staining of atherosclerotic lesions with necrosis indicated in red. Scale bar represents 200 μm. f Quantification of the necrotic area. *P = 0.0173. g Sirius red staining of plaques. Scale bar represents 200 μm. h Quantification of the collagen deposition. *P = 0.0201. i Minimal cap thickness was measured at the thinnest region of the fibrotic cap surrounding the necrotic core as indicated by the arrows in g. *P = 0.0292. j Quantification of MOMA-2+ area for macrophages. k Quantification of Ly6G+area for neutrophils. l Normalized expression of Tgfb1 in aortic arches of control and AclyM-KO mice. **P = 0.0038 m Representative immunohistochemical analysis of macrophages (MOMA-2) and TGF-β in mouse plaques from control or AclyM-KO mice (n = 6/6 ctrl/KO from one experiment). Scale bar represents 100 µm. n Quantification of colocalization, percentage of TGF-β+ area in MOMA-2+ area. o Quantification of TGF-β+ area in the lesion. Values represent mean ± SEM (n = 20/17 (ctrl/KO in bl), n = 6/6 (ctrl/KO in n, o). *P < 0.05; **P < 0.01 by two-tailed Student’s t test (f, h, i, l). Source data are provided as a Source Data file (c, d, f, hl, m, o).
Fig. 3
Fig. 3. Altered macrophage polarization in vitro does not explain the plaque phenotype in vivo.
a Differentiated control and AclyM-KO macrophages (BMDMs) were stimulated with LPS. b Expression of LPS-induced surface markers as measured by flow cytometry. Representative histograms and quantified surface expression (ΔMFI = [median fluorescence intensity]positive staining – [MFI]pooled control) are shown. CD80 *P = 0.0160. c Relative normalized gene expression of indicated LPS-induced genes. Il6 ***P < 0.0001, Nos2 ***P < 0.0001, Ccl2 ***P = 0.0002. d Production of IL-6 ***P < 0.0001, TNF *P = 0.0281, NO ***P < 0.0001 and ROS ***P < 0.0001. e Normalized expression of M1 genes in aortic arches of control and AclyM-KO-transplanted mice. Il1b **P = 0.0030, Tnf *P = 0.0183, Ccl2 *P = 0.0321. Values represent mean±SEM of n = 3 (bd) technical replicates of one out of three representative experiments or n = 20/17 (ctrl/KO in e). *P < 0.05; **P < 0.01, ***P < 0.001 by ordinary one-way ANOVA with Bonferroni post hoc test for multiple comparisons (bd) or two-tailed Student’s t test (e). Source data are provided as a Source Data file (be).
Fig. 4
Fig. 4. IL-4 response is decreased after Acly deletion in macrophages.
a Differentiated control and AclyM-KO macrophages (BMDMs) were stimulated with IL-4. b Expression of IL-4-induced surface markers as measured by flow cytometry. Representative histograms and quantified surface expression (ΔMFI = [median fluorescence intensity]positive staining – [MFI]pooled control) are shown. CD206 ***P < 0.0001, CD273 ***P = 0.0003, CD301 ***P = 0.0008. c Relative normalized gene expression of IL-4-induced genes. Arg1 ***P < 0.0001, Retnla ***P = 0.0004, Ym1 ***P < 0.0001. Values represent mean ± SEM of n = 3 b or n = 4 c technical replicates of one out of three representative experiments. ***P < 0.001 by ordinary one-way ANOVA with Bonferroni post hoc test for multiple comparisons (b, c). Source data are provided as a Source Data file (b, c).
Fig. 5
Fig. 5. Mitochondrial function remains unaltered in AclyM-KO BMDMs.
a Differentiated control and AclyM-KO macrophages (BMDMs) were left untreated or stimulated with LPS (b) relative abundance of TCA cycle intermediates ***P  <  0.0001. c Lactate secretion after 24 h LPS treatment. d Metabolized glucose in 24 h. e Cellular energy charge as calculated by [ATP] + .05[ADP]/([AMP] + [ADP] + [ATP]). f Cellular ATP concentration. g Seahorse analyses and extracted parameters. Values represent mean ± SEM from n  = 12 technical replicates from two combined experiments b, n =  3 technical replicates from three pooled mice from one of three representative experiments (c, d, g), n = 6 technical replicates from three pooled mice from one of two representative experiments (e, f). ***P < 0.001 by two-way ANOVA with Bonferroni post hoc test for multiple comparisons. Source data are deposited in  MTBLS2159 (b) or provided as a Source Data file (cg).
Fig. 6
Fig. 6. AclyM-KO macrophages exhibit deregulated cholesterol biosynthesis.
a Volcano plot with up- or downregulated genes in Acly-deficient macrophages (BMDMs) highlighted in red or blue, respectively. b Ridgeline plot of significantly enriched Reactome pathways. Log2FC distributions of member genes are plotted on the x axis. Color of the distributions represents enriched pathway P value. c Expression of genes involved in import/transport of cholesterol and fatty acids, and genes that promote cholesterol efflux. d Schematic view of cholesterol metabolism and the effect of Acly deficiency (red indicating upregulation; blue downregulation). e Desmosterol levels in control and Acly-deficient macrophages. f Genes previously found to be induced by desmosterol, plotted in a heatmap for control and AclyM-KO macrophages. g Cholesterol levels in control and Acly-deficient macrophages. h Acss2 expression in control and Acly-deficient macrophages. Values represent mean from n = 2 technical replicates from three pooled mice e, g, or mean ± SEM n = 3 technical replicates from three pooled mice (h). Source data are provided as a Source Data file e, g or deposited in GSE126690 (ad, f, h).
Fig. 7
Fig. 7. Deletion of Acly leads to deregulation of lipid mediators and decreased responsiveness to prostaglandin E2.
a Total sum of measured lipids by metabololipidomics. b Neutral lipids analyzed by Bodipy 493/503. c Sum of AA, DHA, EPA, AdA, LA, ALA/GLA, DPAn-3, and DGLA omega 3 and 6 fatty acids (FA’s) measured by metabololipidomics. d Lipid abundances and genes involved in prostaglandin synthesis. e Ptger4 expression in control and Acly-deficient macrophages. f Effect of PGE2 treatment on cytokine secretion in control and AclyM-KO LPS-treated BMDMs. g Effect of PGE2 treatment on cytokine secretion in control and AclyM-KO LPS-treated BMDMs. Values represent mean ± SEM (n = 3 technical replicates from three pooled mice ae), or mean (n = 2 technical replicates from three pooled mice (f, g)) Source data are provided as a Source Data file (ad, f) or deposited in GSE126690 (d, e).
Fig. 8
Fig. 8. Deletion of Acly results in increased apoptosis, growth arrest, and more-efficient efferocytosis.
a Expression of genes associated with indicated reactome pathways. b Flow cytometric analysis of control and AclyM-KO macrophages stained with propidium iodide to asses cell cycle distribution. ***P = 0.0009, *P = 0.0385. c Senescence in control and AclyM-KO BMDMs by b-galactosidase activity measurement. Scale bar represents 100 µm. **P = 0.0034. d In vitro phagocytosis of pHrodo-stained apoptotic cells by DiD-labeled control or AclyM-KO BMDMs measured by flow cytometry after incubation at 37 °C (or 4 °C as negative control) and validated by imaging flow cytometry (Imagestream, scale bar represents 7 µm). Quantification of efferocytosis at 37 °C as a percentage of DiD-positive cells that incorporated an apoptotic cell. ***P = 0.0002. e Quantification of TUNEL+ cells in lesions of Ldlr−/− mice transplanted with control or AclyM-KO bone marrow. *P = 0.0203 (f). Ratio of TUNEL+ cells bound to MAC3+ macrophages and free TUNEL+ cells. Values represent mean ± SEM (n = 3 technical replicates of one out of three representative independent experiments in bd) and n = 20/19 (ctrl/KO in e, f)). *P < 0.05; **P < 0.01, ***P < 0.001 by two-way ANOVA with Bonferroni post hoc test for multiple comparisons b or two-tailed Student’s t test (c, d). Source data are provided as a Source Data file (bf) or deposited in GSE126690 (a).

References

    1. Moore KJ, Sheedy FJ, Fisher EA. Macrophages in atherosclerosis: a dynamic balance. Nat. Rev. Immunol. 2013;13:709–721. doi: 10.1038/nri3520. - DOI - PMC - PubMed
    1. Tabas I, Bornfeldt KE. Macrophage phenotype and function in different stages of atherosclerosis. Circ. Res. 2016;118:653–667. doi: 10.1161/CIRCRESAHA.115.306256. - DOI - PMC - PubMed
    1. Feng B, et al. The endoplasmic reticulum is the site of cholesterol-induced cytotoxicity in macrophages. Nat. Cell Biol. 2003;5:781–792. doi: 10.1038/ncb1035. - DOI - PubMed
    1. Yurdagul A, Jr., Doran AC, Cai B, Fredman G, Tabas IA. Mechanisms and consequences of defective efferocytosis in atherosclerosis. Front. Cardiovasc. Med. 2017;4:86. doi: 10.3389/fcvm.2017.00086. - DOI - PMC - PubMed
    1. Silvestre-Roig C, et al. Atherosclerotic plaque destabilization: mechanisms, models, and therapeutic strategies. Circ. Res. 2014;114:214–226. doi: 10.1161/CIRCRESAHA.114.302355. - DOI - PubMed

Publication types

MeSH terms