. 2020 Dec 8;10(1):21487.
doi: 10.1038/s41598-020-78130-7.

Multiscale 3D phenotyping of human cerebral organoids

Affiliations

Multiscale 3D phenotyping of human cerebral organoids

Alexandre Albanese et al. Sci Rep. .

Abstract

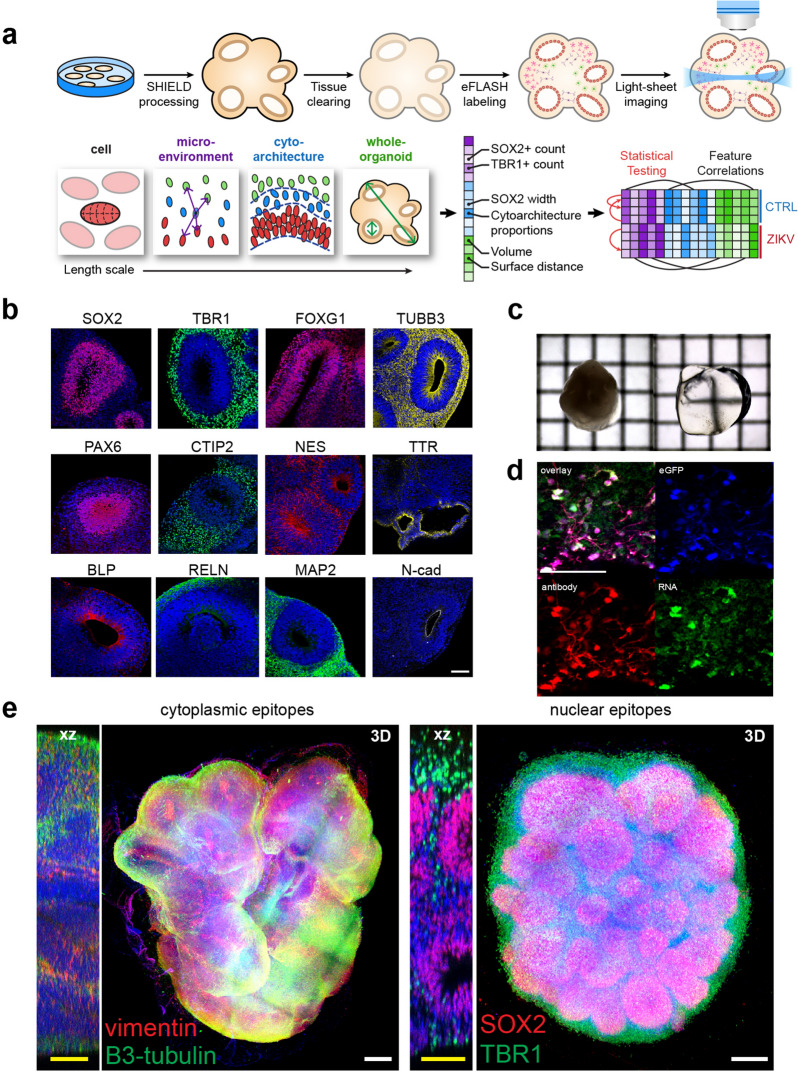
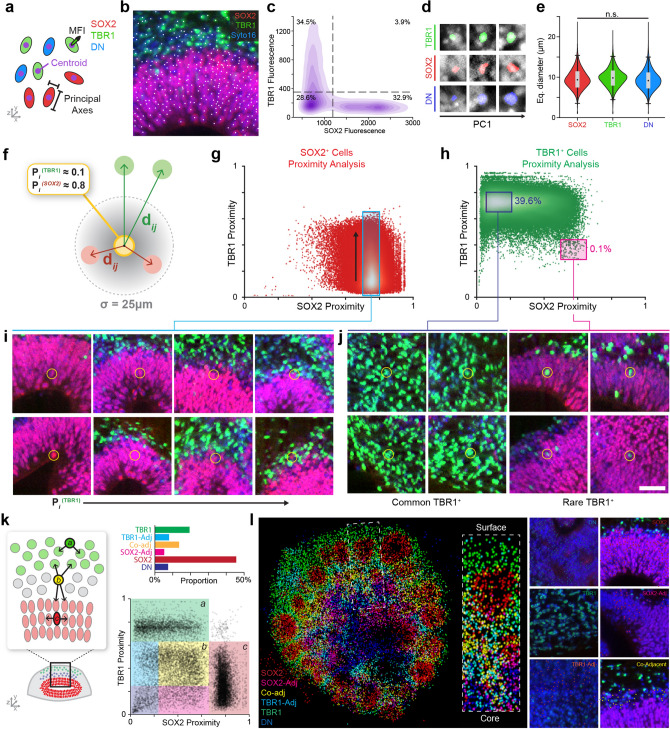
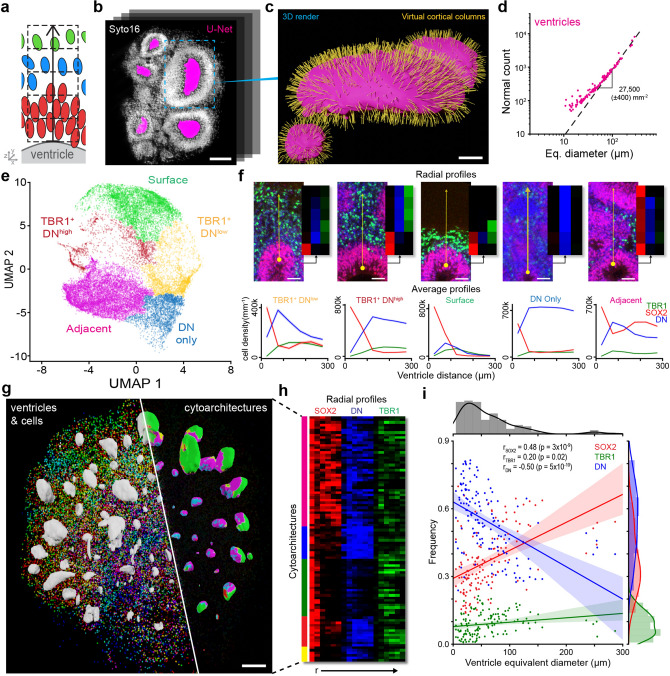
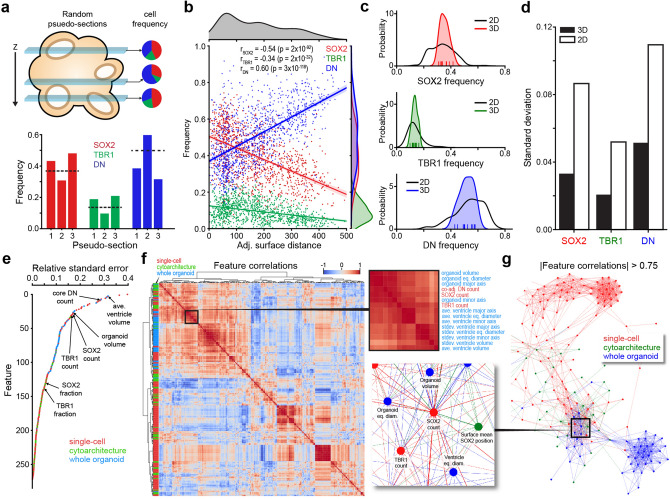
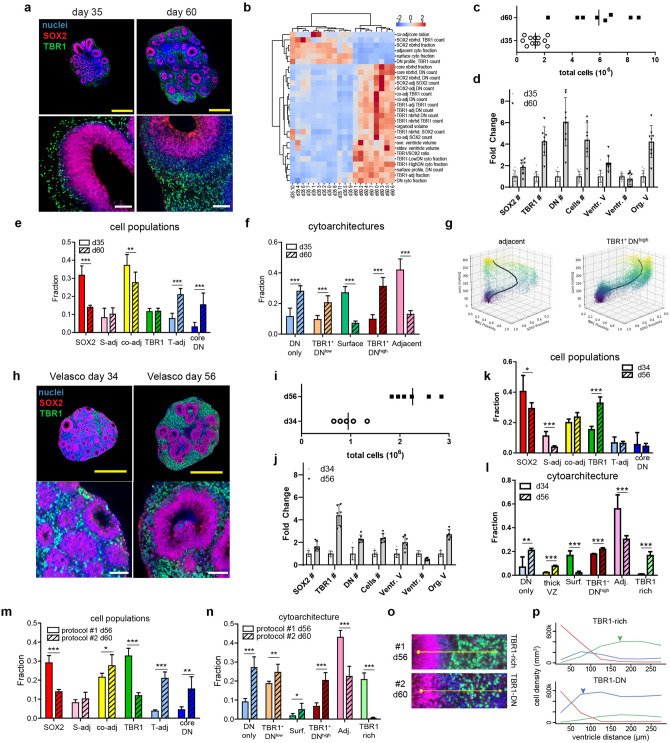
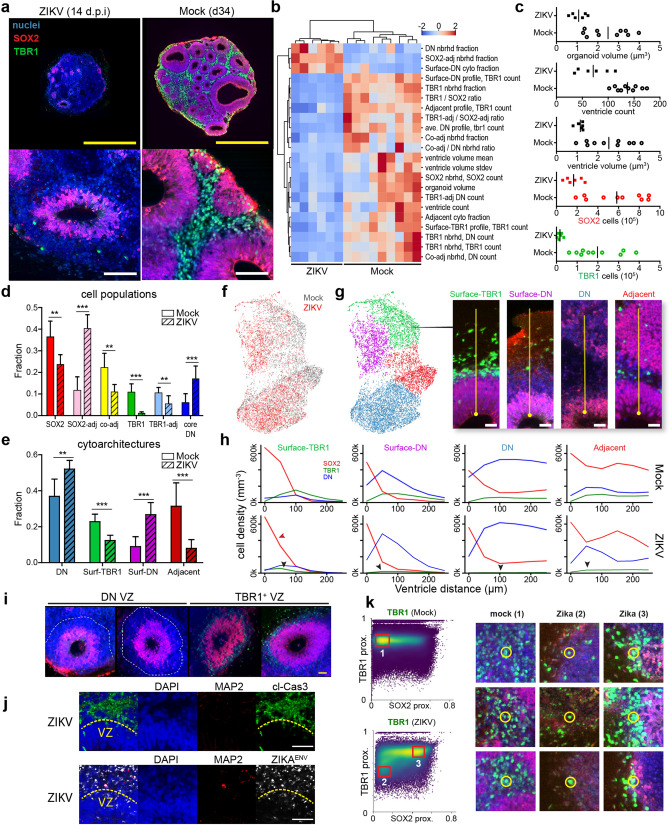
Brain organoids grown from human pluripotent stem cells self-organize into cytoarchitectures resembling the developing human brain. These three-dimensional models offer an unprecedented opportunity to study human brain development and dysfunction. Characterization currently sacrifices spatial information for single-cell or histological analysis leaving whole-tissue analysis mostly unexplored. Here, we present the SCOUT pipeline for automated multiscale comparative analysis of intact cerebral organoids. Our integrated technology platform can rapidly clear, label, and image intact organoids. Algorithmic- and convolutional neural network-based image analysis extract hundreds of features characterizing molecular, cellular, spatial, cytoarchitectural, and organoid-wide properties from fluorescence microscopy datasets. Comprehensive analysis of 46 intact organoids and ~ 100 million cells reveals quantitative multiscale "phenotypes" for organoid development, culture protocols and Zika virus infection. SCOUT provides a much-needed framework for comparative analysis of emerging 3D in vitro models using fluorescence microscopy.


Conflict of interest statement

K.C. is a cofounder of LifeCanvas Technologies, a startup that provides solutions for 3D tissue processing and analysis.

Figures

Figure 1
Figure 1
Pipeline for multiscale hyperdimensional analysis of organoids. (a) Scheme showing the pipeline where cerebral organoids are grown from stem cells, fixed in 4% PFA, then post-fixed with SHIELD poly-epoxide crosslinker. Organoids are then delipidated and labeled with antibodies using eFLASH for rapid uniform staining. An axially sweeping light-sheet microscope was used for rapid (15 min per organoid) imaging of cleared intact organoids at 0.65 × 0.65 × 2.0 µm voxel resolution. Quantitative analysis applies automated algorithms and convolutional neural networks to measure multiscale features. We applied this pipeline for unbiased high-dimensional phenotyping of different experimental models. (b) SHIELD is compatible with many common markers for cerebral organoids. Data show antibody staining of SHIELD-cleared day 45 organoids using antibodies listed in Supplementary Table 1. (c) After delipidation and immersion in refractive index matching solution (dPROTOS), organoids are optically transparent and can be imaged with standard confocal microscopy. Grid = 1 mm. (d) SHIELD preserves endogenous fluorescence, mRNA and protein epitopes. Images show an organoid section containing GFP-labeled cells co-stained with anti-GFP antibody and a GFP mRNA FISH probe (e) A 3D render of day 35 cerebral organoid stained using Syto16 (nuclear dye, blue), β3-tubulin (neuronal marker, green) and vimentin (glial marker, red) or Syto16 (nuclear dye, blue); TBR1 (postmitotic neuron, green); SOX2 (progenitor cells, red). Images show a 3D render and a 2D view of the XZ plane to show whole-tissue labeling. Scale bars (yellow, 100 µm; white, 200 µm).
Figure 2
Figure 2
Single-cell detection and analysis. (a) Scheme of single-cell morphological characterization. (b) Demonstration of automated nuclei detection in 3D datasets. Syto16 in blue, SOX2 in red, TBR1 in green. Scale bar, 100 µm. (c) Expression of TBR1 and SOX2 in individual nuclei. Density plot shows gating parameters and population frequency. (d) Representative images of segmented nuclei for each cell type showing a range of morphological features sorted by principal component analysis. (e) Morphological analysis of individual nuclei shows a consistent equivalent diameter ~ 10 µm for all cell types. (f) Detailed scheme of the proximity analysis, which quantifies the distance of each cell’s nearest SOX2 and TBR1 cells using a 25 µm radius to normalize proximities. The proximity score between 0 (distant) and 1 (adjacent) reflects the cell’s spatial context as a function of progenitors and mature neurons. (g) Proximity analysis of SOX2 cells shows high proximity to other SOX2 cells. (h) Proximity analysis of TBR1 cells shows a high proximity to other TBR1 cells and a rare population of cells with a high SOX2 proximity. (i) Images showing the change in SOX2 cell position within the VZ as they increase their proximity score to TBR1 cells. Low proximity to TBR1 (left) reflects cells lining the ventricle whereas higher proximity shows cells at the edge of the ventricular zone (right). (j) Representative replicate images of TBR1 cells found in the major and rare populations of the proximity analysis. Scale bar = 50 µm. (k) Scheme of spatial context analysis showing the proximity of single cells to the nearest SOX2 and TBR1 cells. Bar graph shows the results of spatial context analysis shown below with “proximity score gates” to define six distinct populations. Gates captured > 99% of all cells. (l) Middle optical section of a day 35 organoid dataset showing detected cells colored according to their spatial context subcategorization. Inset shows zoomed view of dotted rectangle region. Right subpanels show instances of six different subpopulations identified by SCOUT.
Figure 3
Figure 3
SCOUT analysis of regional architectures. (a) Scheme of automated cytoarchitecture analysis. We quantified radial organization of cell populations around ventricles using “virtual cortical columns” 50 µm in diameter and 300 µm high, perpendicular to the ventricle surface. (b) Demonstration of automated ventricle segmentation using U-Net convolutional neural network. Representative optical section of a volumetric dataset with detected ventricles in magenta. (c) A 3D render of ventricle highlighted in panel B with normals used to orient virtual cortical columns shown in yellow. (d) Graph showing that the total number of normals per ventricle depends on the ventricle’s surface area. (e) UMAP embedding of detected cytoarchitectures in a single organoid color-coded according to each cluster. (f) Representative image and average profile plot of individual cytoarchitecture clusters showing the radial distribution of SOX2 (red), double negatives (blue) and TBR1 (green) cells. Scale bar, 50 µm (g) 3D render of segmented cells and ventricles from a day 35 organoid. On the left side ventricles are white and six cell populations are colored according to the index in Fig. 2l: SOX2 in red, SOX2-adjacent in magenta, co-adjacent in yellow, TBR1-adjacent in cyan, TBR1 in green and core DN in blue. On the right, we mapped the detected cytoarchitectures on the surface of rendered ventricles using the colors in (f). Scale bar = 200 µm (h) Three-channel heat map from 100 random cytoarchitectures. Each row shows the number of cells detected in all six 50 µm increments moving away from the ventricle surface. Intensity of red, blue and green represent SOX2, DN and TBR1, respectively. (i) The frequency of SOX2, DN and TBR1 cells detected in a ventricle’s virtual cortical columns correlates with the ventricle equivalent diameter. Strongest correlation occurs for decreased DN and increased SOX2 in larger ventricles.
Figure 4
Figure 4
Whole-organoid analysis for unbiased quantitative studies. (a) Scheme (top) and analysis of three different 100 µm pseudo-sections from a 3D dataset. Pie charts (right) show the variable depth-dependent cell frequency for individual slices. Bottom shows the estimated cell frequency for each cell type with the actual whole-organoid frequency (dotted line). (b) Analysis of cell frequencies for 1187 segmented ventricles pooled from 12 day 35 organoids. Cell frequency for each ventricle was determined by combining the counts of cells detected in all “virtual cortical columns” used for cytoarchitecture analysis. (c) Comparison of pseudo-slice heterogeneity with biological inter-organoid variability. Each histogram shows the distribution of 10,000 pseudo-sections. 100 µm thick for 12 organoids (black) versus the distribution of whole-organoid frequency in different replicates (colored histogram, ticks show independent organoid values). (d) Comparison of cell frequency standard deviation for the pseudo-sections sampling variability (2D) versus whole-organoid biological variability (3D) in 12 organoids. (e) Comparison of the relative standard error for 276 multiscale features in 12 ‘day 35’ organoid replicates where each dot is colored based on to the scale of its analysis. (f) Heat map of Pearson’s correlation coefficient investigating the relationship between the 276 multiscale features and their variation in  ‘day 35’ organoid replicates. Right, shows the cropped region where we see a combination of single-cell (red) and whole-organoid (blue) features where r > 0.88. (g) Network of feature correlation when the absolute Pearson’s correlation coefficient is > 0.75. Cropped region shows the same multiscale correlation as the heat map in panel F. The SOX2 cell count and organoid volume were the most central nodes in this cluster, both having a degree of 30.
Figure 5
Figure 5
Hyper-dimensional analysis of multiscale changes during cerebral organoid development. (a) Representative image of day 35 and day 60 undirected organoids taken from volumetric datasets. Scale bars yellow = 1 mm and white = 100 µm (b) Heat map outlining major differences between day 35 (n = 12) versus day 60 (n = 8) organoids. (c) Dot plot showing total cell counts for all organoid replicates in each age group. (d) Fold-change in total cells, average ventricle volume, and total counts of cell populations. (e) Average frequency of cell subpopulations and (f) cytoarchitecture clusters in different age groups (g) Analysis of cell proximity to SOX2 and TBR1 in “adjacent” (left) and “TBR1, DNhigh” (right) as a function of the distance from the ventricle surface. (h) Representative image of Velasco organoids at day 34 (n = 5) and day 56 (n = 6) taken from volumetric datasets. Scale bars: yellow = 1 mm and white = 100 µm (i) Dot plot showing total cell counts of Velasco organoid replicates in each age group. (j) Fold-change in total cells, average ventricle volume, and total counts of antibody-labeled subsets in Velasco organoids. (k) Average frequency of cell subpopulations and (l) cytoarchitecture clusters in different age groups of Velasco organoids. (m) Comparative analysis of cell subsets in day 60 organoids from panel a (protocol #1) and d56 Velasco patterned organoids from panel h (protocol #2). (n) Comparison of cytoarchitecture clusters in protocols 1 and 2. (o) Representative image of cytoarchitecture most common in protocol 1 (TBR1-rich) and protocol 2 (TBR1+DNhigh) organoids. Arrow is a virtual cortical column 300 µm in length. (p) Radial distribution of SOX2 (red), double negatives (blue) and TBR1 (green) cells in the cytoarchitectures shown in subpanel o. Arrows show the higher TBR1 frequency (green) and DN band between SOX2 and TBR1 (blue). [***p < 0.001, **p < 0.01, *p < 0.05].
Figure 6
Figure 6
Hyper-dimensional analysis of multiscale pathology caused by Zika virus infection. (a) Representative image of age-matched day 34 mock and Zika virus-infected organoid (14 days post-infection) taken from volumetric datasets. Scale bar = 1 mm. (b) Heat map outlining major differences between nine ‘mock’ vs. six ‘Zika-infected’ organoids. (c) Dot plots showing organoid volume, ventricle count, ventricle volume, and total counts of SOX2 and TBR1 cells. (d) Comparison of cell subpopulation frequencies (***p < 0.001, **p < 0.01). (e) Comparison of cytoarchitecture frequencies (***p < 0.001, **p < 0.01). (f) UMAP embedding of the cytoarchitectures detected in mock (grey) and Zika-infected organoids (red) showing a general shift in cytoarchitecture. (g) UMAP embedding of cytoarchitecture clusters with representative images. Scale bar = 50 µm (h) Average profile plot of mock (top row) and Zika infected (bottom row) cytoarchitecture clusters showing the radial distribution of SOX2 (red), double negatives (blue) and TBR1 (green) cells. Arrow heads indicate the thinning of the SOX2 VZ (red) and the loss of TBR1 cells (black) in response to Zika infection. (i) Images of ventricles from Zika-infected organoids showing either a thick layer of DN cells or thin layer of TBR1 cells surrounding the SOX2 cells of the VZ. Scale bar = 50 µm. (j) Antibody staining of Zika infected organoids 14 dpi showing that the majority of cells outside the VZ are apoptotic (cleaved-Caspase-3 in green) and infected with Zika (Zika Envelope protein in white). (k) Left: Proximity scores of TBR1 cells from all mock- (top) and Zika-infected (bottom) organoids. Right: representative images corresponding to segmented cells in the regions selected the dot plots. Yellow circle shows the segmented cell. Scale bar = 50 µm.

References

    1. Kadoshima T, et al. Self-organization of axial polarity, inside-out layer pattern, and species-specific progenitor dynamics in human ES cell-derived neocortex. Proc. Natl. Acad. Sci. 2013;110:20284–20289. doi: 10.1073/pnas.1315710110. - DOI - PMC - PubMed
    1. Lancaster MA, et al. Cerebral organoids model human brain development and microcephaly. Nature. 2013;501:373–379. doi: 10.1038/nature12517. - DOI - PMC - PubMed
    1. Mariani J, Vittoria M, Palejev D, Tomasini L, Coppola G, Szekely AM, Horvath TL, Vaccarino MV. Modeling human cortical development in vitro using induced pluripotent stem cells. Proc. Natl. Acad. Sci. 2012;109:12770–12775. doi: 10.1073/pnas.1202944109. - DOI - PMC - PubMed
    1. Paşca AM, et al. Functional cortical neurons and astrocytes from human pluripotent stem cells in 3D culture. Nat. Methods. 2015;12:671–678. doi: 10.1038/nmeth.3415. - DOI - PMC - PubMed
    1. Quadrato G, et al. Cell diversity and network dynamics in photosensitive human brain organoids. Nature. 2017;545:48–53. doi: 10.1038/nature22047. - DOI - PMC - PubMed

Publication types

MeSH terms