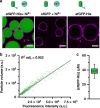
Programmed spatial organization of biomacromolecules into discrete, coacervate-based protocells
- PMID: 33293610
- PMCID: PMC7722712
- DOI: 10.1038/s41467-020-20124-0
Programmed spatial organization of biomacromolecules into discrete, coacervate-based protocells
Abstract
The cell cytosol is crowded with high concentrations of many different biomacromolecules, which is difficult to mimic in bottom-up synthetic cell research and limits the functionality of existing protocellular platforms. There is thus a clear need for a general, biocompatible, and accessible tool to more accurately emulate this environment. Herein, we describe the development of a discrete, membrane-bound coacervate-based protocellular platform that utilizes the well-known binding motif between Ni2+-nitrilotriacetic acid and His-tagged proteins to exercise a high level of control over the loading of biologically relevant macromolecules. This platform can accrete proteins in a controlled, efficient, and benign manner, culminating in the enhancement of an encapsulated two-enzyme cascade and protease-mediated cargo secretion, highlighting the potency of this methodology. This versatile approach for programmed spatial organization of biologically relevant proteins expands the protocellular toolbox, and paves the way for the development of the next generation of complex yet well-regulated synthetic cells.
Conflict of interest statement
The authors declare no competing interests.
Figures


Similar articles
-
Physicochemical Characterization of Polymer-Stabilized Coacervate Protocells.Chembiochem. 2019 Oct 15;20(20):2643-2652. doi: 10.1002/cbic.201900195. Epub 2019 Jul 25. Chembiochem. 2019. PMID: 31012235 Free PMC article.
-
Peptide-Based Coacervate Protocells with Cytoprotective Metal-Phenolic Network Membranes.J Am Chem Soc. 2023 Nov 8;145(44):24108-24115. doi: 10.1021/jacs.3c07748. Epub 2023 Oct 3. J Am Chem Soc. 2023. PMID: 37788442
-
Supramolecular Nanoscaffolds within Cytomimetic Protocells as Signal Localization Hubs.J Am Chem Soc. 2020 May 20;142(20):9106-9111. doi: 10.1021/jacs.0c01732. Epub 2020 May 7. J Am Chem Soc. 2020. PMID: 32356660 Free PMC article.
-
Evolving protocells to prototissues: rational design of a missing link.Biochem Soc Trans. 2013 Oct;41(5):1159-65. doi: 10.1042/BST20130135. Biochem Soc Trans. 2013. PMID: 24059502 Review.
-
Coacervate Microdroplets as Synthetic Protocells for Cell Mimicking and Signaling Communications.Small Methods. 2023 Dec;7(12):e2300042. doi: 10.1002/smtd.202300042. Epub 2023 Mar 12. Small Methods. 2023. PMID: 36908048 Review.
Cited by
-
DNA-Mediated Protein Shuttling between Coacervate-Based Artificial Cells.Angew Chem Int Ed Engl. 2022 Apr 19;61(17):e202115041. doi: 10.1002/anie.202115041. Epub 2022 Feb 26. Angew Chem Int Ed Engl. 2022. PMID: 35133040 Free PMC article.
-
Self-assembly of stabilized droplets from liquid-liquid phase separation for higher-order structures and functions.Commun Chem. 2024 Apr 9;7(1):79. doi: 10.1038/s42004-024-01168-5. Commun Chem. 2024. PMID: 38594355 Free PMC article. Review.
-
Reaction-Diffusion Patterning of DNA-Based Artificial Cells.J Am Chem Soc. 2022 Sep 28;144(38):17468-17476. doi: 10.1021/jacs.2c06140. Epub 2022 Sep 14. J Am Chem Soc. 2022. PMID: 36103297 Free PMC article.
-
Enzymatic Reaction Network-Driven Polymerization-Induced Transient Coacervation.Angew Chem Int Ed Engl. 2024 Dec 10;64(11):e202421620. doi: 10.1002/anie.202421620. Online ahead of print. Angew Chem Int Ed Engl. 2024. PMID: 39655501 Free PMC article.
-
Modulation of Protein-Protein Interactions with Molecular Glues in a Synthetic Condensate Platform.J Am Chem Soc. 2025 Feb 12;147(6):5386-5397. doi: 10.1021/jacs.4c17567. Epub 2025 Jan 28. J Am Chem Soc. 2025. PMID: 39874979 Free PMC article.
References
Publication types
MeSH terms
Substances
LinkOut - more resources
Full Text Sources

