. 2021 Feb;40(5):951-963.
doi: 10.1038/s41388-020-01581-9. Epub 2020 Dec 8.

MicroRNA-155 contributes to plexiform neurofibroma growth downstream of MEK

Affiliations

MicroRNA-155 contributes to plexiform neurofibroma growth downstream of MEK

Youjin Na et al. Oncogene. 2021 Feb.

Abstract

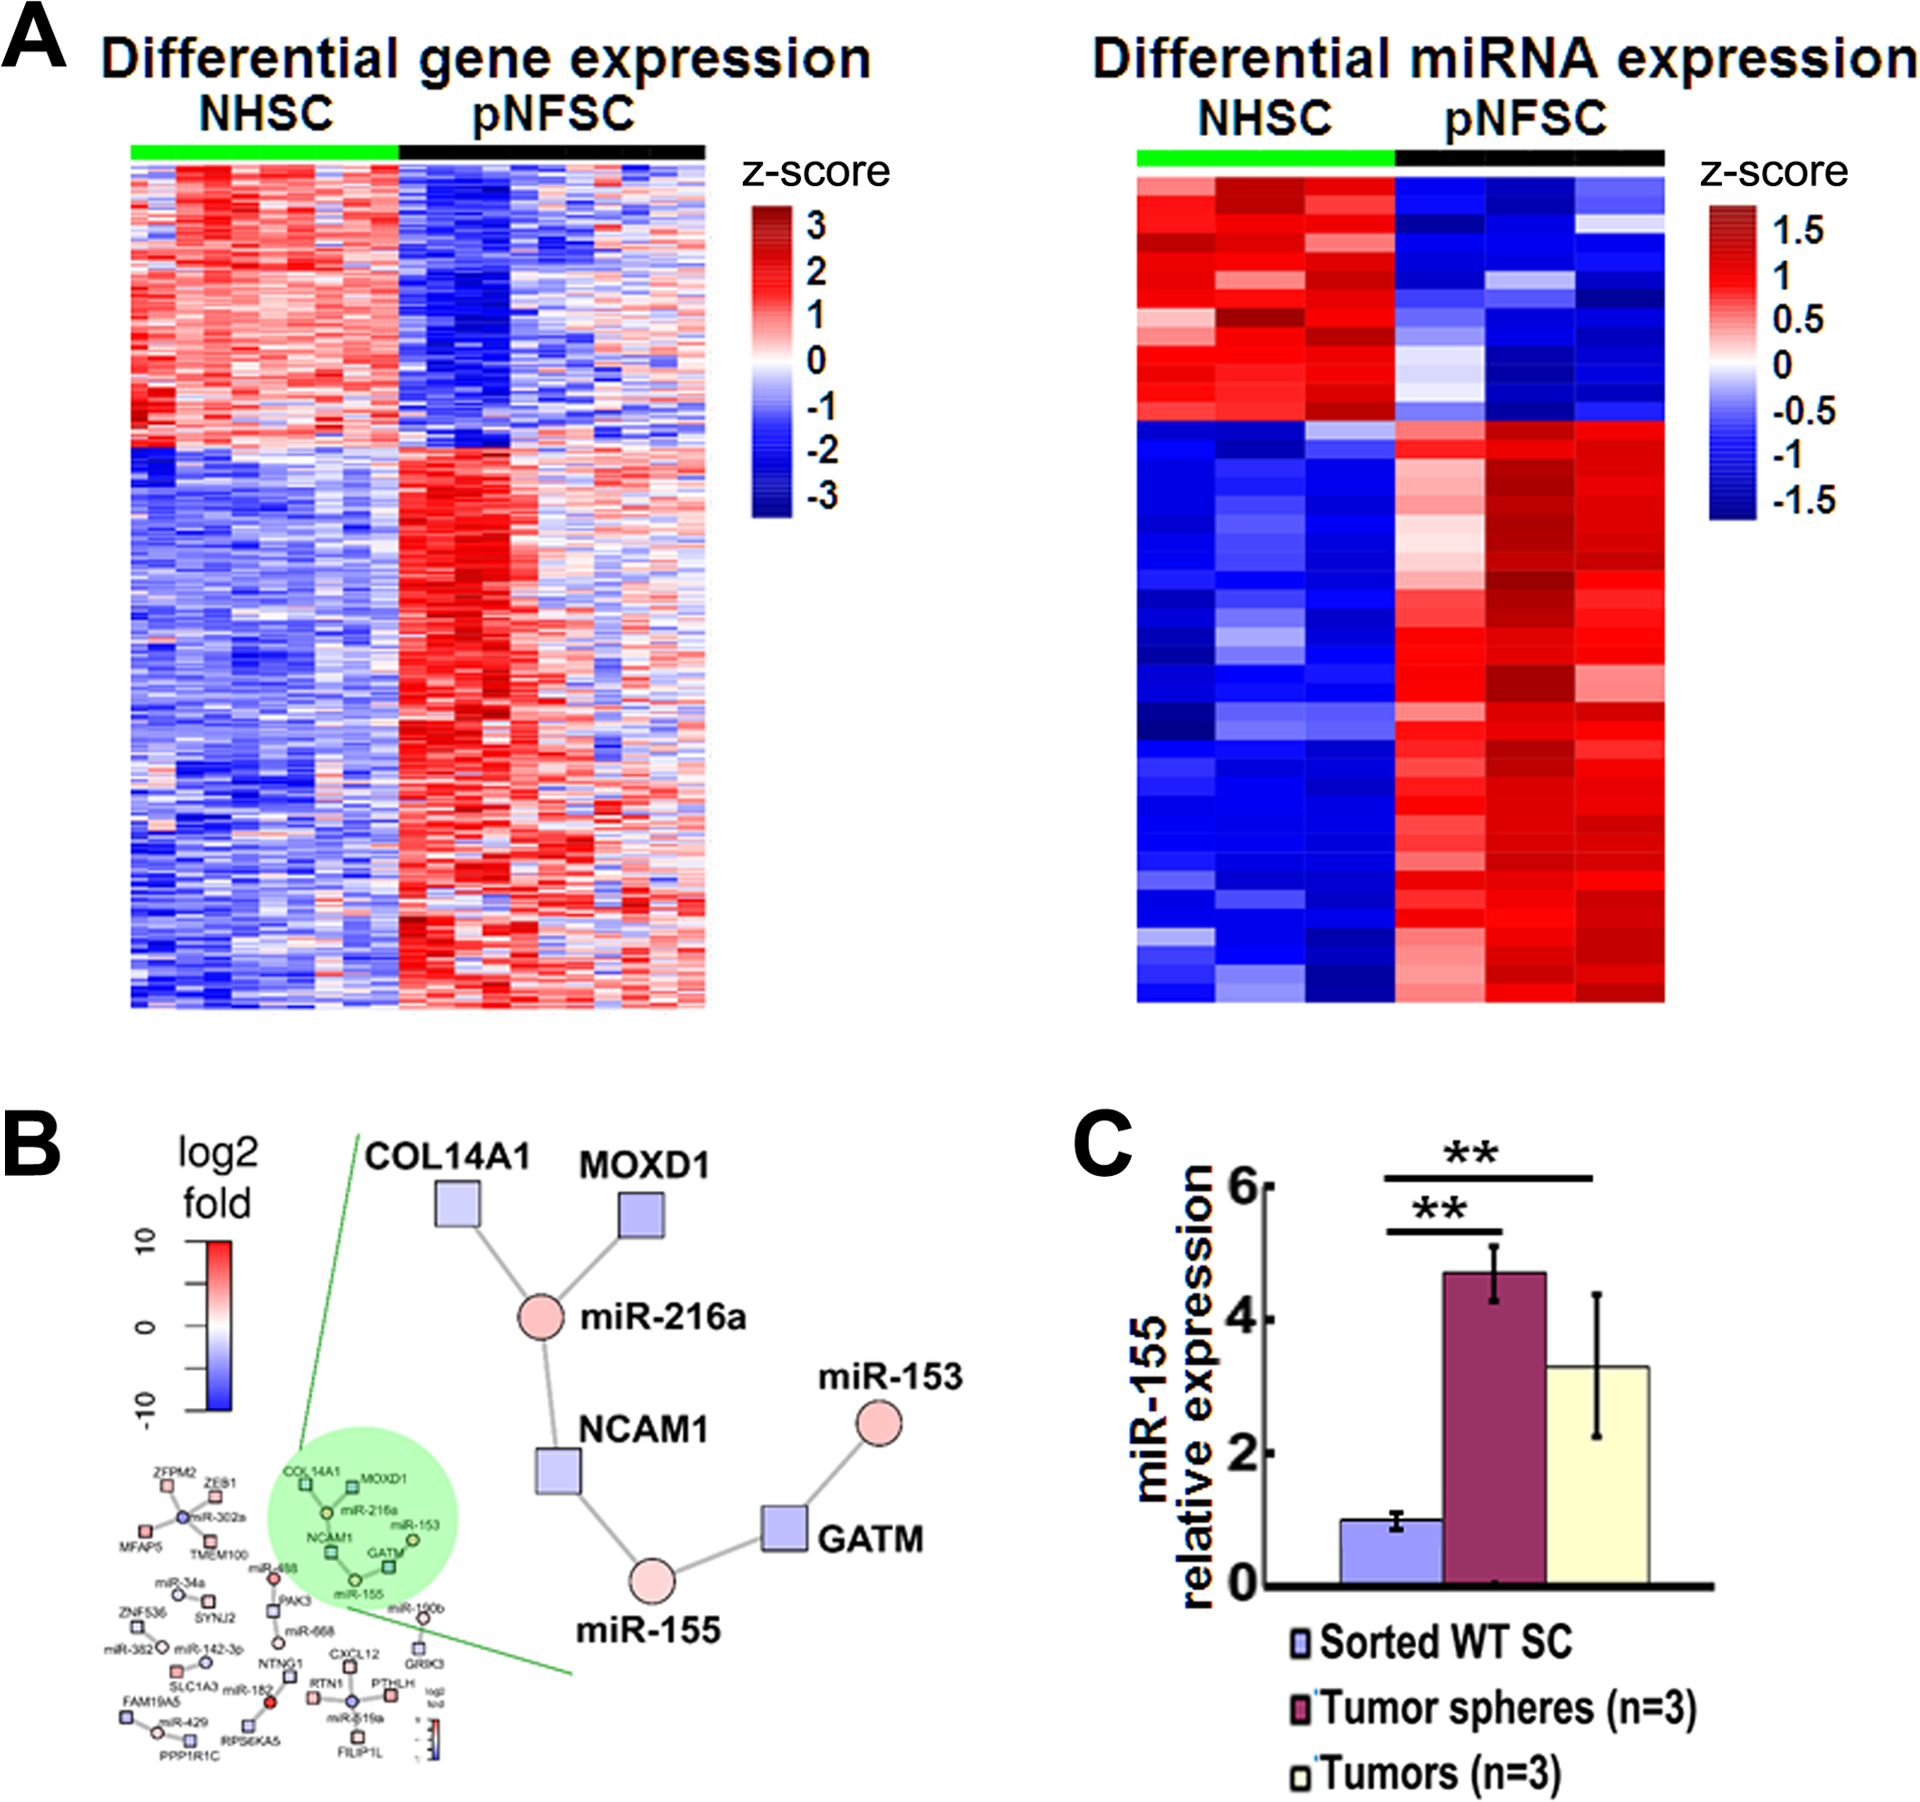
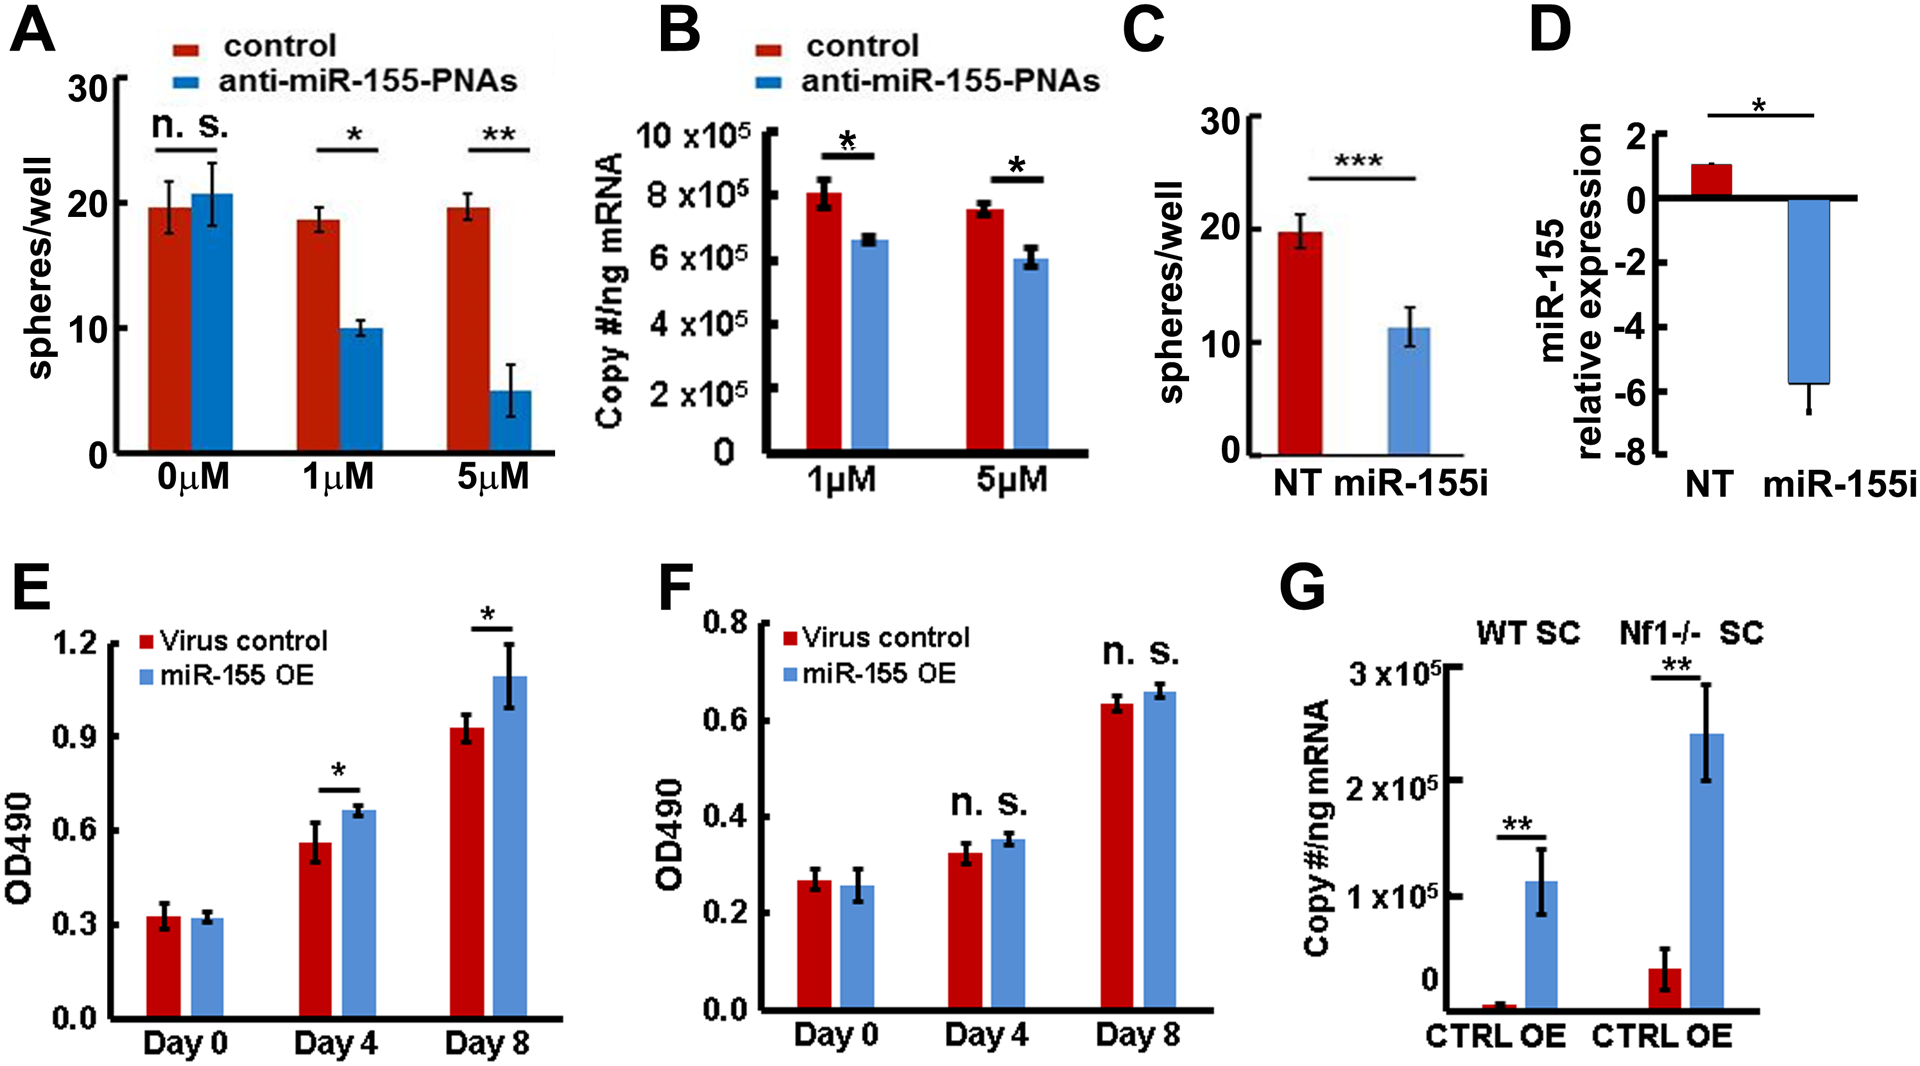
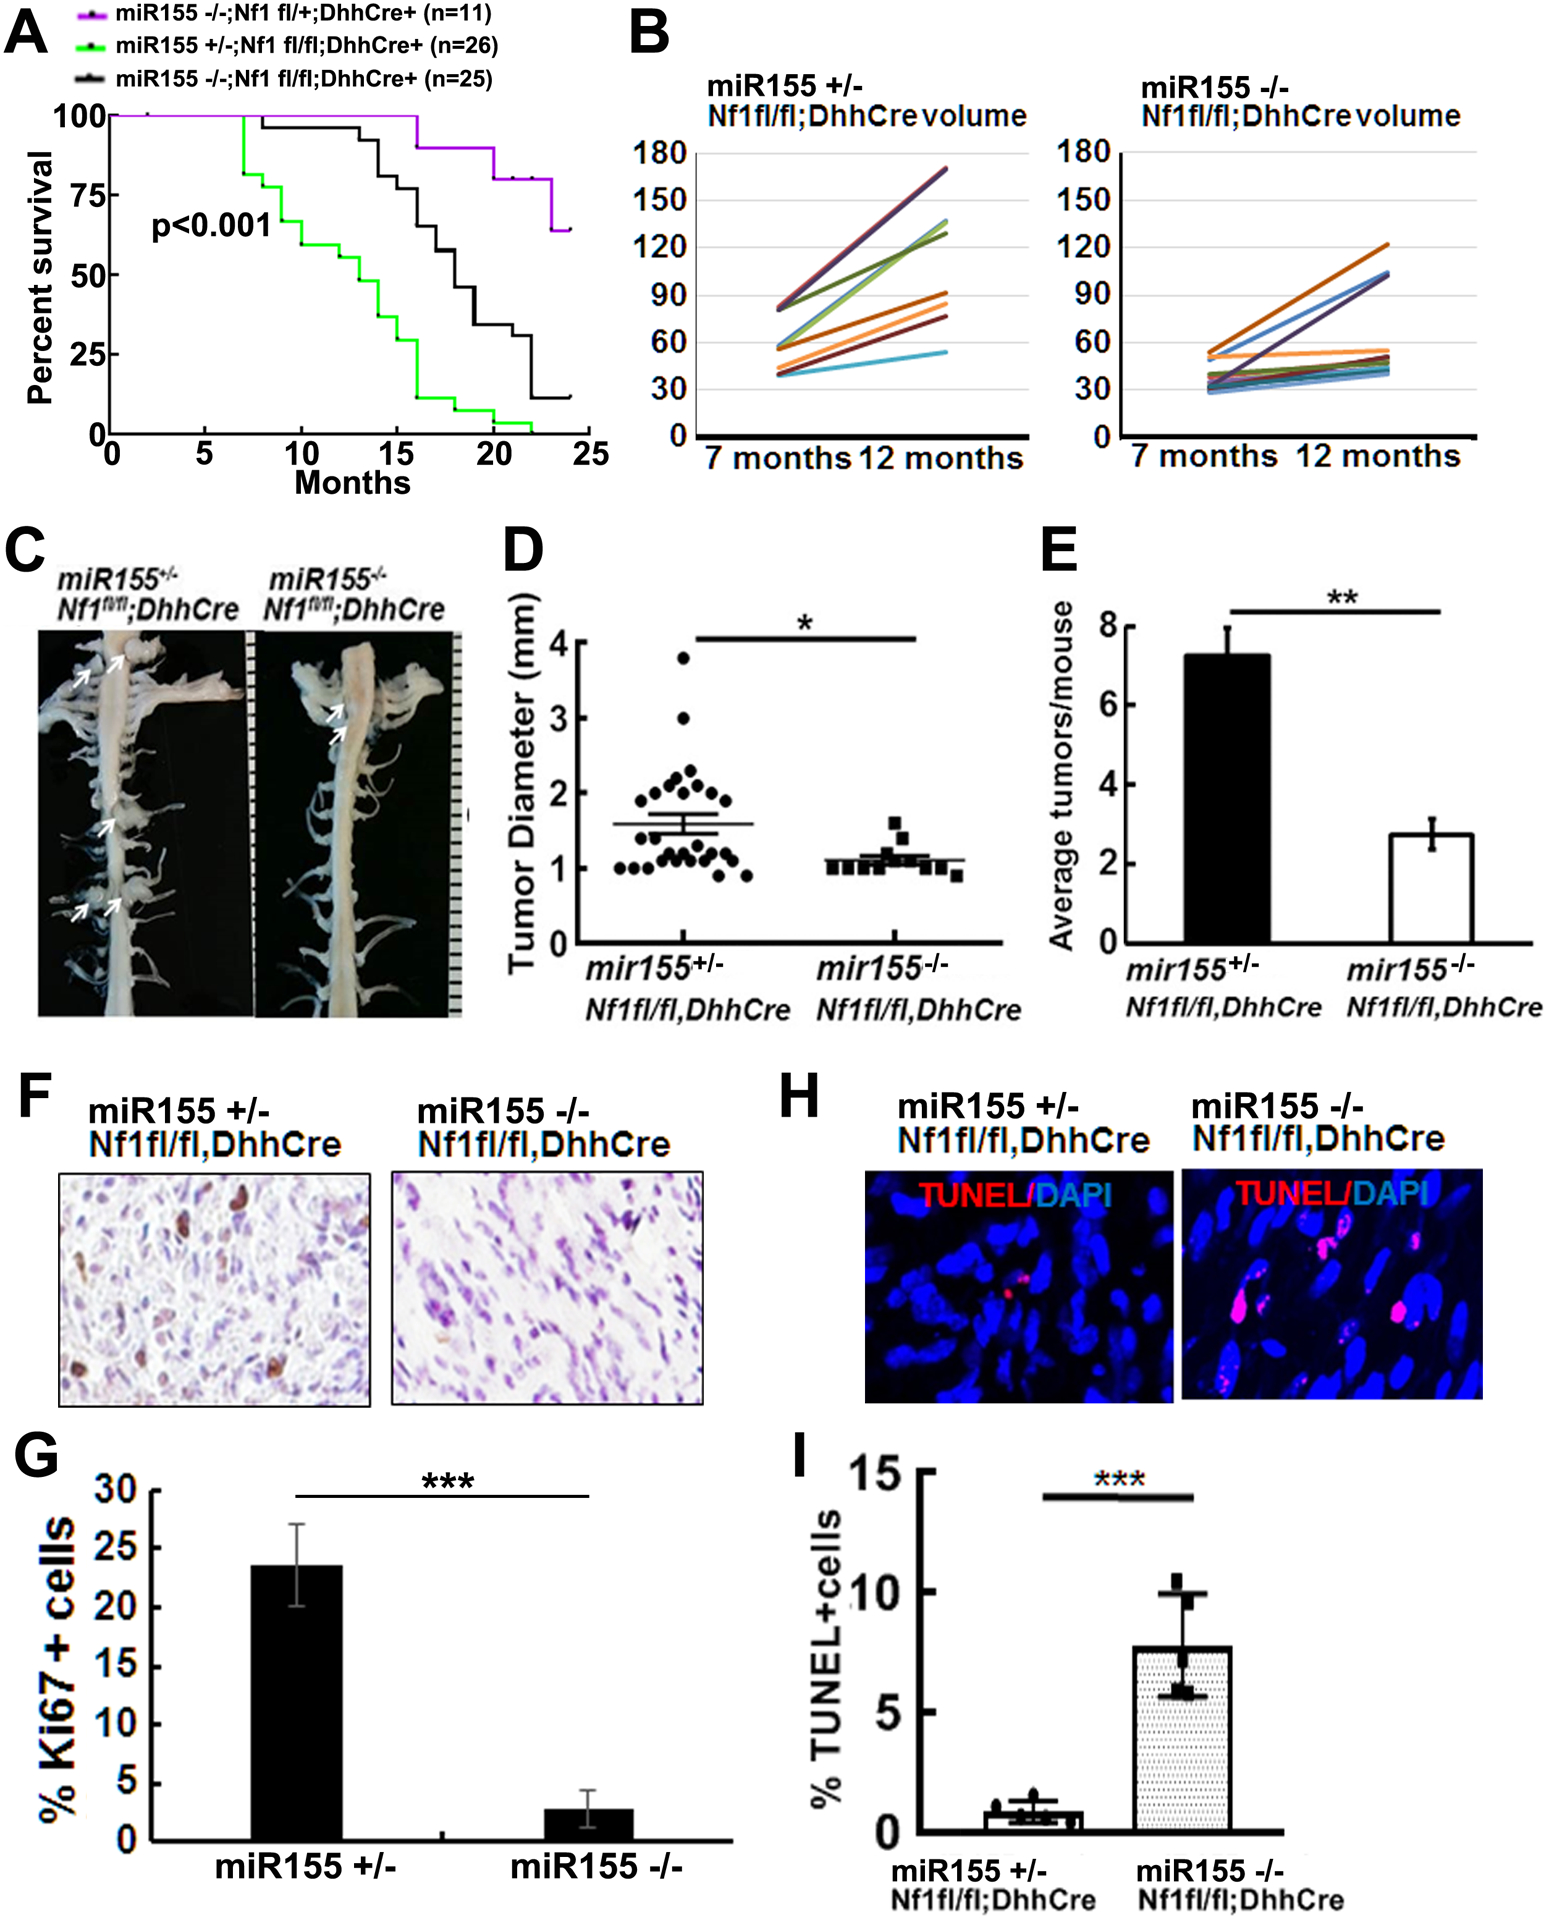
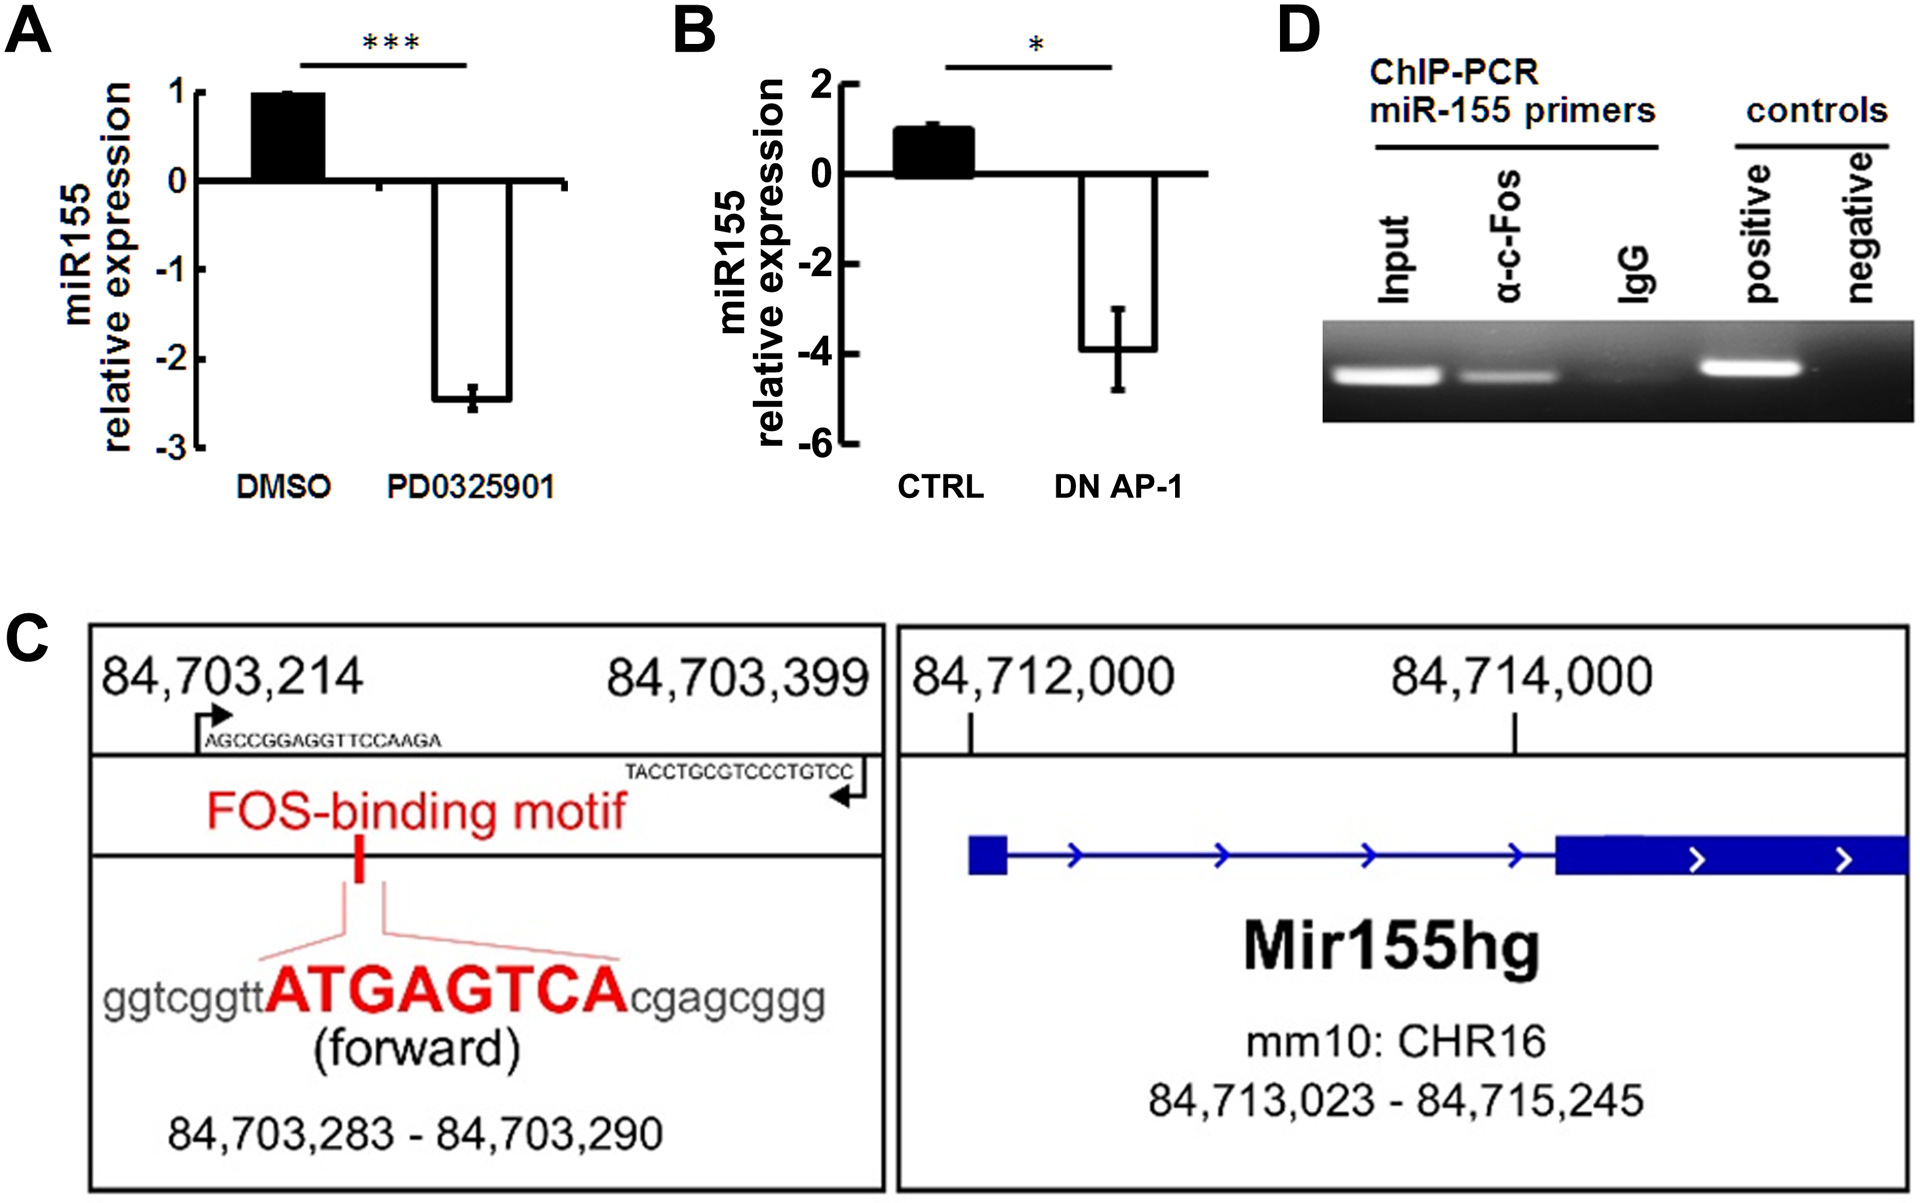
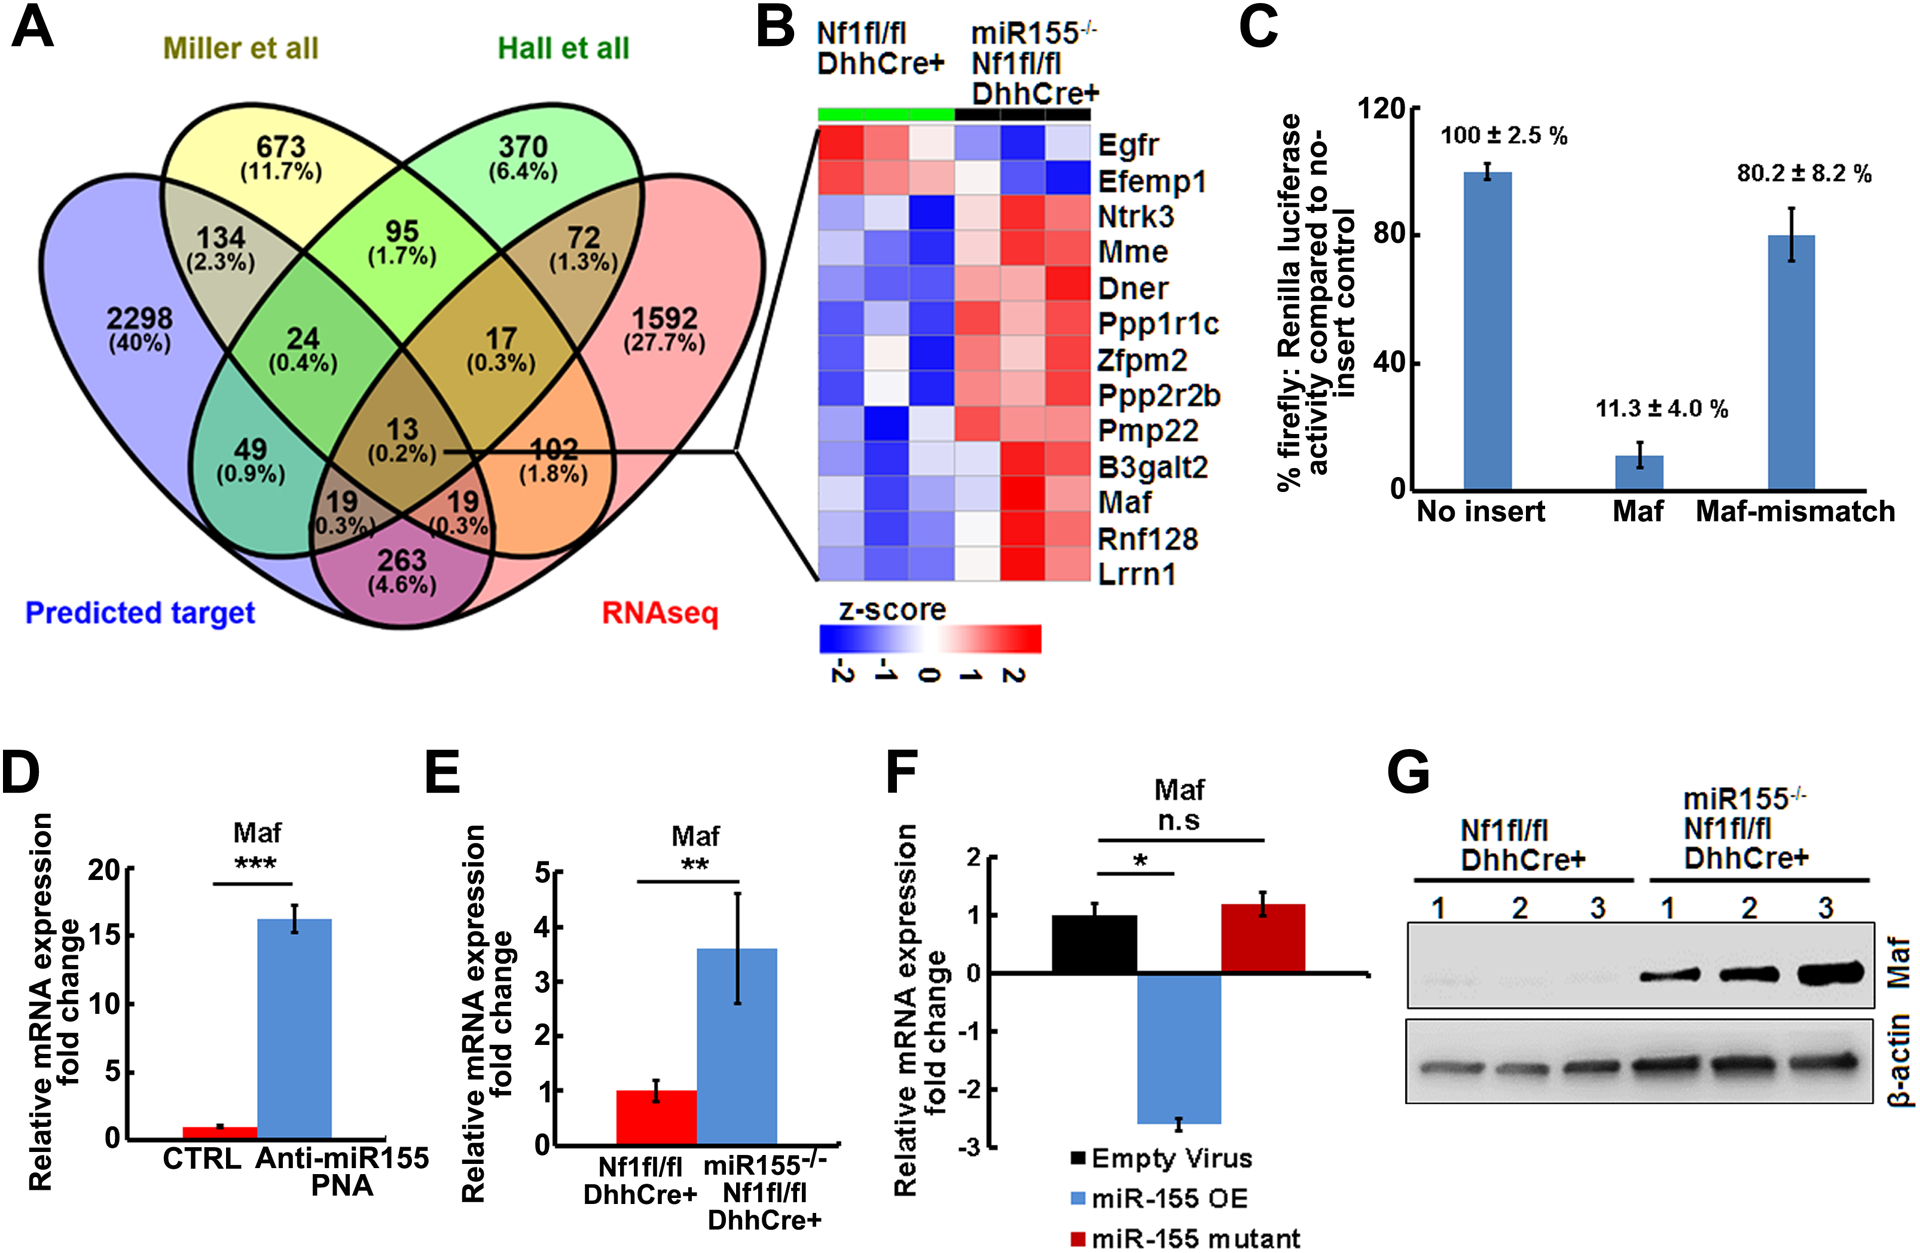
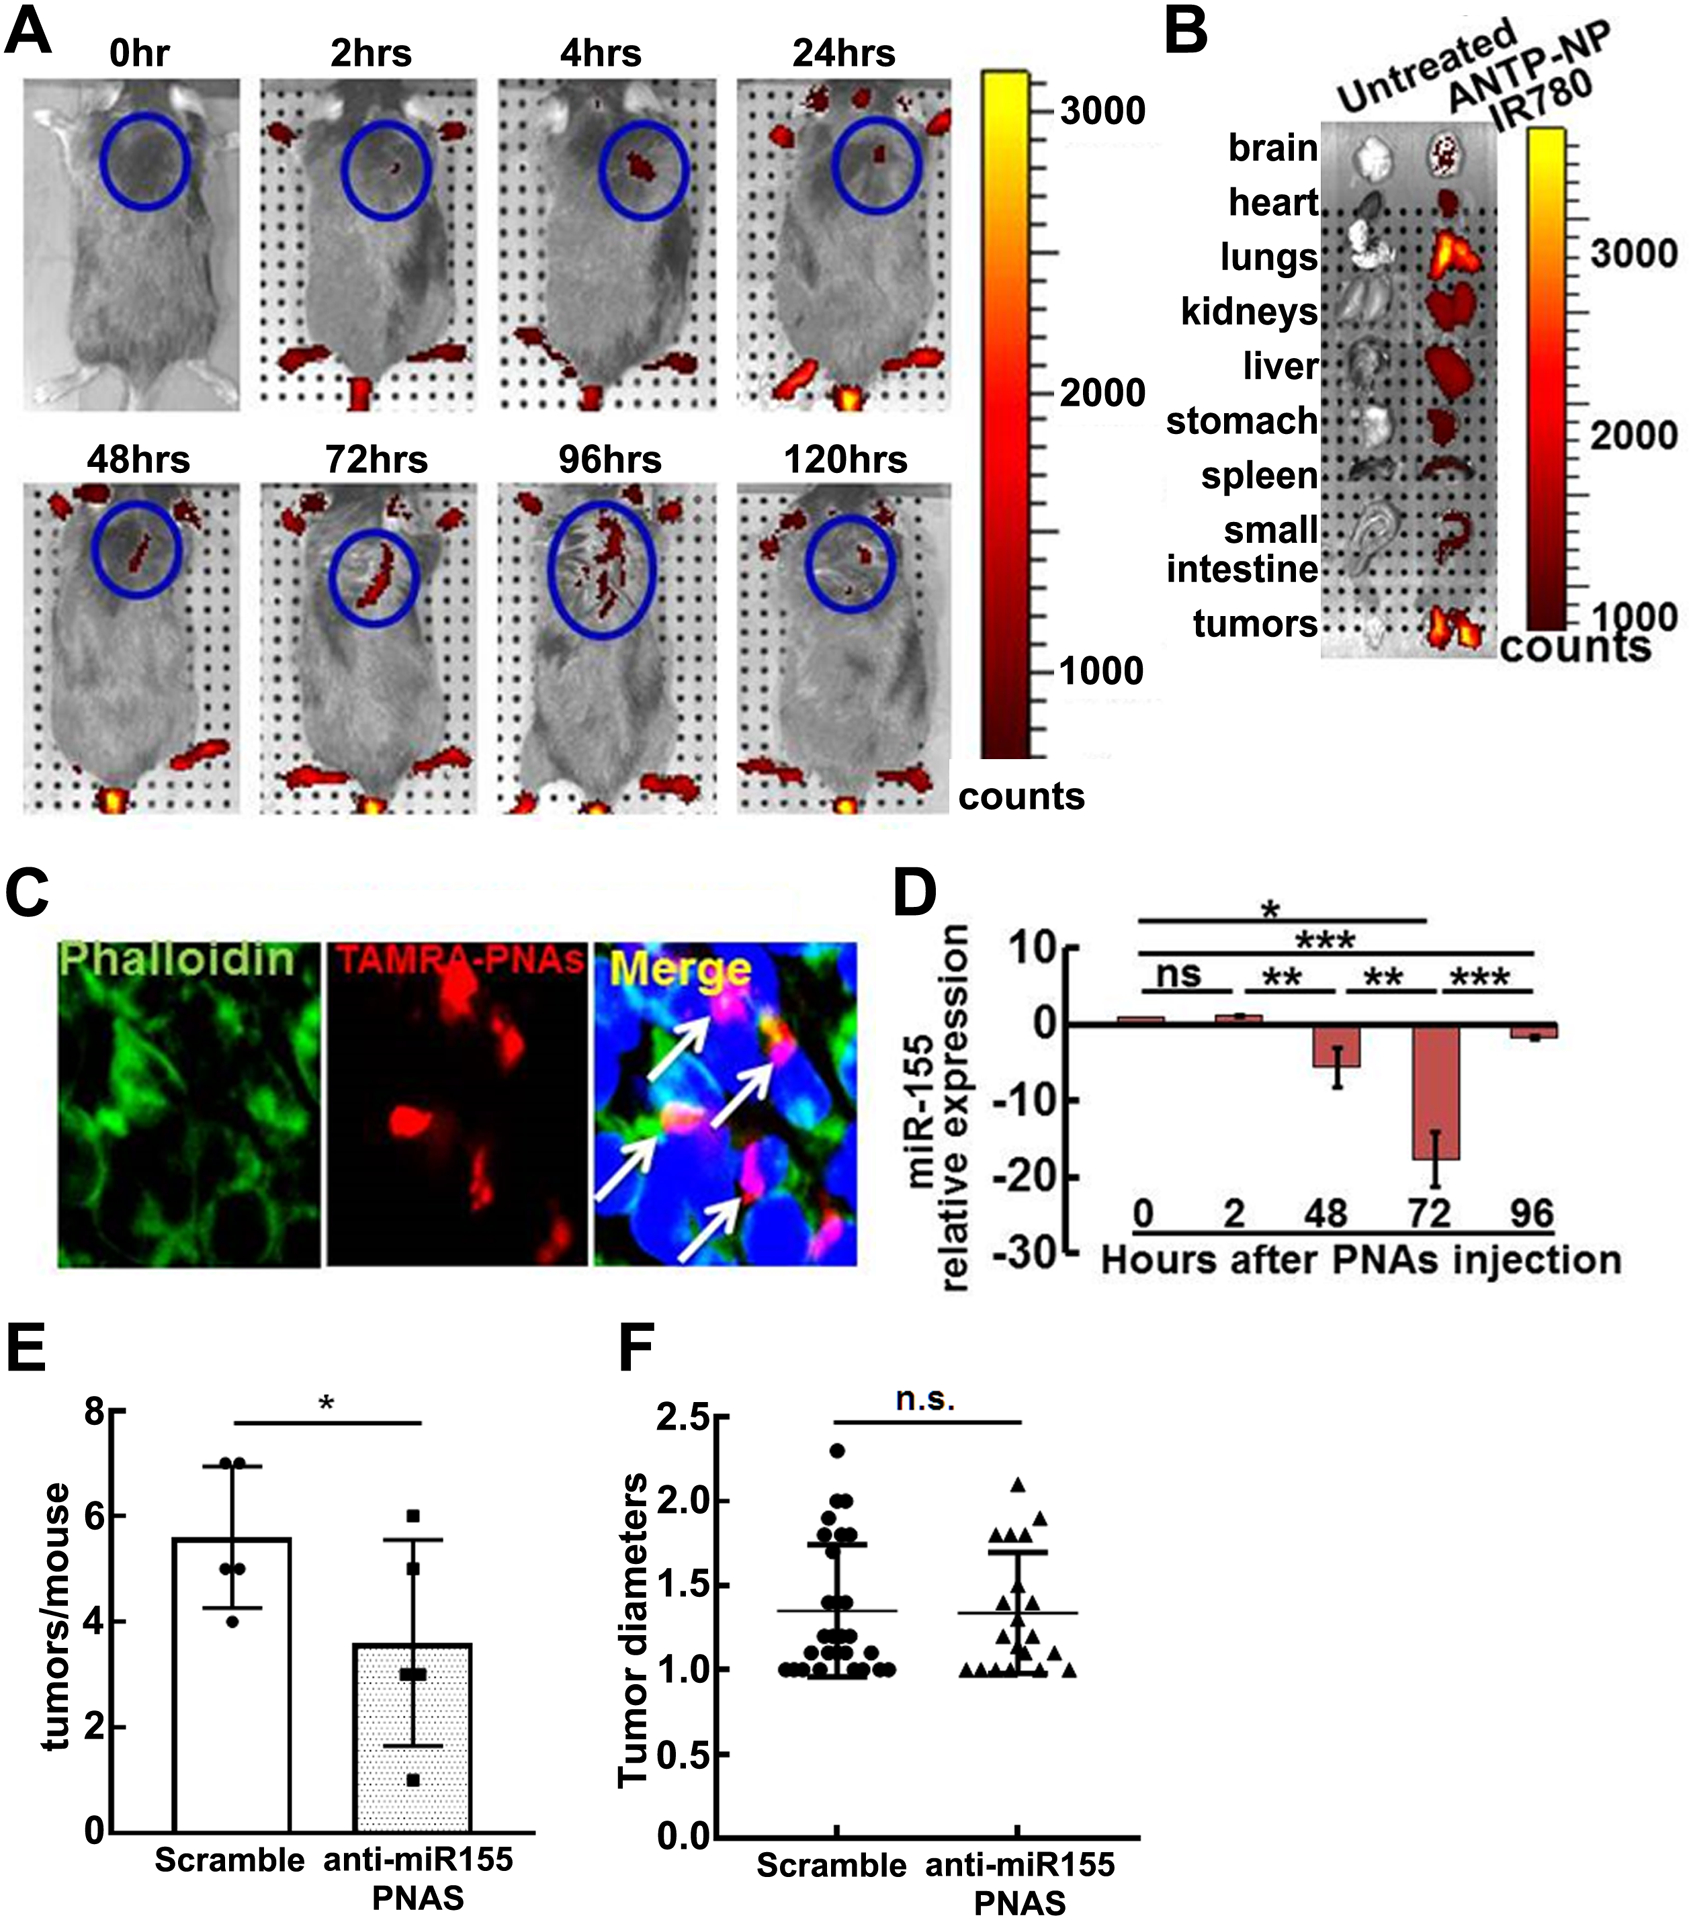
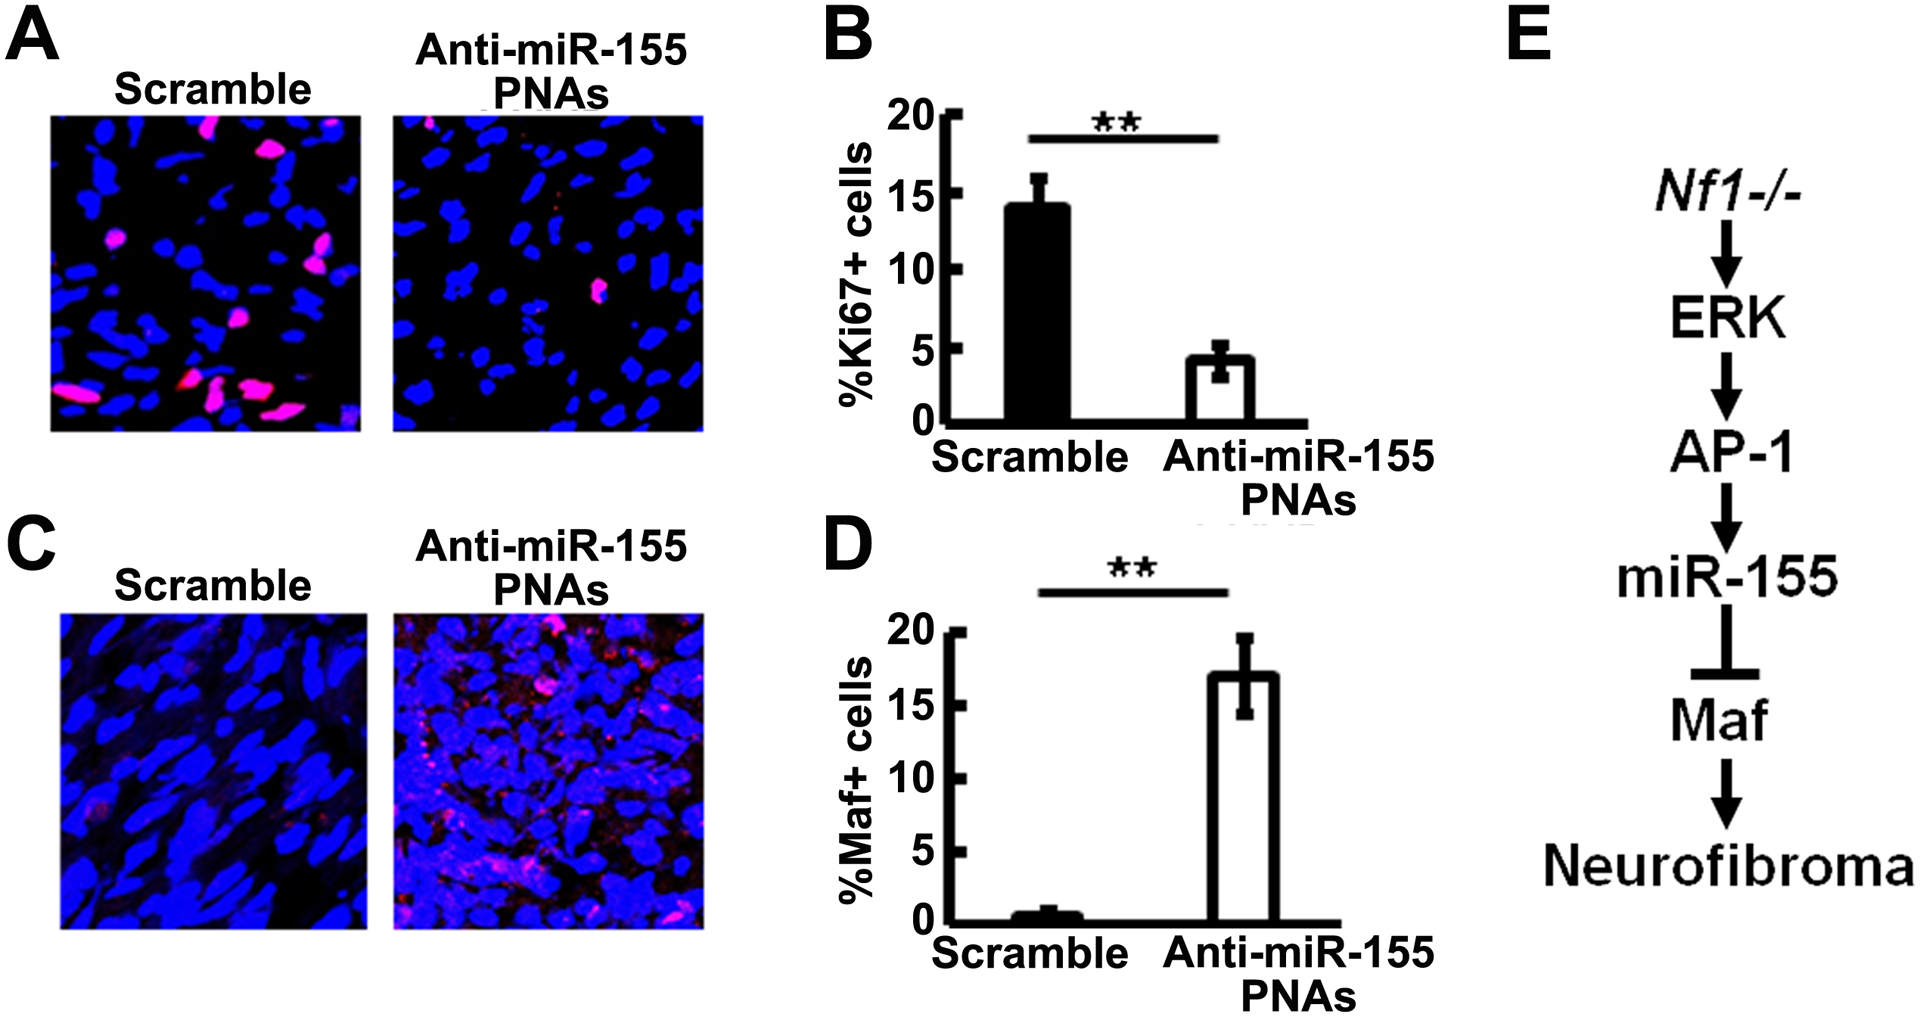
MicroRNAs (miRs) are small non-coding RNAs that can have large impacts on oncogenic pathways. Possible functions of dysregulated miRs have not been studied in neurofibromatosis type 1 (NF1) plexiform neurofibromas (PNFs). In PNFs, Schwann cells (SCs) have biallelic NF1 mutations necessary for tumorigenesis. We analyzed a miR microarray comparing with normal and PNF SCs and identified differences in miR expression, and we validated in mouse PNFs versus normal mouse SCs by qRT-PCR. Among these, miR-155 was a top overexpressed miR, and its expression was regulated by RAS/MAPK signaling. Overexpression of miR-155 increased mature Nf1-/- mouse SC proliferation. In SC precursors, which model tumor-initiating cells, pharmacological and genetic inhibition of miR-155 decreased PNF-derived sphere numbers in vitro, and we identified Maf as a miR-155 target. In vivo, global deletion of miR-155 significantly decreased tumor number and volume, increasing mouse survival. Fluorescent nanoparticles entered PNFs, suggesting that an anti-miR might have therapeutic potential. However, treatment of established PNFs using anti-miR-155 peptide nucleic acid-loaded nanoparticles marginally decreased tumor numbers and did not reduce tumor growth. These results suggest that miR-155 plays a functional role in PNF growth and/or SC proliferation, and that targeting neurofibroma miRs is feasible, and might provide novel therapeutic opportunities.


Conflict of interest statement

Conflict of interest

The authors declare no conflict of interests.

Figures

Figure 1.
Figure 1.. MiR-155 is overexpressed in both mouse and human plexiform neurofibromas.
A. Heatmap of differential gene expression (left) and microRNA expression (right) in normal human Schwann cells (NHSC, n=10) and human plexiform neurofibroma Schwann cells (PNFSC, n=11). B. A miR-mRNA network analysis using miRs and PNF microarray data showing miR-155 was one of the top upregulated miRs with the highest miR-SVR score. C. MiR-155 relative expression in mouse PNFs and their derived spheres, normalizing to wild type (WT, n=3) SCs (for sphere) or dorsal toot ganglia (DRGs, for PNF, n=3), by qRT-PCR. **=p<0.01
Figure 2.
Figure 2.. MiR-155 regulates neurofibroma sphere numbers.
A. Anti-miR-155- peptide nucleic acids (PNAs) significantly inhibited mouse neurofibroma sphere numbers at 4 days. B. Anti-miR-155-PNAs inhibited absolute miR-155 expression (blue bars) in mouse neurofibroma derived spheres compared to scramble control (red bars) as confirmed by qRT-PCR. C. Lentivirus expressed miR-155 inhibitor (miR-155i) significantly inhibited mouse neurofibroma sphere numbers by 7 days (blue bar) compared to non-target control (NT, red bar). D. Lentivirus expressed miR-155 inhibitor (miR-155i) significantly inhibited miR-155 expression in mouse neurofibroma derived spheres (blue bar) compared to NT control (red bar) as confirmed by qRT-PCR. E. Overexpression of miR-155 (blue bars) increased mature Nf1−/− SC growth compared to control (red bars). F. Overexpression of miR-155–5P (blue bars) did not increase mature wild type SC growth compared to control (red bars). G. Absolute miR-155 expression in miR-155–5P overexpression (miR-155 OE, blue bars) or miR-155–5P mutant control (CTRL, red bars) in wild type SCs and Nf1−/− SCs. Three independent experiments were performed in A- G. *p<0.05, **p<0.01, n. s =no significant difference.
Figure 3.
Figure 3.. Global deletion of miR-155 prolongs survival and decreases tumor number and size in the Nf1fl/fl;DhhCre neurofibroma mouse model.
A. Kaplan-Meier survival curve. Purple: miR-155 −/−;Nf1fl/+;DhhCre, Green: miR-155 +/−;Nf1fl/fl;DhhCre, Black: miR-155 −/−;Nf1fl/fl;DhhCre+. B. Tumor volume for each mouse volume at 7- and 12-month in littermate control miR-155 +/−;Nf1fl/fl;DhhCre mice) (left) and miR-155 −/−;Nf1fl/fl;DhhCre+ (right). C. Representative gross dissections of para-spinal PNFs and nerve roots in 7-month of age miR-155 +/−;Nf1fl/fl;DhhCre (left) and miR-155 −/−;Nf1fl/fl;DhhCre+ (right). White arrows pointed to tumors. Ruler showing 1 mm markings. D. Tumor diameter in the miR-155 +/−;Nf1fl/fl;DhhCre mice (circle, n=4 mice with 28 tumors) and miR-155 −/−;Nf1fl/fl;DhhCre mice (square, n=4 mice with 12 tumors) at 7-month. E. Average tumor number per mouse at 7-month in the miR-155 +/−;Nf1fl/fl;DhhCre mice (black bar, n=4) and miR-155 −/−;Nf1fl/fl;DhhCre+ (white bar, n=4). F. Representative pictures of cell proliferation shown as Ki67+ cells in miR-155 +/−;Nf1fl/fl;DhhCre mice (left) and miR-155 −/−;Nf1fl/fl;DhhCre mice(right). G. Quantification of percent of Ki67+ cells in miR-155 +/−;Nf1fl/fl;DhhCre mice (left black bar, n=5) and miR-155 −/−;Nf1fl/fl;DhhCre mice (right black bar, n=5). H. Representative pictures of cell death shown as TUNEL+ cells (red) in miR-155 +/−;Nf1fl/fl;DhhCre mice (left) and miR-155 +/−;Nf1fl/fl;DhhCre mice (right). I. Quantification of percent TUNEL+ cells in miR-155 +/−;Nf1fl/fl;DhhCre mice (white bar, n=5) and miR-155 −/−;Nf1fl/fl;DhhCre mice (grey bar, n=5). Statistics: B: mixed model analysis, D, E, G and I: unpaired student t test. *=p<0.05, **=p<0.01, ***=p<0.001.
Figure 4.
Figure 4.. MEK regulates miR-155 expression through AP-1 binding to miR-155
A. qRT-PCR showing miR-155 is downregulated after a MEK inhibitor, PD0325901, treatment (n=3/group). B. qRT-PCR showing that miR-155 is downregulated after dominant negative AP-1 lentivirus treatment (n=3/group). C. Schematic, exon 1 mouse miR-155 gene (forward strand, chr16: 84,713,023 – 84,715,245). One putative AP-1 binding motif is between Exon 1 and Exon 2; the binding motif sequence is shown in bold red. D. Representative image of CHIP PCR showing that c-Fos binds to miR-155 promoter. Three independent experiments were performed.
Figure 5.
Figure 5.. Maf is a direct target of miR-155.
A. Venn diagram showing the overlaps of genes between the predicted miR-155 targets, miR-155−/−;Nf1fl/fl;DhhCre vs Nf1fl/fl;DhhCre PNF RNAseq differential expressed genes, and published differential expressed genes on mouse PNF microarray (Miller et al) or RNA sequencing (Hall et al). B. Heap map of 13 shared genes in miR-155−/−;Nf1fl/fl;DhhCre vs Nf1fl/fl;DhhCre PNF RNAseq. C. Luciferase reporter assay showing Maf was a target of miR-155. D. qRT-PCR showing Maf relative mRNA expressions in anti-miR-155-PNA treated mouse PNF-derived spheres (blue bar, n=3) compared to scramble control (CTRL,red bar, n=3). E. qRT-PCR of the relative mRNA expression in miR-155−/−;Nf1fl/fl;DhhCre mice (blue bar, n=3) normalized to Nf1fl/fl;DhhCre mice (red bar, n=3). F. qRT-PCR showing Maf relative mRNA expressions in miR-155–5P overexpression (miR-155 OE) in WT or Nf1−/− SCs compared to mutant miR-155–5P control (CTRL). Three independent experiments were performed. G. Representative Western blot of MAF on tumors from Nf1fl/fl;DhhCre and miR-155−/−;Nf1fl/fl;DhhCre mice (n=3/group). Beta-actin was used as loading control.
Figure 6.
Figure 6.. Administration of anti-miR-155-PNAs-NPs in vivo marginally reduces tumor numbers.
A. Representative IVIS fluorescence reflectance images of mice injected intravenously with IR-780 loaded anti-miR-155-PNAs-NPs at 0, 2, 48, 72, and 96 hours after injection (0.9 mg/kg) of anti-miR-155-PNAs . Fluorescence was quantified and expressed as radiance (x109 photon / sec/ cm2). B. Representative IVIS image of organs harvested from mice with or without anti-miR-155-PNAs-NPs IR-780 120-hrs after injection. C. Confocal microscopy of TAMRA-labeled anti-miR-155-PNAs-NPs localization in tumors. Arrow: cells with PNAs-uptake. Red, TAMRA-labeled PNAs; Green, FITC phalloidin-labeled actin; Blue, labeled nuclei. D. QRT-PCR of miR-155 relative expression on tumors at 0, 2, 48, 72, and 96 hours after one dose (0.9 mg/kg) of anti-miR-155-PNAs-NPs injection as normalized to vehicle controls (n=3/group). E. Average tumors/mouse in scramble (white bar, n=5) and anti-miR-155-PNAs –NPs (grey bar, n=5). F. Tumor diameters in scramble (black circle, n=28) and anti-miR-155-PNAs (black triangle, n=20).
Figure 7.
Figure 7.. Anti-miR-155-PNAs effectively inhibits cell proliferation and increased target protein expression.
A. Representative immunofluorescence pictures of Ki67+ staining (Red) in scramble (left) and anti-miR-155-PNA (right) treated mouse plexiform neurofibromas. DAPI (blue) was used for nuclei labelling. B. Quantification of Ki67+% cells in scramble (black bar, n=3) and anti-miR-155-PNA (white bar, n=4) treated mouse plexiform neurofibromas. C. Representative immunofluorescence pictures of MAF+ staining (Red) in scramble (left) and anti-miR-155-PNA (right) treated mouse plexiform neurofibromas. DAPI (blue) was used for nuclei labelling. D. Quantification of MAF+% cells in scramble (black bar, n=3) and anti-miR-155-PNA (white bar, n=4) treated mouse plexiform neurofibromas. E. Schematic showing a model of PNF formation: Loss of Nf1 in SC/SCP elevated MEK/ERK levels to activate AP-1. AP-1 binds to miR-155, which in turn regulates one of its main targets, Maf, to contribute to PNF formation.

Similar articles

Cited by

References

    1. Boyd KP, Korf BR, Theos A. Neurofibromatosis type 1. J Am Acad Dermatol. 2009;61(1):1–14. - PMC - PubMed
    1. Varan A, Sen H, Aydin B, Yalcin B, Kutluk T, Akyuz C. Neurofibromatosis type 1 and malignancy in childhood. Clin Genet. 2016;89(3):341–5. - PubMed
    1. Prada CE, Jousma E, Rizvi TA, Wu J, Dunn RS, Mayes DA, et al. Neurofibroma-associated macrophages play roles in tumor growth and response to pharmacological inhibition. Acta Neuropathol. 2013;125(1):159–68. - PMC - PubMed
    1. Rice FL, Houk G, Wymer JP, Gosline SJC, Guinney J, Wu J, et al. The evolution and multi-molecular properties of NF1 cutaneous neurofibromas originating from C-fiber sensory endings and terminal Schwann cells at normal sites of sensory terminations in the skin. PloS One. 2019;14(5):e0216527. - PMC - PubMed
    1. Zhu Y, Ghosh P, Charnay P, Burns DK, Parada LF. Neurofibromas in NF1: Schwann cell origin and role of tumor environment. Science. 2002;296(5569):920–2. - PMC - PubMed

Publication types