

Y-chromosome haplotypes are associated with variation in size and age at maturity in male Chinook salmon
- PMID: 33294023
- PMCID: PMC7691470
- DOI: 10.1111/eva.13084
Y-chromosome haplotypes are associated with variation in size and age at maturity in male Chinook salmon
Abstract
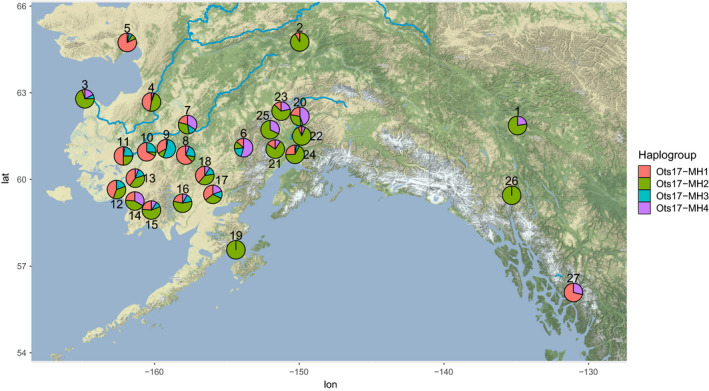
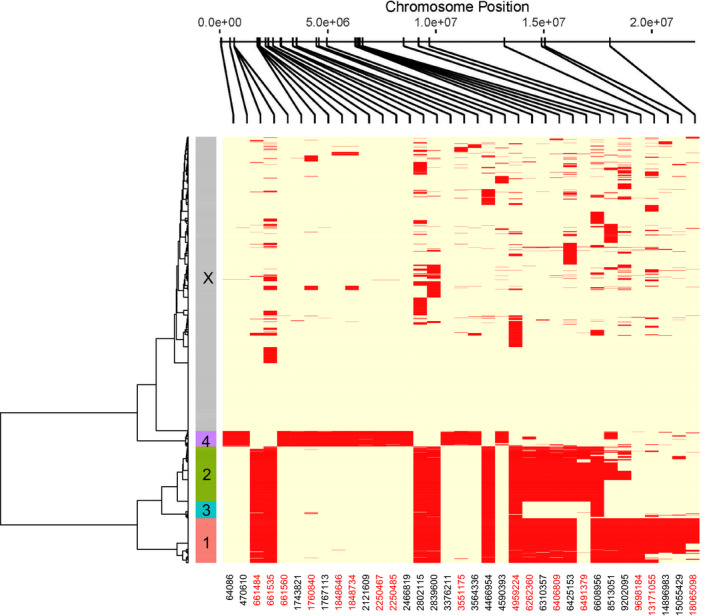
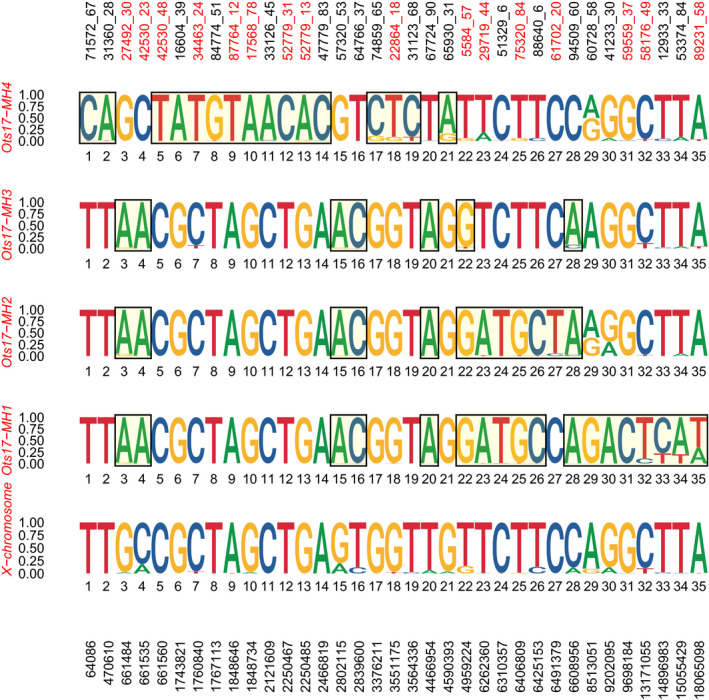
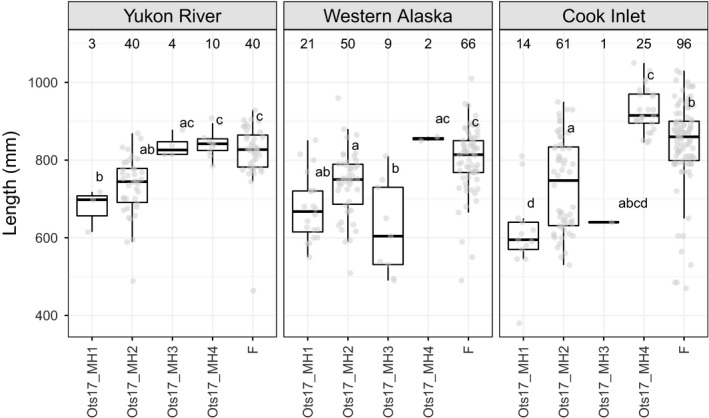
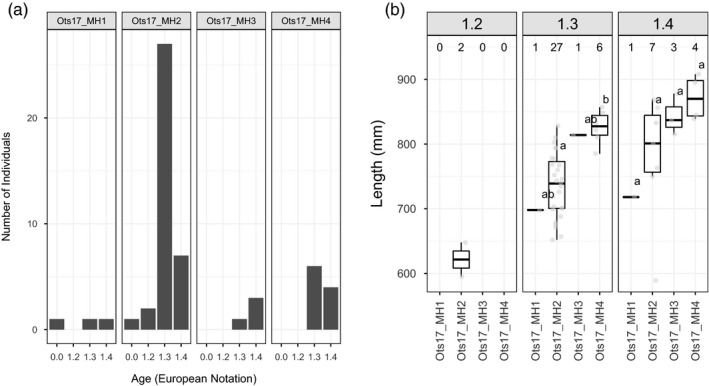
Variation in size and age at maturity is an important component of life history that is influenced by both environmental and genetic factors. In salmonids, large size confers a direct reproductive advantage through increased fecundity and egg quality in females, while larger males gain a reproductive advantage by monopolizing access to females. In addition, variation in size and age at maturity in males can be associated with different reproductive strategies; younger smaller males may gain reproductive success by sneaking among mating pairs. In both sexes, there is a trade-off between older age and increased reproductive success and increased risk of mortality by delaying reproduction. We identified four Y-chromosome haplogroups that showed regional- and population-specific variation in frequency using RADseq data for 21 populations of Alaska Chinook salmon. We then characterized the range-wide distribution of these haplogroups using GT-seq assays. These haplogroups exhibited associations with size at maturity in multiple populations, suggesting that lack of recombination between X and Y-chromosomes has allowed Y-chromosome haplogroups to capture different alleles that influence size at maturity. Ultimately, conservation of life history diversity in Chinook salmon may require conservation of Y-chromosome haplotype diversity.
Keywords: Chinook salmon; GT‐seq; RADseq; Ychromosome; age at maturity; haplotype; size at maturity.
© 2020 The Authors. Evolutionary Applications published by John Wiley & Sons Ltd.
Conflict of interest statement
None declared.
Figures
Similar articles
-
A mobile sex-determining region, male-specific haplotypes and rearing environment influence age at maturity in Chinook salmon.Mol Ecol. 2021 Jan;30(1):131-147. doi: 10.1111/mec.15712. Epub 2020 Nov 17. Mol Ecol. 2021. PMID: 33111366
-
Increased mitochondrial DNA diversity in ancient Columbia River basin Chinook salmon Oncorhynchus tshawytscha.PLoS One. 2018 Jan 10;13(1):e0190059. doi: 10.1371/journal.pone.0190059. eCollection 2018. PLoS One. 2018. PMID: 29320518 Free PMC article.
-
Changes in Size and Age of Chinook Salmon Oncorhynchus tshawytscha Returning to Alaska.PLoS One. 2015 Jun 19;10(6):e0130184. doi: 10.1371/journal.pone.0130184. eCollection 2015. PLoS One. 2015. PMID: 26090990 Free PMC article.
-
A critical review of adaptive genetic variation in Atlantic salmon: implications for conservation.Biol Rev Camb Philos Soc. 2007 May;82(2):173-211. doi: 10.1111/j.1469-185X.2006.00004.x. Biol Rev Camb Philos Soc. 2007. PMID: 17437557 Review.
-
Evolution of chinook salmon (Oncorhynchus tshawytscha) populations in New Zealand: pattern, rate, and process.Genetica. 2001;112-113:493-513. Genetica. 2001. PMID: 11838785 Review.
Cited by
-
Phylogeography Reveals Geographic and Environmental Factors Driving Genetic Differentiation of Populus sect. Turanga in Northwest China.Front Plant Sci. 2021 Aug 11;12:705083. doi: 10.3389/fpls.2021.705083. eCollection 2021. Front Plant Sci. 2021. PMID: 34456946 Free PMC article.
-
Steelhead (Oncorhynchus mykiss) lineages and sexes show variable patterns of association of adult migration timing and age-at-maturity traits with two genomic regions.Evol Appl. 2020 Aug 27;13(10):2836-2856. doi: 10.1111/eva.13088. eCollection 2020 Dec. Evol Appl. 2020. PMID: 33294026 Free PMC article.
-
Identification of the male-specific region on the guppy Y Chromosome from a haplotype-resolved assembly.Genome Res. 2025 Mar 18;35(3):489-498. doi: 10.1101/gr.279582.124. Genome Res. 2025. PMID: 40044220 Free PMC article.
-
Sex-specific heritabilities for length at maturity among Pacific salmonids and their consequences for evolution in response to artificial selection.Evol Appl. 2023 Jul 11;16(8):1458-1471. doi: 10.1111/eva.13579. eCollection 2023 Aug. Evol Appl. 2023. PMID: 37622093 Free PMC article.
-
Hiding in plain sight: the Y chromosome and its reinvigorated role in evolutionary processes.Evol Lett. 2024 Nov 27;9(2):165-171. doi: 10.1093/evlett/qrae065. eCollection 2025 Apr. Evol Lett. 2024. PMID: 40191417 Free PMC article.
References
-
- Allendorf, F. W. , & Thorgaard, G. H. (1984). Tetraploidy and the evolution of salmonid fishes In Turner B. (Ed.), Evolutionary genetics of fishes (pp. 1–53). New York: Plenum Publishing Corporation.
-
- Ayllon, F. , Kjærner‐Semb, E. , Furmanek, T. , Wennevik, V. , Solberg, M. F. , Dahle, G. , … Wargelius, A. (2015). The vgll3 locus controls age at maturity in wild and domesticated Atlantic salmon (salmo salar l.) males. PLoS Genetics, 11(11), e1005628 10.1371/journal.pgen.1005628 - DOI - PMC - PubMed
-
- Beacham, T. D. , Jonsen, K. L. , Supernault, J. , Wetklo, M. , Deng, L. , & Varnavskaya, N. (2006). Pacific rim population structure of Chinook salmon as determined from microsatellite analysis. Transactions of the American Fisheries Society, 135(6), 1604–1621. 10.1577/T06-071.1 - DOI
LinkOut - more resources
Full Text Sources
Miscellaneous
