. 2020 Aug 27;13(10):2821-2835.
doi: 10.1111/eva.13086. eCollection 2020 Dec.

Population genomic data in spider mites point to a role for local adaptation in shaping range shifts

Affiliations

Population genomic data in spider mites point to a role for local adaptation in shaping range shifts

Lei Chen et al. Evol Appl. .

Abstract

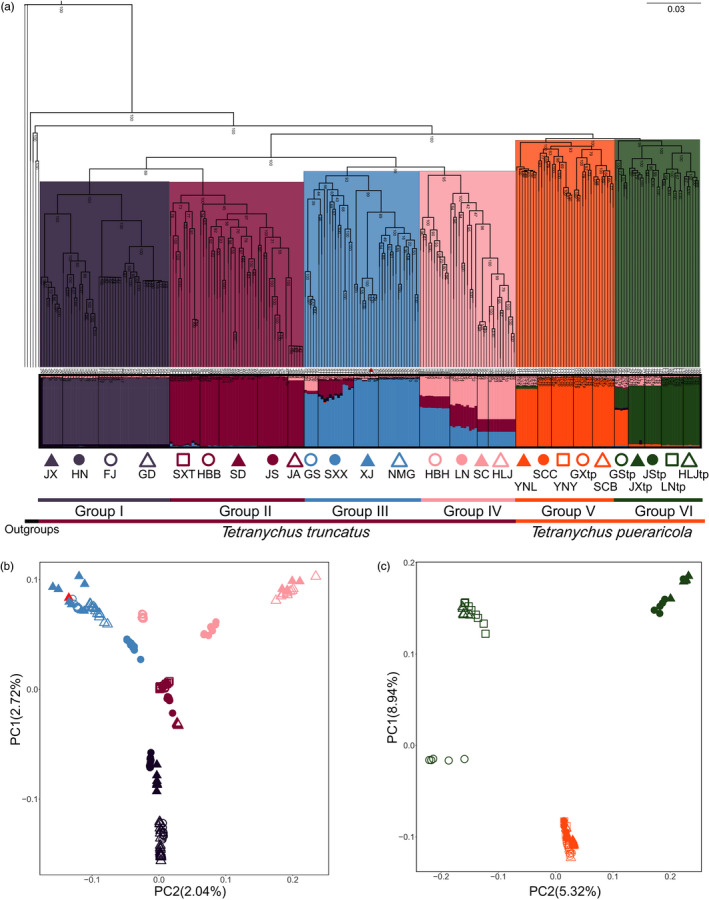
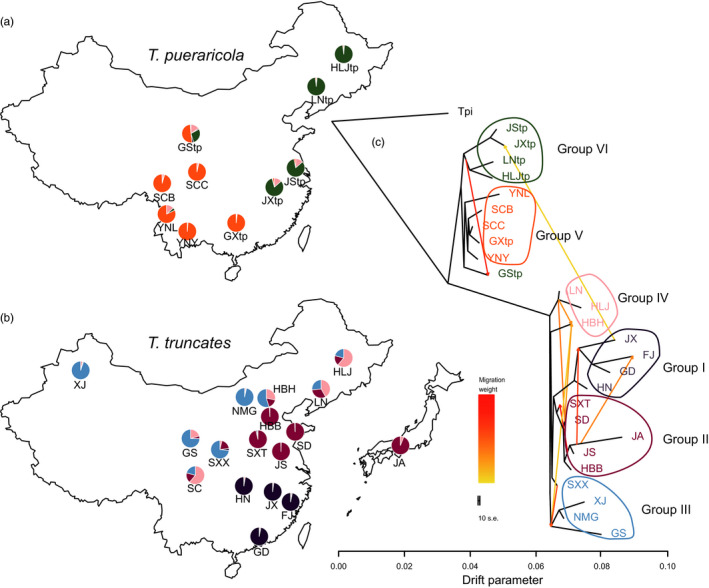
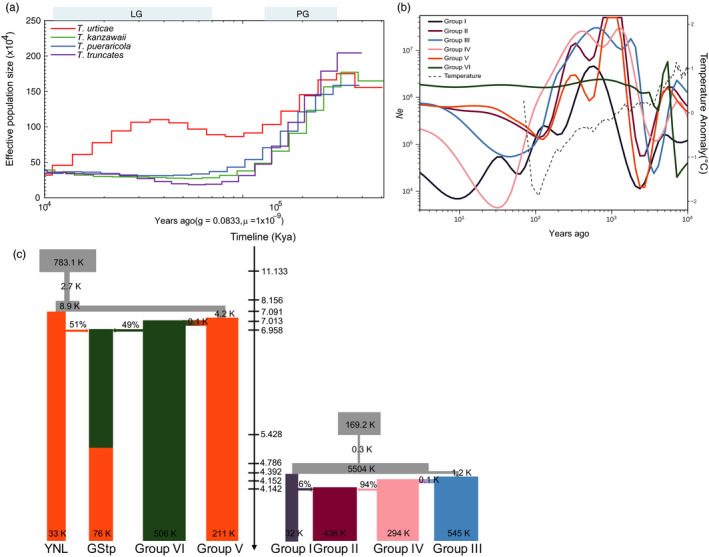
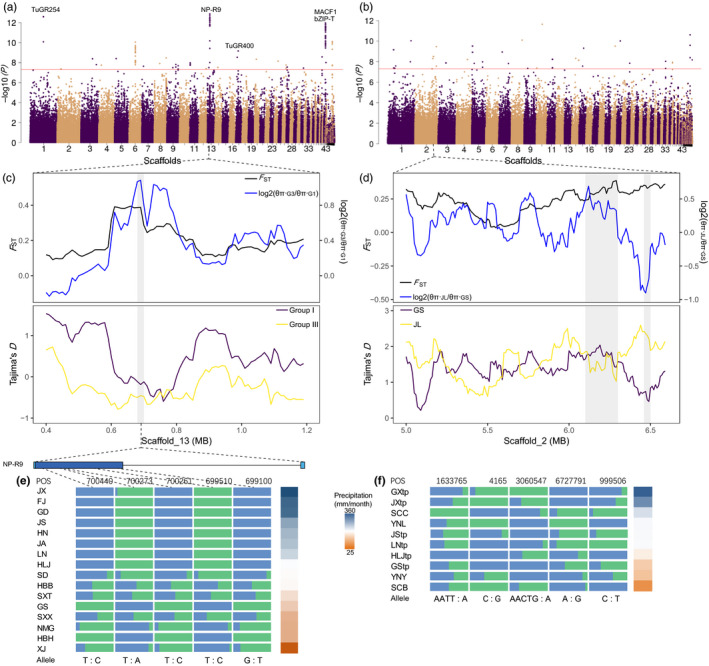
Local adaptation is particularly likely in invertebrate pests that typically have short generation times and large population sizes, but there are few studies on pest species investigating local adaptation and separating this process from contemporaneous and historical gene flow. Here, we use a population genomic approach to investigate evolutionary processes in the two most dominant spider mites in China, Tetranychus truncatus Ehara and Tetranychus pueraricola Ehara et Gotoh, which have wide distributions, short generation times, and large population sizes. We generated genome resequencing of 246 spider mites mostly from China, as well as Japan and Canada at a combined total depth of 3,133×. Based on demographic reconstruction, we found that both mite species likely originated from refugia in southwestern China and then spread to other regions, with the dominant T. truncatus spreading ~3,000 years later than T. pueraricola. Estimated changes in population sizes of the pests matched known periods of glaciation and reinforce the recent expansion of the dominant spider mites. T. truncatus showed a greater extent of local adaptation with more genes (76 vs. 17) associated with precipitation, including candidates involved in regulation of homeostasis of water and ions, signal transduction, and motor skills. In both species, many genes (135 in T. truncatus and 95 in T. pueraricola) also showed signatures of selection related to elevation, including G-protein-coupled receptors, cytochrome P450s, and ABC-transporters. Our results point to historical expansion processes and climatic adaptation in these pests which could have contributed to their growing importance, particularly in the case of T. truncatus.

Keywords: invertebrate pests; local adaptation; range shifts; spider mites; whole‐genome resequencing.


Conflict of interest statement

None declared.

Figures

FIGURE 1
FIGURE 1
Population genetics analyses of T. truncatus and T. pueraricola. (a) Phylogenetic tree (maximum likelihood) and the ADMIXTURE analysis (K = 6) inferred from whole‐genome SNPs of spider mites, with T. piercei, T. kanzawai, T. parakanzawai, and T. urticae as outgroups. In ADMIXTURE analysis, each horizontal bar represents an individual. All populations are represented by open and filled symbols which are used in the PCA in the next panel. (b) Principal components analysis (PCA) of T. truncatus and (c) T. pueraricola. An outlying individual of the SC population denoted as a solid triangle may reflect a sampling error
FIGURE 2
FIGURE 2
Maps and admixture events of the spider mites. Geographic locations of 27 populations for T. pueraricola (a) and T. truncatus (b) with ancestral proportions (K = 6) inferred from ADMIXTURE. (c) The relationships among populations of these two dominated spider mites. Each population is colored according to its corresponding group, and each arrow indicates a migration event which is colored with migration weights. The scale bar shows 10× the average standard error of the entries in the sample covariance matrix
FIGURE 3
FIGURE 3
Demographic history of the spider mites. (a) PSMC analysis performed on the representatives of each species sequenced at high coverage to indicate variation in N e over the last 105 years. LG and PG represent period of last glaciation and penultimate glaciation separately. (b) Demographic changes of N e for six groups of T. truncatus and T. pueraricola in the recent 104 years using SMC++. Note that the SC population has been excluded from Group IV because of sampling uncertainty. Northern hemispheric (90‐30N) temperature anomaly from the mean temperature of AD 1962–1990. (c) The best demographic scenarios for T. truncatus and T. pueraricola inferred by fastsimcoal2. The gray rectangles represent ancestral populations, and the arrows indicate admixture events. To better understand demographic history of T. pueraricola, populations of YNL and GStp are assigned as single groups
FIGURE 4
FIGURE 4
Signatures of local adaptation in the genome of spider mites. Manhattan plots of adjusted p‐values using the LFMM for association between SNPs and precipitation in T. truncatus (a) and T. pueraricola (b). The genome‐wide significance threshold (‐log10(5e‐8)) is indicated by the red horizontal line. Those genes with non‐synonymous substitution caused by significantly associated SNPs (adjusted p‐value > 5e‐8) were marked in the Manhattan plots. (c) FST, log2(θ π ratio), and Tajima's D values around the strongest associated gene NP‐R9 of T. truncatus. G1 and G3 are the abbreviations for Group I and Group III. (d) FST, log2(θ π ratio), and Tajima's D values around significantly associated genomic regions in scaffold_2 of T. pueraricola. JL represents JStp and LNtp populations. GS represents GXtp and SCB populations. (e) Allele frequencies of five non‐synonymous mutations within the NP‐R9 gene across the populations of T. truncatus. Based on the precipitation of the wettest month, the relatively moist regions include FJ, GD, JX, and HN and the relative arid regions include XJ, NMG, GS, and HBH. (f) Allele frequencies of the five most associated SNPs with the genomic positions of scaffold_10:1633765, scaffold_230:4165, scaffold_8:3060547, scaffold_1:6727791, and scaffold_21:999506 across the populations of T. pueraricola

Similar articles

Cited by

References

    1. Alexander, D. H. , Novembre, J. , & Lange, K. (2009). Fast model‐based estimation of ancestry in unrelated individuals. Genome Research, 19(9), 1655–1664. 10.1101/gr.094052.109 - DOI - PMC - PubMed
    1. Atkinson, A. , Siegel, V. , Pakhomov, E. , & Rothery, P. (2004). Long‐term decline in krill stock and increase in salps within the Southern Ocean. Nature, 432(7013), 100–103. 10.1038/nature02996 - DOI - PubMed
    1. Auger, P. , Guichou, S. , & Kreiter, S. (2003). Variations in acaricidal effect of wettable sulfur on Tetranychus urticae (Acari: Tetranychidae): Effect of temperature, humidity and life stage. Pest Management Science, 59(5), 559–565. 10.1002/ps.665 - DOI - PubMed
    1. Benton, T. G. , Vickery, J. A. , & Wilson, J. D. (2003). Farmland biodiversity: Is habitat heterogeneity the key? Trends in Ecology & Evolution, 18(4), 182–188. 10.1016/S0169-5347(03)00011-9 - DOI
    1. Bolger, A. M. , Lohse, M. , & Usadel, B. (2014). Trimmomatic: A flexible trimmer for Illumina sequence data. Bioinformatics, 30(15), 2114–2120. 10.1093/bioinformatics/btu170 - DOI - PMC - PubMed

LinkOut - more resources