. 2020 Nov 1;10(11):3721-3736.
eCollection 2020.

ERα is a target for butein-induced growth suppression in breast cancer

Affiliations

ERα is a target for butein-induced growth suppression in breast cancer

Chuyi Huang et al. Am J Cancer Res. .

Abstract

Breast cancer (BCa) has the highest incidence and mortality among malignant diseases in female worldwide. BCa is frequently caused by estrogen receptor α (ERα), a ligand-dependent receptor that highly expressed in about 70% of breast tumors. Therefore, ERα has become a well-characterized and the most effective target for treating ERα-expressing BCa (ERα+ BCa). However, the acquire resistance was somehow developed in patients who received current ERα signaling-targeted endocrine therapies. Hence, discovery of novel anti-estrogen/ERα strategies is urgent. In the present study, we identified butein as a potential agent for breast cancer treatment by the use of a natural product library. We showed that butein inhibits the growth of ERα+ BCa both in vitro and in vivo which is associated with cell cycle arrest that partially triggered by butein-induced ERα downregulation. Mechanically, butein binds to a specific pocket of ERα and promotes proteasome-mediated degradation of the receptor. Collectively, this work reveals that butein is a candidate to diminish ERα signaling which represents a potentially novel strategy for treating BCa.

Keywords: Breast cancer; butein; degradation; estrogen receptor α; growth.


Conflict of interest statement

None.

Figures
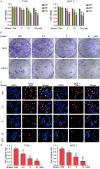
Figure 1
Figure 1
Butein induces growth inhibition of ERα positive breast cancer cells. A. Cells were exposed to butein (0, 5, 10, 20 μmol/L) for 24, 48, 72 h. Adding 20 μl MTS for cell viability for 3 h. In addition, Cells were exposed to butein (0, 2.5, 5, 10 μmol/L) for 24 h for the followed experiments. B. The treated cells were observed for colony formation for 2 weeks. The showed images were from three independent experiments. C, D. The indicated cells were stained with Edu for the additional 2 h. DAPI was used for nuclear staining. Scale bar, 20 μm. The showed images and pooled data were from three independent experiments. *P<0.05, #P<0.01, &P<0.001 versus each vehicle control.
Figure 2
Figure 2
Butein suppresses cell cycle progression via arresting the G0/G1 to S phase transition. MCF-7 and T47D cells were exposed to butein at the different dose for 24 h. A. We tested cell distribution using FACS. B. Calculated the percentage of cell number. C. The cells treated by butein were extracted to western blotting analysis for Cyclin D1, CDK4 and P27 proteins. GAPDH was a loading control.
Figure 3
Figure 3
Butein regulates ERα protein expression in ERα+ BCa. A. The cells were treated with butein for 24 h. Protein lysates were extracted, subjected to western blotting analysis for ERα expression. C. Cells were exposed to butein (10 μmol/L) for 0, 3, 6, 12 h. Protein lysates were prepared for ERα protein expression. GAPDH was a loading control. B, D. Densitometry with Image J was applied to quantify the bands of ERα. E. MCF-7 and T47D cells were treated with butein (10 μmol/L) for 24 h and then stained with anti-ERα. DAPI was for nuclear staining. Scale bar, 10 μm. The represent images were from three independent experiments. *P<0.05, #P<0.01, &P<0.001 versus each vehicle control.
Figure 4
Figure 4
Molecular simulations for the interaction of Butein with ERα. A, B. Three dimensional crystal structure of Butein in complex with ERα (PDB ID: 5FQT). Green represents butein, and yellow line shows hydrogen bonds. C. Surface presentation of the ERα-Butein complex crystal structure at 0 ns and 100 ns. D. Plots of root mean square deviation (RMSD) of heavy atoms of ERα-Butein complex (red) and unbound ERα (blue).
Figure 5
Figure 5
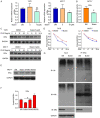
Butein promotes ERα degradation and mediates its transcriptional activity. A. Total RNA were collected from cells exposed to butein for 12 h. RT-qPCR was prepared to analyse mRNA level of ERα. NS (no significance) is P > 0.05 vs. each vehicle control. B. Cells were transfected with plasmid containing EREs for 24 h and then treated to butein for the additional 24 h. Protein lysates were extracted to dual-luciferase analysis for tanscriptional activity. C. Cells were treated with butein (10 μM) and CHX (50 μg/ml) for the different time. The protein expression of ERα were measured. D. The bands of ERα were quantify using Image J. E. Cells were pretreated with MG132 for 6 h and then with butein for an additional 24 h. Protein lysates were prepared for ERα expression. F. The bands of ERα were quantify. G. T47D cells were exposed to butein for 24 h and MG132 for 6 h. Immunoprecipitated with ERα beads and immunoblotted with ubiquitin (Ub), K48.
Figure 6
Figure 6
Butein enhances the anti-cancer effect of fulvestrant in ERα+ BCa. A. MCF-7 and T47D cells were exposed to butein (0, 2.5, 5, 10, 20 μM), fulvestrant (1 nM), or the combination of the both agents for 48 h in triple. 20 μl MTS were added to measure cell viability. *P<0.05, #P<0.01, &P<0.001 versus each vehicle control. B. T47D cells were exposed to butein, fulvestrant, or the both for 24 h. Colonic formation assay was performed. The showed images were from three independent experiments. C. MCF-7 and T47D cells were treated with butein, fulvestrant, or both for 24 h. Protein lysates were extracted for ERα and Cyclin D1 expression. D. Cells were treated with butein, fulvestrant, or both for 24 h. Edu stain assay were performed and images were captured using fluorescence microscope in triple. E. T47D cells were treated and collected, subjected to FACS for cell distribution. F. The percent of cell number was calculated.
Figure 7
Figure 7
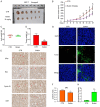
Butein induces growth inhibition of ERα+ BCa in vivo. MCF-7 cells were used to injected subcutaneously into BALB/c nude mice for 1 months. Mice were treated with butein via intraperitoneal injection for 27 days. The images (A) and volumn (B) of tumor were showed. The weight of body (C) and tumor (D) were measure. (E) Immunohistochemistry staining assay was performed for ERα, Bax, Cyclin D1 and Ki67 expression. Scale bar, 20 μm. (F) And positive areas of ERα from three images of IHC were quantified. *P<0.05 versus each vehicle control. TUNEL staining was performed to test apoptosis (G) and Fluorescence intensity (H) was quantitated, Scale bar, 100 μm. #P<0.01, &P<0.001 versus each treatment alone.

Similar articles

Cited by

References

    1. Bray F, Ferlay J, Soerjomataram I, Siegel RL, Torre LA, Jemal A. Global cancer statistics 2018: GLOBOCAN estimates of incidence and mortality worldwide for 36 cancers in 185 countries. CA Cancer J Clin. 2018;68:394–424. - PubMed
    1. Reis-Filho JS, Pusztai L. Gene expression profiling in breast cancer: classification, prognostication, and prediction. Lancet. 2011;378:1812–1823. - PubMed
    1. Rouzier R, Perou CM, Symmans WF, Ibrahim N, Cristofanilli M, Anderson K, Hess KR, Stec J, Ayers M, Wagner P, Morandi P, Fan C, Rabiul I, Ross JS, Hortobagyi GN, Pusztai L. Breast cancer molecular subtypes respond differently to preoperative chemotherapy. Clin Cancer Res. 2005;11:5678–5685. - PubMed
    1. Perou CM, Sorlie T, Eisen MB, van de Rijn M, Jeffrey SS, Rees CA, Pollack JR, Ross DT, Johnsen H, Akslen LA, Fluge O, Pergamenschikov A, Williams C, Zhu SX, Lonning PE, Borresen-Dale AL, Brown PO, Botstein D. Molecular portraits of human breast tumours. Nature. 2000;406:747–752. - PubMed
    1. Thomas C, Gustafsson JA. The different roles of ER subtypes in cancer biology and therapy. Nat Rev Cancer. 2011;11:597–608. - PubMed

LinkOut - more resources