. 2020 Sep 16:22:1078-1091.
doi: 10.1016/j.omtn.2020.09.014. eCollection 2020 Dec 4.

Synovial Mesenchymal Stem Cell-Derived EV-Packaged miR-31 Downregulates Histone Demethylase KDM2A to Prevent Knee Osteoarthritis

Affiliations

Synovial Mesenchymal Stem Cell-Derived EV-Packaged miR-31 Downregulates Histone Demethylase KDM2A to Prevent Knee Osteoarthritis

Kunpeng Wang et al. Mol Ther Nucleic Acids. .

Abstract

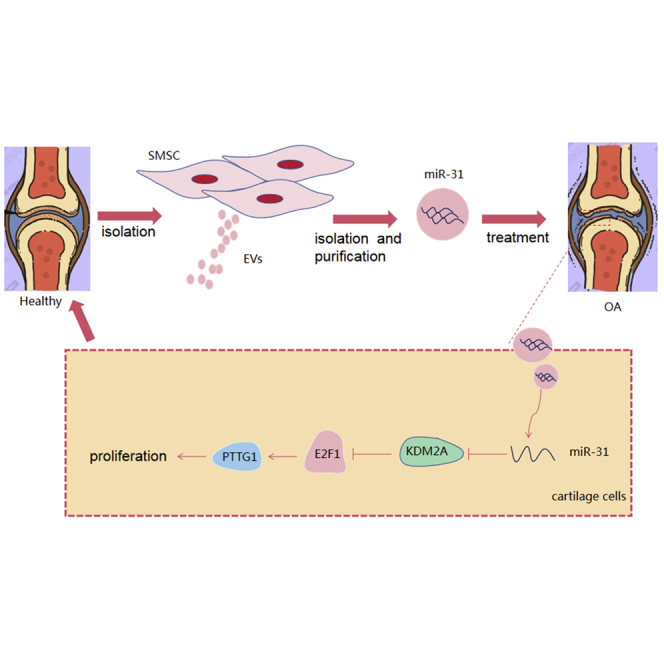
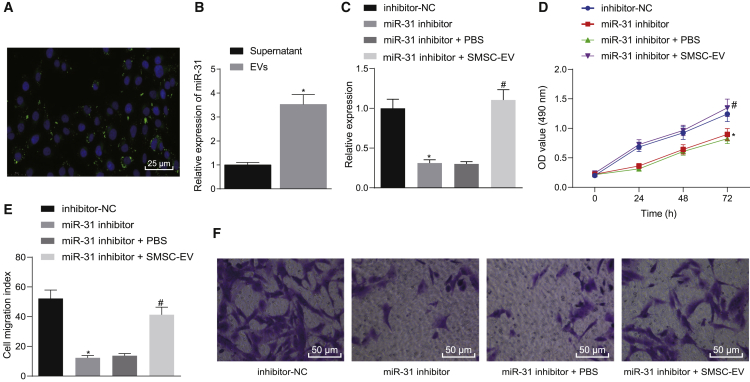
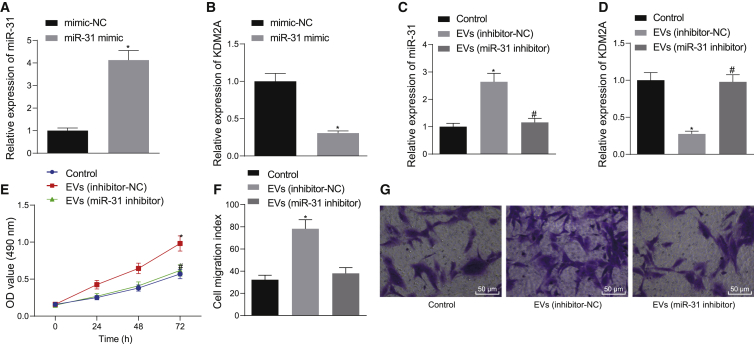
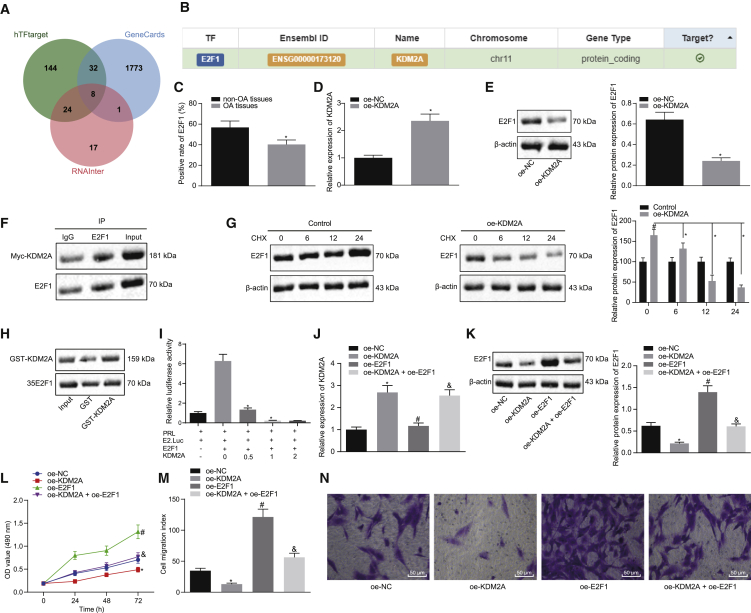
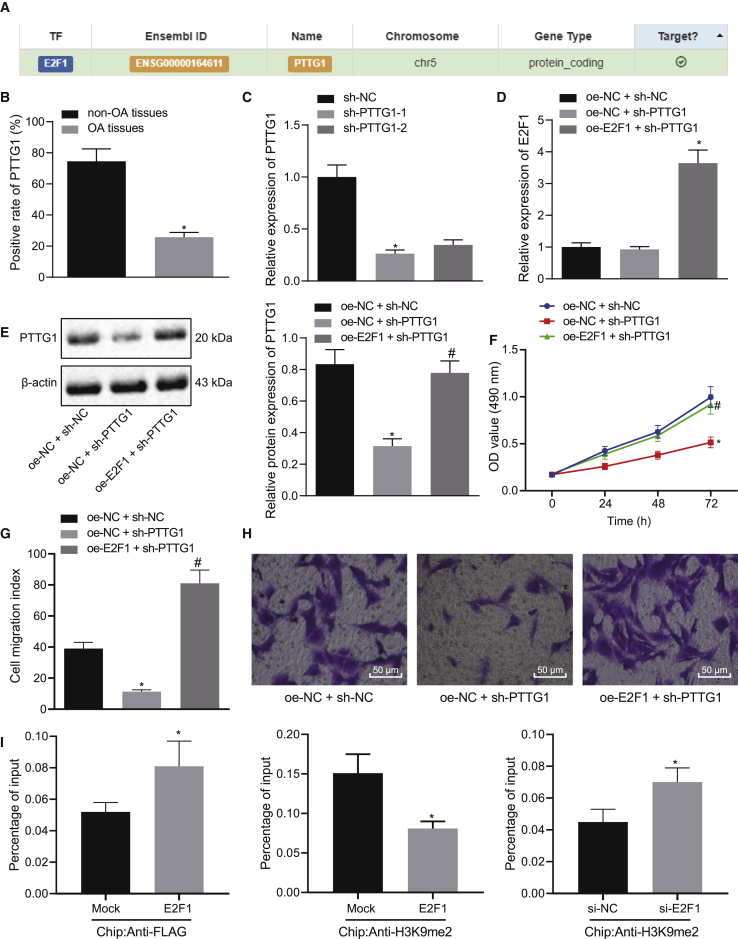
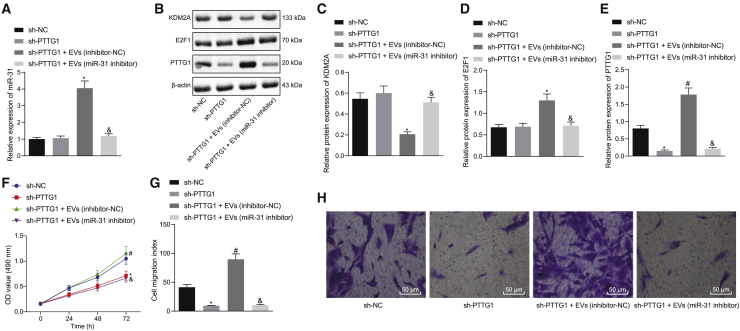
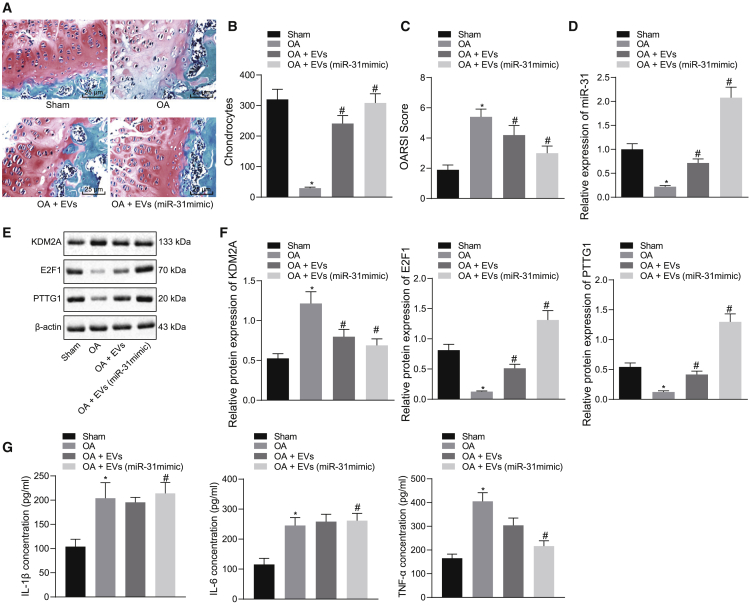
Extracellular vesicles (EVs) derived from mesenchymal stem cells (MSCs) have emerged as important mediators of intercellular communication in response to cartilage damage. In this study, we sought to characterize the inhibitory role of microRNA (miR)-31 encapsulated in synovial MSC (SMSC)-derived EVs in knee osteoarthritis (OA). The expression of miR-31, lysine demethylase 2A (KDM2A), E2F transcription factor 1 (E2F1), and pituitary tumor transforming gene 1 (PTTG1) was validated in cartilage tissues of knee OA patients. Following SMSC-EV extraction and identification, chondrocytes with the miR-31 inhibitor were added with SMSC-EVs, whereupon the effects of miR-31 on proliferation and migration of chondrocytes were assessed. The interaction among miR-31, KDM2A, E2F1, and PTTG1 in chondrocyte activities was probed in vitro, along with an in vivo mouse knee OA model. We identified downregulated miR-31, E2F1, and PTTG1 and upregulated KDM2A in cartilage tissues of knee OA patients. SMSC-EV-packaged miR-31 potentiated chondrocyte proliferation and migration as well as cartilage formation by targeting KDM2A. Mechanistically, KDM2A bound to the transcription factor E2F1 and inhibited its transcriptional activity. Enrichment of E2F1 in the PTTG1 promoter region activated PTTG1 transcription, accelerating chondrocyte proliferation and migration. SMSC-EVs and EVs from miR-31-overexpressed SMSCs alleviated cartilage damage and inflammation in knee joints in vivo. SMSC-EV-encapsulated miR-31 ameliorates knee OA via the KDM2A/E2F1/PTTG1 axis.

Keywords: E2F1; KDM2A; PTTG1; knee osteoarthritis; mesenchymal stem cell-derived extracellular vesicles; microRNA-31.


Figures

None
Graphical abstract
Figure 1
Figure 1
miR-31 Shuttled by SMSC-Derived EVs Stimulates Chondrocyte Proliferation In Vitro (A) Representative immunofluorescence micrographs of CFSE (green)-labeled EVs internalized by chondrocytes, the nucleus of which was stained with 4′,6-diamidino-2-phenylindole (DAPI; blue) (×400, scale bar, 50 μm). (B) The expression of miR-31 determined by qRT-PCR in the supernatant and in SMSC-extracted EVs. ∗p < 0.05 compared with supernatant. (C) The expression of miR-31 determined by qRT-PCR in miR-31 inhibitor-treated chondrocytes with addition of SMSC-derived EVs. (D) Chondrocyte proliferation upon miR-31 inhibitor transfection and treatment with SMSC-derived EVs measured by the CCK-8 assay. (E) The number of migrated miR-31 inhibitor-transfected chondrocytes treated with SMSC-derived EVs measured by the Transwell assay. (F) Representative images of migrating chondrocytes (×200). ∗p < 0.05 compared with inhibitor-NC-transfected chondrocytes; #p < 0.05 compared with miR-31 inhibitor-transfected chondrocytes treated with PBS. Data are shown as mean ± standard deviation of three technical replicates. Unpaired t test was applied for comparison between two groups. Data comparison among multiple groups was performed using one-way ANOVA with Tukey’s post hoc test. Data comparison between groups at different time points was performed using repeated-measures ANOVA with Bonferroni correction.
Figure 2
Figure 2
SMSC-EV-Packaged miR-31 Induces Cartilage Formation by Targeting KDM2A In Vitro (A) The expression of miR-31 determined by qRT-PCR in chondrocytes transfected with miR-31 mimic. (B) The expression of KDM2A determined by qRT-PCR in chondrocytes transfected with miR-31 mimic. ∗p < 0.05 compared with chondrocytes transfected with mimic-NC. (C) The expression of miR-31 determined by qRT-PCR in chondrocytes treated with EVs from miR-31 inhibitor-transfected SMSCs. (D) The expression of KDM2A determined by qRT-PCR in chondrocytes treated with EVs from the miR-31 inhibitor transfected with SMSCs. (E) Chondrocyte proliferation measured by the CCK-8 assay in response to EVs from miR-31 inhibitor-transfected SMSCs. (F) The number of migrated chondrocytes measured by the Transwell assay in response to EVs from miR-31 inhibitor-transfected SMSCs. (G) Representative images of migrating chondrocytes in response to EVs from miR-31 inhibitor-transfected SMSCs (×200). ∗p < 0.05 compared with the control chondrocytes without any treatment; #p < 0.05 compared with chondrocytes treated with EVs from SMSCs transfected with inhibitor-NC. Data are shown as mean ± standard deviation of three technical replicates. Unpaired t test was applied for comparison between two groups. Data comparison among multiple groups was performed using one-way ANOVA with Tukey’s post hoc test. Data comparison between groups at different time points was performed using repeated-measures ANOVA with Bonferroni correction.
Figure 3
Figure 3
KDM2A Binds to Transcription Factor E2F1 and Inhibits Its Transcriptional Activity, Thereby Impeding Chondrocyte Proliferation In Vitro (A) Venn diagram of the predicted downstream transcription factors of KDM2A by the hTFtarget and RNAInter websites with the genes related to knee OA in the GeneCards database. (B) Targeting relationship between KDM2A and the transcription factor E2F1 verified by the hTFtarget website. (C) Immunohistochemistry of E2F1 protein in articular cartilage tissues of OA (N = 54) and non-OA (N = 36) subjects. ∗p < 0.05 compared with articular cartilage tissues of non-OA subjects. (D) KDM2A mRNA expression determined by qRT-PCR in chondrocytes overexpressing KDM2A. ∗p < 0.05 compared with overexpression of NC (oe-NC)-transfected chondrocytes. (E) Representative western blots of E2F1 protein and its quantitation in chondrocytes overexpressing KDM2A. ∗p < 0.05 compared with oe-NC-transfected chondrocytes. (F) Endogenous E2F1 in Myc-labeled, KDM2A-treated chondrocytes. Input is a positive control, and IgG is a negative control. (G) Representative western blots of total E2F1 protein and its quantitation in chondrocytes treated with CHX (100 ng/mL) at 0 h, 6 h, 12 h, and 24 h. ∗p < 0.05 compared with oe-KDM2A-treated chondrocytes. ∗p < 0.05 compared with control chondrocytes. (H) GST-KDM2A fusion protein and E2F1 protein translated in vitro were used to perform a GST pulldown assay to detect exogenous E2F1. Input is a positive control, and GST is a negative control. (I) In the luciferase assay, cells of each group were treated with different doses of KDM2A to inhibit E2F1-mediated E2.Luc transcription in a dose-dependent manner. ∗p < 0.05. (J) KDM2A mRNA expression determined by qRT-PCR in chondrocytes overexpressing KDM2A or combined with E2F1. (K) Representative western blots of E2F1 protein and its quantitation in chondrocytes overexpressing KDM2A or combined with E2F1. ∗p < 0.05 compared with oe-NC-transfected chondrocytes; #p < 0.05 compared with oe-KDM2A-transfected chondrocytes; &p < 0.05 compared with oe-E2F1-transfected chondrocytes. (L) Proliferation of chondrocytes overexpressing KDM2A or combined with E2F1 measured by the CCK-8 assay. (M) The number of migrated chondrocytes overexpressing KDM2A or combined with E2F1 measured by the Transwell assay. (N) Representative images of migrating chondrocytes (×200). Data are shown as mean ± standard deviation of three technical replicates. Unpaired t test was applied for comparison between two groups. Data comparison among multiple groups was performed using one-way ANOVA with Tukey’s post hoc test. Data comparison between groups at different time points was performed using repeated-measures ANOVA with Bonferroni correction.
Figure 4
Figure 4
E2F1 Elevates Transcriptional Activation of the PTTG1 Gene and Augments Chondrocyte Proliferation In Vitro (A) Targeting relationship between E2F1 and PTTG1 retrieved in the hTFtarget website. (B) Immunohistochemistry of PTTG1 protein in articular cartilage tissues of OA (N = 54) and non-OA (N = 36) subjects. ∗p < 0.05 articular cartilage tissues of non-OA subjects. (C) Transfection efficiency of the sh-PTTG1 determined by qRT-PCR in chondrocytes. ∗p < 0.05 compared with cells treated with sh-NC. (D) mRNA expression of E2F1 determined by qRT-PCR in chondrocytes in response to transfection with sh-PTTG1 or combined with oe-E2F1. (E) Representative western blots of PTTG1 protein and its quantitation in chondrocytes in response to transfection with sh-PTTG1 or combined with oe-E2F1. ∗p < 0.05 compared with chondrocytes transfected with oe-NC + sh-NC; #p < 0.05 compared with chondrocytes transfected with oe-E2F1 + sh-NC. (F) Chondrocyte proliferation measured by the CCK-8 assay in response to transfection with sh-PTTG1 or combined with oe-E2F1. ∗p < 0.05 compared with chondrocytes transfected with oe-NC + sh-NC; #p < 0.05 compared with chondrocytes transfected with oe-E2F1 + sh-NC. (G) The number of migrated chondrocytes measured by the Transwell assay in response to sh-PTTG1 or combined with oe-E2F1. ∗p < 0.05 compared with chondrocytes transfected with oe-NC + sh-NC; #p < 0.05 compared with chondrocytes transfected with oe-E2F1 + sh-NC. (H) Representative images of migrating chondrocytes (×200). (I) The promoter region of the PTTG1 gene analyzed by microarray. The top indicates a schematic of the PTTG1 promoter region. The location of amplified fragments by qRT-PCR was based on the number of nucleotides and related to the transcription start site (TSS) (amplicon). Primer pairs are used for qRT-PCR analysis (detailed information can be seen in Materials and Methods). The intermediate, crosslinked, and sheared chromatin was immunoprecipitated with anti-FLAG antibody (left) and anti-H3K9me2 antibody (right). When E2F1 was increased, H3K9me2 was decreased, with the signal displayed as the percentage of input chromatin (bottom). The average standard deviation of three independent experiments was 6. The p value was calculated by independent sample t test (∗p < 0.05). At the bottom, we employed the anti-H3K9me2 antibody to the ChIP experiment and treated the chondrocytes with si-NC and si-E2F1. The average standard deviation of three independent experiments was 6. The p value was calculated by independent sample t test (∗p < 0.05). Data are shown as mean ± standard deviation of three technical replicates. Data comparison among multiple groups was performed using one-way ANOVA with Tukey’s post hoc test. Data comparison between groups at different time points was performed using repeated-measures ANOVA with Bonferroni correction.
Figure 5
Figure 5
SMSC-EV-Packaged miR-31 Targets KDM2A to Activate the E2F1/PTTG1 Axis, Thereby Promoting the Proliferation and Migration of Chondrocytes In Vitro sh-PTTG1-treated chondrocytes were treated with EVs from SMSCs transfected with the miR-31 inhibitor. (A) miR-31 expression determined by qRT-PCR in chondrocytes. (B) Representative western blots of KDM2A, E2F1, and PTTG1 proteins in chondrocytes. (C) KDM2A expression determined by qRT-PCR in chondrocytes. (D) E2F1 expression determined by qRT-PCR in chondrocytes. (E) PTTG1 expression determined by qRT-PCR in chondrocytes. ∗p < 0.05 compared with sh-NC-treated chondrocytes; #p < 0.05 compared with sh-PTTG1-treated chondrocytes; &p < 0.05 compared with sh-PTTG1 + EV (inhibitor-NC)-treated chondrocytes. (F) Chondrocyte proliferation measured by the CCK-8 assay. (G) The number of migrated chondrocytes measured by the Transwell assay. (H) Representative images of migrating chondrocytes (×200). Data are shown as mean ± standard deviation of three technical replicates. Data comparison among multiple groups was performed using one-way ANOVA with Tukey’s post hoc test. Data comparison between groups at different time points was performed using repeated-measures ANOVA with Bonferroni correction.
Figure 6
Figure 6
SMSC-EV-Packaged miR-31 Suppresses Knee OA through the KDM2A/E2F1/PTTG1 Axis In Vivo (A) Safranin O and fast green staining (×200) of knee joint specimens of mice treated with EVs or EVs from miR-31 mimic-transfected SMSCs. (B) Statistical analysis of chondrocyte counts in a randomly selected high-power field of view. (C) Statistical analysis of OARSI score in mice treated with EVs or EVs from miR-31 mimic-transfected SMSCs. (D) miR-31 expression was determined by qRT-PCR in tissues of OA mice treated with EVs or EVs from miR-31 mimic-transfected SMSCs. (E) Representative western blots of KDM2A, E2F1, and PTTG1 proteins in tissues of OA mice treated with EVs or EVs from miR-31 mimic-transfected SMSCs. (F) Quantitation of KDM2A, E2F1, and PTTG1 proteins. (G) The concentrations of IL-1β, IL-6, and TNF-α were determined by ELISA in synovial fluid of OA mice treated with EVs or EVs from miR-31 mimic-transfected SMSCs. ∗p < 0.05 compared with the sham-operated mice; #p < 0.05 compared with OA mice treated with EVs. Data are shown as mean ± standard deviation of three technical replicates. Data comparison was performed using one-way ANOVA with Tukey’s post hoc test. n = 10 for mice following each treatment.

Similar articles

Cited by

References

    1. Li H., Guo H., Lei C., Liu L., Xu L., Feng Y., Ke J., Fang W., Song H., Xu C. Nanotherapy in Joints: Increasing Endogenous Hyaluronan Production by Delivering Hyaluronan Synthase 2. Adv. Mater. 2019;31:e1904535. - PubMed
    1. Hunter D.J., Bierma-Zeinstra S. Osteoarthritis. Lancet. 2019;393:1745–1759. - PubMed
    1. Geiger B.C., Wang S., Padera R.F., Jr., Grodzinsky A.J., Hammond P.T. Cartilage-penetrating nanocarriers improve delivery and efficacy of growth factor treatment of osteoarthritis. Sci. Transl. Med. 2018;10:eaat8800. - PMC - PubMed
    1. Hosseinzadeh A., Kamrava S.K., Joghataei M.T., Darabi R., Shakeri-Zadeh A., Shahriari M., Reiter R.J., Ghaznavi H., Mehrzadi S. Apoptosis signaling pathways in osteoarthritis and possible protective role of melatonin. J. Pineal Res. 2016;61:411–425. - PubMed
    1. Mirzaei H., Sahebkar A., Sichani L.S., Moridikia A., Nazari S., Sadri Nahand J., Salehi H., Stenvang J., Masoudifar A., Mirzaei H.R., Jaafari M.R. Therapeutic application of multipotent stem cells. J. Cell. Physiol. 2018;233:2815–2823. - PubMed

LinkOut - more resources