

Low dose novel PARP-PI3K inhibition via nanoformulation improves colorectal cancer immunoradiotherapy
- PMID: 33294836
- PMCID: PMC7689338
- DOI: 10.1016/j.mtbio.2020.100082
Low dose novel PARP-PI3K inhibition via nanoformulation improves colorectal cancer immunoradiotherapy
Abstract
Multimodal therapy is often used in oncology to overcome dosing limitations and chemoresistance. Recently, combination immunoradiotherapy has shown great promise in a select subset of patients with colorectal cancer (CRC). Furthermore, molecularly targeted agents delivered in tandem with immunotherapy regimens have been suggested to improve treatment outcomes and expand the population of responding patients. In this study, radiation-sensitizing small molecules niraparib (PARP inhibitor) and HS-173 (PI3K inhibitor) are identified as a novel combination that synergistically enhance toxicity and induce immunogenic cell death both in vitro and in vivo in a CRC model. These inhibitors were co-encapsulated in a polymer micelle to overcome solubility limitations while minimizing off-target toxicity. Mice bearing syngeneic colorectal tumors (CT26) were administered these therapeutic micelles in combination with X-ray irradiation and anti-CTLA-4 immunotherapy. This combination led to enhanced efficacy demonstrated by improved tumor control and increased tumor infiltrating lymphocytes. This report represents the first investigation of DNA damage repair inhibition combined with radiation to potentiate anti-CTLA-4 immunotherapy in a CRC model.
Keywords: Drug delivery; Immune checkpoint blockade; Nanomedicine; Poly(2-oxazoline); Radiation therapy.
© 2020 The Author(s).
Conflict of interest statement
The authors declare that they have no known competing financial interests or personal relationships that could have appeared to influence the work reported in this paper.
Figures
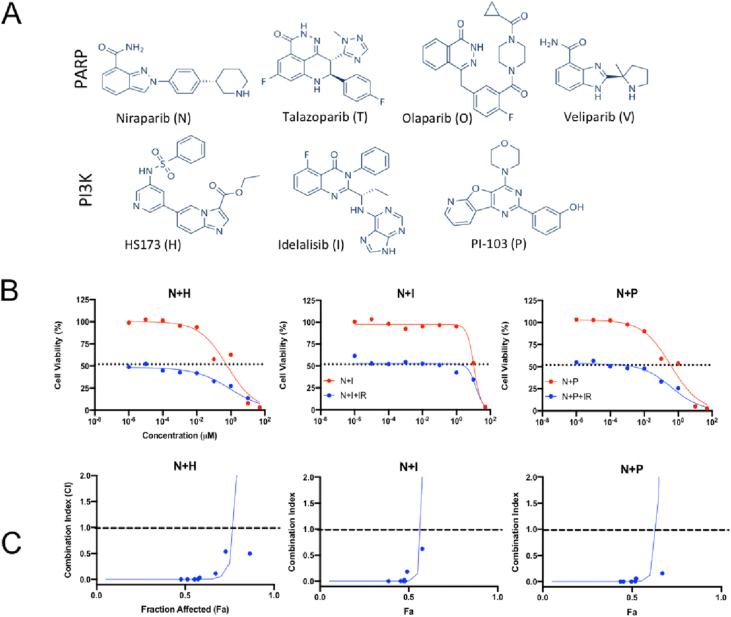
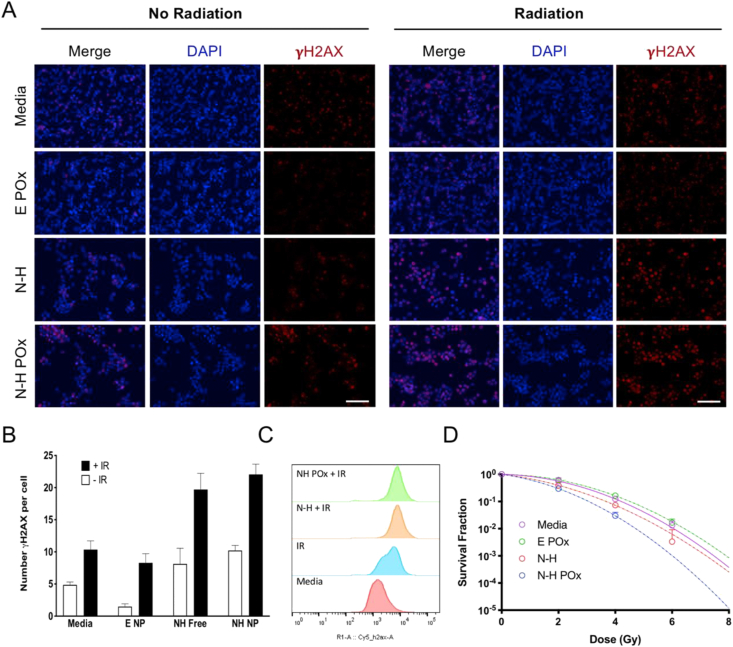
 ) and without (
 ) radiation. Radiation only controls are shown with a dotted line. (C) Combination index (CI) values with radiation were calculated and plotted to evaluate the synergy of the combination with radiation. CI > 1 represents antagonism, CI = 1 represents additivity, and CI > 1 represents synergy. The dashed line is for reference at y = 1. The full screen combination data are in Fig. S1. The N and H combination was chosen due to data in both (B) and (C).
References
-
- Cancer of the Colon and Rectum - Cancer Stat Facts. 2019. https://seer.cancer.gov/statfacts/html/colorect.html Web. 13 Dec.
-
- Kc B., Hwang J.J., Farhangfar C.J., Chai S.J. Advances in immunotherapy in the treatment of colorectal cancer. Am. J. Hematol/Oncol®. 2017;13
Grants and funding
LinkOut - more resources
Full Text Sources
Other Literature Sources
