. 2020 Nov 17;1(8):100131.
doi: 10.1016/j.xcrm.2020.100131.

Overcoming Adaptive Resistance to KRAS and MEK Inhibitors by Co-targeting mTORC1/2 Complexes in Pancreatic Cancer

Affiliations

Overcoming Adaptive Resistance to KRAS and MEK Inhibitors by Co-targeting mTORC1/2 Complexes in Pancreatic Cancer

Wells S Brown et al. Cell Rep Med. .

Abstract

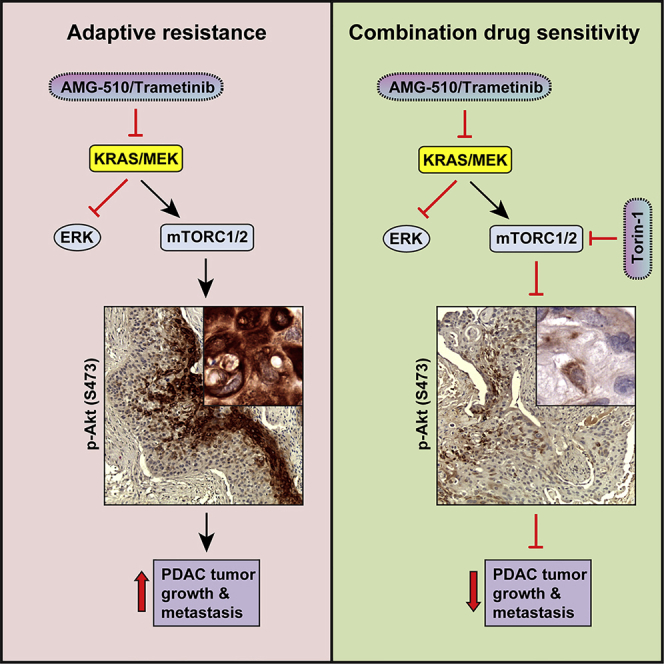
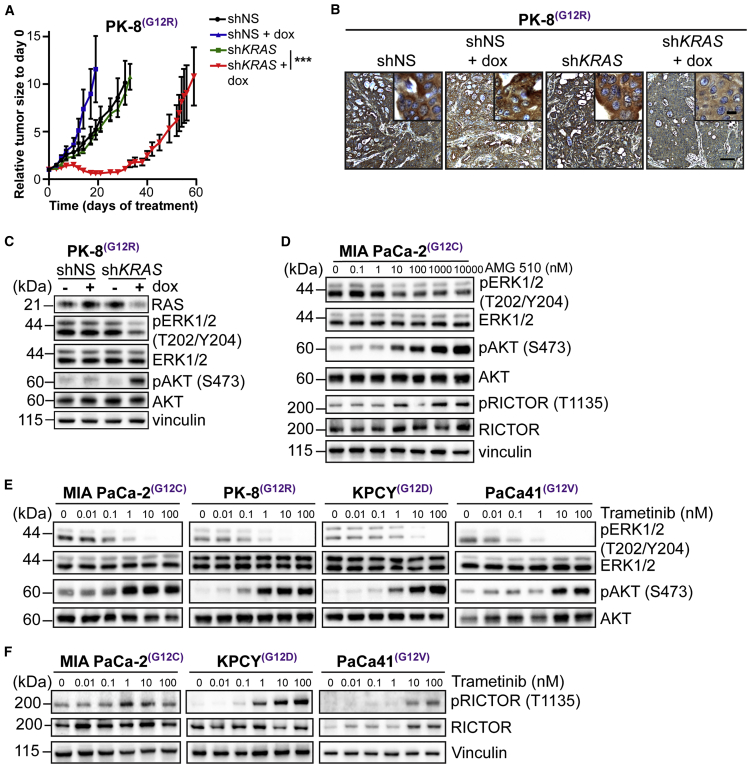
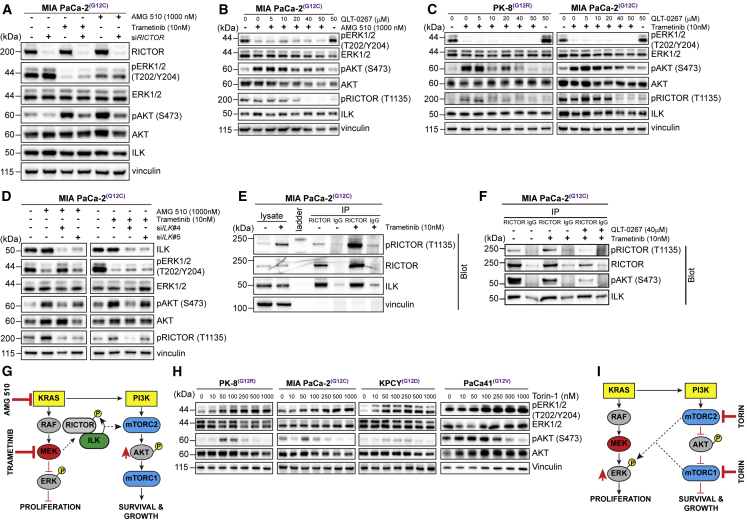
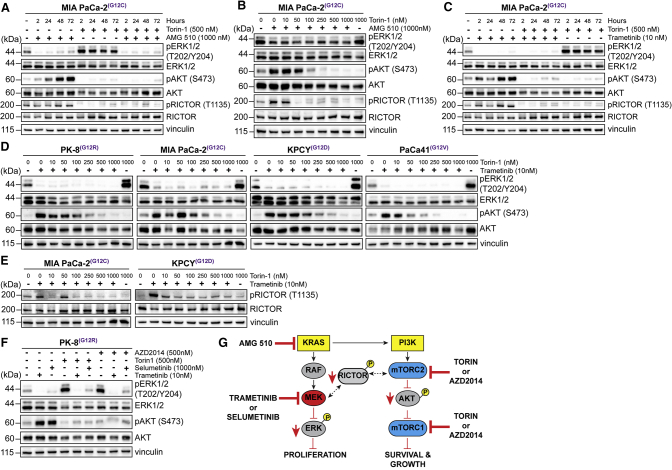
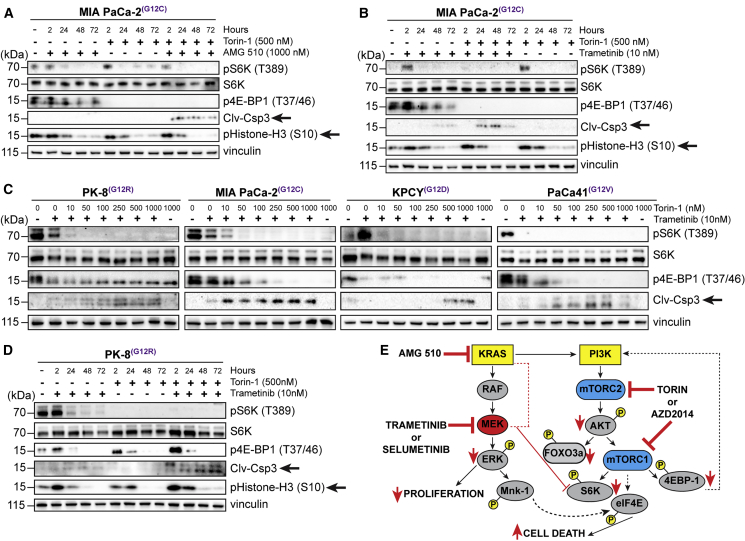
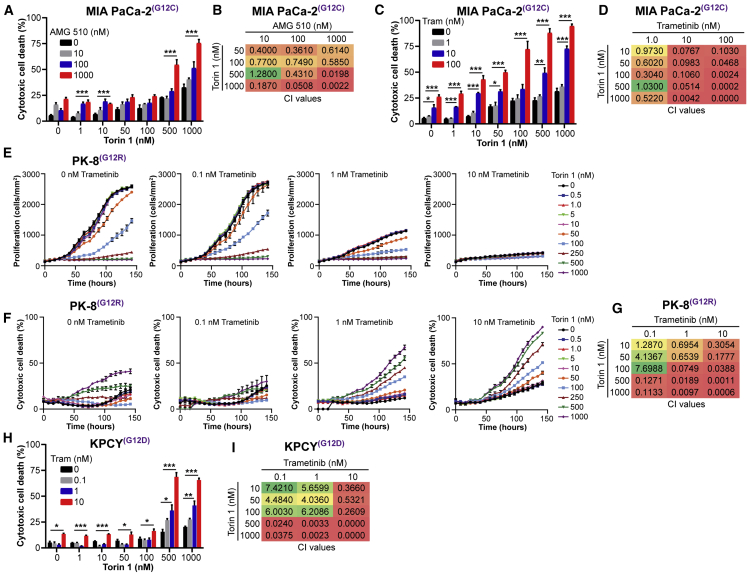
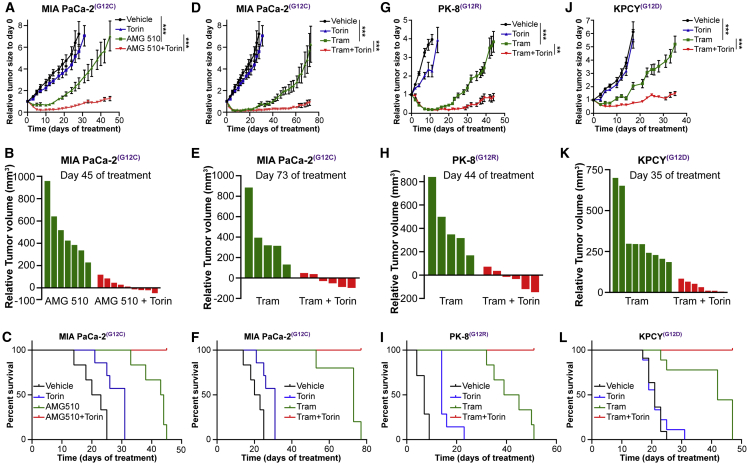
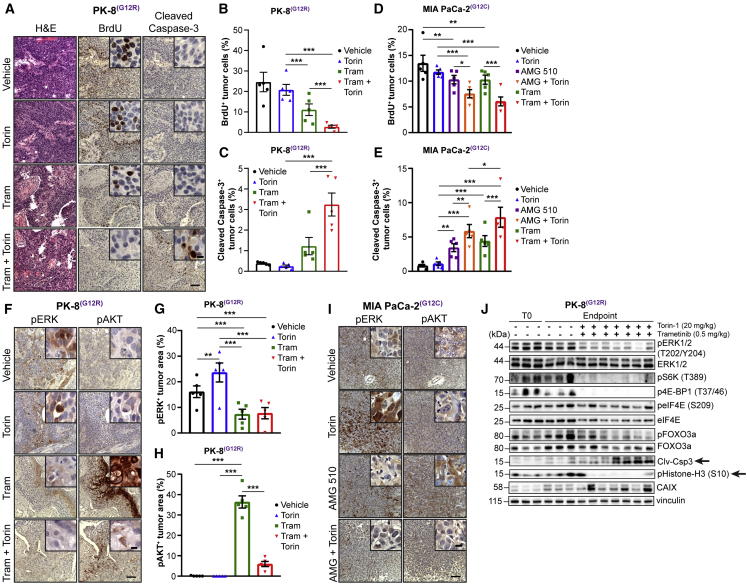
Activating KRAS mutations are found in over 90% of pancreatic ductal adenocarcinomas (PDACs), yet KRAS has remained a difficult target to inhibit pharmacologically. Here, we demonstrate, using several human and mouse models of PDACs, rapid acquisition of tumor resistance in response to targeting KRAS or MEK, associated with integrin-linked kinase (ILK)-mediated increased phosphorylation of the mTORC2 component Rictor, and AKT. Although inhibition of mTORC1/2 results in a compensatory increase in ERK phosphorylation, combinatorial treatment of PDAC cells with either KRAS (G12C) or MEK inhibitors, together with mTORC1/2 inhibitors, results in synergistic cytotoxicity and cell death reflected by inhibition of pERK and pRictor/pAKT and of downstream regulators of protein synthesis and cell survival. Relative to single agents alone, this combination leads to durable inhibition of tumor growth and metastatic progression in vivo and increased survival. We have identified an effective combinatorial treatment strategy using clinically viable inhibitors, which can be applied to PDAC tumors with different KRAS mutations.

Keywords: AMG 510; KRAS; PDAC; acquired resistance; cellular toxicity; protein translation; signal transduction; tumor regression.


Conflict of interest statement

The authors declare no competing interests.

Figures

None
Graphical abstract
Figure 1
Figure 1
Inhibition of Activated KRAS in PDAC Cells Results in Stimulation of mTORC2/AKT (A) Tumor growth curve of PK-8 xenografts (n = 4–6; mean ± SEM) administered dox to induce KRAS shRNA. ∗∗∗p < 0.001; two-way ANOVA. (B) Representative images of tumor tissue sections from PK-8 xenografts stained for expression of KRAS. Scale bar represents 100 μm; inset, 10 μm. (C) Immunoblotting of ERK and AKT phosphorylation in PK-8 cells expressing shKRAS and cultured with (+) or without (−) dox for 72 h to induce KRAS shRNA. (D) Immunoblotting of ERK, AKT, and Rictor phosphorylation in MIA PaCa-2 cells cultured with AMG 510 for 72 h. (E) Immunoblotting of ERK and AKT phosphorylation in human and mouse pancreatic cancer cell lines cultured with escalating concentrations of trametinib for 72 h. (F) Immunoblotting of Rictor phosphorylation in human and mouse pancreatic cell lines cultured as described in (E). See also Figure S1.
Figure 2
Figure 2
KRAS and MEK Inhibition Results in ILK/RICTOR-Mediated Activation of mTORC/AKT (A) Immunoblotting of ERK, AKT, and Rictor phosphorylation in MIA PaCa-2 cells depleted of Rictor using siRNA and cultured with trametinib or AMG 510 for 72 h. (B) Immunoblotting of ERK, AKT, and Rictor phosphorylation in MIA PaCa-2 cells cultured with QLT-0267 and AMG 510 for 72 h. (C) Immunoblotting of ERK, AKT, and Rictor phosphorylation in human pancreatic cell cultured with QLT-0267 and trametinib. (D) Immunoblotting of ERK, AKT, and Rictor phosphorylation in MIA PaCa-2 cells transfected with siRNAs targeting ILK and cultured with trametinib or AMG-510 for 72 h. (E) Co-immunoprecipitation of Rictor and ILK from MIA PaCa-2 cells cultured with (+) or without (−) trametinib for 72 h. Molecular weight ladder is indicated. (F) Co-immunoprecipitation of Rictor and ILK from MIA PaCa-2 cells cultured as described in (E) with (+) or without (−) QLT-0267 for 72 h. (G) Model depicting phosphorylation of Rictor and phosphorylation and activation of AKT in response to exposure to KRAS and MEK inhibitors. (H) Immunoblotting of ERK and AKT phosphorylation in human and mouse pancreatic cancer cell lines cultured with Torin 1 for 72 h. (I) Model depicting the impact of inhibiting mTORC1/2 on cell growth and proliferation. See also Figure S1.
Figure 3
Figure 3
Combinatorial Inhibition of KRAS or MEK with mTORC1/2 Prevents Upregulation of ERK and AKT Phosphorylation (A) Immunoblotting of ERK, AKT, and Rictor phosphorylation in MIA PaCa-2 cells cultured with AMG 510 and Torin 1 for the indicated times. (B) Immunoblotting of ERK, AKT, and Rictor phosphorylation in MIA PaCa-2 cells cultured with AMG 510 and escalating concentrations of Torin 1 for 72 h. (C) Immunoblotting of ERK and AKT phosphorylation in MIA PaCa-2 cells incubated with trametinib and 500 nM Torin 1 for the indicated times. (D) Immunoblotting of ERK and AKT phosphorylation in human and mouse pancreatic cancer cell lines cultured with trametinib and escalating concentrations of Torin 1 for 72 h. (E) Immunoblotting of Rictor phosphorylation in human and mouse pancreatic cell lines cultured as described in (D). (F) Immunoblotting of ERK and AKT phosphorylation in PK-8 cells incubated with MEK inhibitors and TORC1/2 inhibitors for 72 h. (G) Model depicting the impact of inhibiting MEK and mTORC1/2 in combination on cell growth and proliferation.
Figure 4
Figure 4
Co-targeting KRAS-MEK and mTORC1/2 Inhibits Protein Translation and Cell Survival Pathways in PDAC Cells (A) Immunoblotting of pS6K and 4E-BP1 phosphorylation and levels of cleaved Casp3 and histone H3 phosphorylation in MIA PaCa-2 cells cultured with AMG 510 and Torin 1 for the indicated times. (B) Immunoblotting of pS6K and 4E-BP1 phosphorylation and levels of cleaved Casp3 and histone H3 phosphorylation in MIA PaCa-2 cells incubated with trametinib and Torin 1 for the indicated times. (C) Immunoblotting of pS6K and 4E-BP1 phosphorylation and levels of cleaved Casp3 in human and mouse pancreatic cancer cell lines cultured with trametinib and escalating concentrations of Torin 1 for 72 h. (D) Immunoblotting of pS6K and 4E-BP1 phosphorylation and levels of cleaved Casp3 and histone H3 phosphorylation in PK-8 cells incubated with trametinib and Torin 1 for the indicated times. (E) Model depicting the impact of inhibiting MEK and mTORC1/2 downstream signaling pathways on cell proliferation, protein translation, and cell growth. See also Figure S1.
Figure 5
Figure 5
Co-targeting KRAS-MEK and mTORC1/2 Inhibits Cell Growth and Synergistically Enhances Cell Cytotoxicity in PDAC Cells (A) Evaluation of cytotoxic cell death of MIA PaCa-2 cells cultured for 7 days with escalating concentrations of AMG 510 and Torin 1 (n = 3). (B) Combination Index (CI) values calculated from representative data displayed in (A). (C) Evaluation of cytotoxic cell death of MIA PaCa-2 cells cultured for 7 days with escalating concentrations of trametinib and Torin 1 (n = 3). (D) CI values calculated from representative data displayed in (C). (E) Kinetic evaluation of cell proliferation of PK-8 cells cultured with escalating concentrations of trametinib and Torin 1 (n = 3). (F) Kinetic evaluation of cytotoxic cell death of PK-8 cells cultured with 0.1, 1, and 10 nM trametinib in combination with escalating concentrations of Torin 1 (n = 3). (G) CI values calculated from representative data at the 120-h time point shown in (F). (H) Evaluation of cytotoxic cell death of KPCY cells cultured for 7 days with escalating concentrations of trametinib and Torin 1. (I) CI values calculated from representative data displayed in (H). ∗p < 0.05; ∗∗p < 0.01; ∗∗∗p < 0.001; one-way ANOVA. See also Figure S1.
Figure 6
Figure 6
Combinatorial Inhibition of KRAS or MEK with mTORC1/2 Induces Sustained and Durable Inhibition of Growth of PDAC Tumors In Vivo (A, D, G, and J) Tumor growth curves of (A and D) MIA PaCa-2 xenografts (n = 6–9; mean ± SEM), (G) PK-8 xenografts (n = 6–8; mean ± SEM), and (J) KPCY syngeneic tumors (n = 7–10; mean ± SEM) administered drugs as single agents or in combination. ∗∗p < 0.01; ∗∗∗p < 0.001; two-way ANOVA. (B, E, H, and K) Waterfall plots of the response of individual tumors in mice administered (B) AMG 510 and Torin 1 after 45 days (MIA PaCa-2) of drug administration or (E, H, and K) trametinib and Torin 1 after 73 days (MIA PaCa-2), 44 days (PK-8), or 35 days (KPCY) of drug administration. (C, F, I, and L) Survival analysis of NOD/SCID IL2Rγ-/- (NSG) mice bearing (C and F) MIA PaCa-2 or (I) PK-8 tumors or (L) C57BL/6 mice bearing KPCY tumors and administered therapeutic agents as described in (A). For the MIA PaCa-2 model, the treatment arms administered AMG ± Torin 1 and trametinib ± Torin 1 are illustrated in separate panels but were evaluated in parallel in the same study with a single set of controls (vehicle and Torin 1), which are shown in both sets of panels for the purposes of clarity. See also Figures S2 and S3.
Figure 7
Figure 7
Combinatorial Inhibition of KRAS or MEK with mTORC1/2 Increases Cell Death and Mitigates pAKT-Driven Adaptive Resistance of PDAC Tumors to MEK Inhibitors In Vivo (A) Representative images of tumor tissue sections from PK-8 xenografts administered trametinib and Torin 1 and stained for H&E, BrdU, and cleaved caspase 3. Scale bar represents 100 μm; inset, 10 μm. (B and C) Quantification of BrdU (B; n = 5, each 5 fields) and cleaved caspase-3 (C; n = 5, each 5 fields). (D and E) Quantification of BrdU (D; n = 5, each 5 fields) and cleaved caspase-3 (E; n = 5, each 5 fields) in tumor tissue sections from MIA PaCa-2 xenografts administered AMG 510 and Torin 1. (F) Representative images of tumor tissue sections from PK-8 xenografts stained for pERK and pAKT. Scale bar represents 100 μm; inset, 10 μm. (G and H) Quantification of pERK (G; n = 5, each 5 fields) and pAKT (H; n = 5, each 5 fields). (I) Representative images of tumor tissue sections from MIA PaCa-2 xenografts stained for pERK and pAKT. Scale bar represents 100 μm; inset, 10 μm. (J) Immunoblotting of PK-8 tumors (n = 3–7) for the indicated proteins. Lysates are from tumors harvested at the tumor volume endpoint for each group. T0 refers to tumors harvested at the time of initiation of treatment to serve as baseline data. ∗p < 0.05; ∗∗p < 0.01; ∗∗∗p < 0.001; two-way ANOVA. See also Figures S4 and S5.

References

    1. Siegel R.L., Miller K.D., Jemal A. Cancer statistics, 2019. CA Cancer J. Clin. 2019;69:7–34. - PubMed
    1. Kleeff J., Korc M., Apte M., La Vecchia C., Johnson C.D., Biankin A.V., Neale R.E., Tempero M., Tuveson D.A., Hruban R.H., Neoptolemos J.P. Pancreatic cancer. Nat. Rev. Dis. Primers. 2016;2:16022. - PubMed
    1. Ducreux M., Seufferlein T., Van Laethem J.-L., Laurent-Puig P., Smolenschi C., Malka D., Boige V., Hollebecque A., Conroy T. Systemic treatment of pancreatic cancer revisited. Semin. Oncol. 2019;46:28–38. - PubMed
    1. Cancer Genome Atlas Research Network Integrated genomic characterization of pancreatic ductal adenocarcinoma. Cancer Cell. 2017;32:185–203.e13. - PMC - PubMed
    1. Waters A.M., Der C.J. KRAS: the critical driver and therapeutic target for pancreatic cancer. Cold Spring Harb. Perspect. Med. 2018;8:a031435. - PMC - PubMed

Publication types

MeSH terms

Substances

Grants and funding