. 2020 Nov 3;1(8):100132.
doi: 10.1016/j.xcrm.2020.100132. eCollection 2020 Nov 17.

Developing Human Skin Contains Lymphocytes Demonstrating a Memory Signature

Affiliations

Developing Human Skin Contains Lymphocytes Demonstrating a Memory Signature

Miqdad O Dhariwala et al. Cell Rep Med. .

Abstract

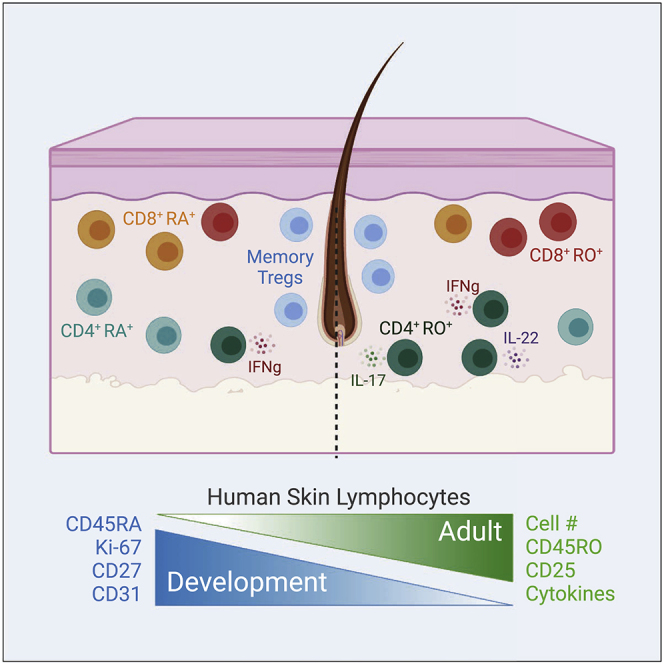
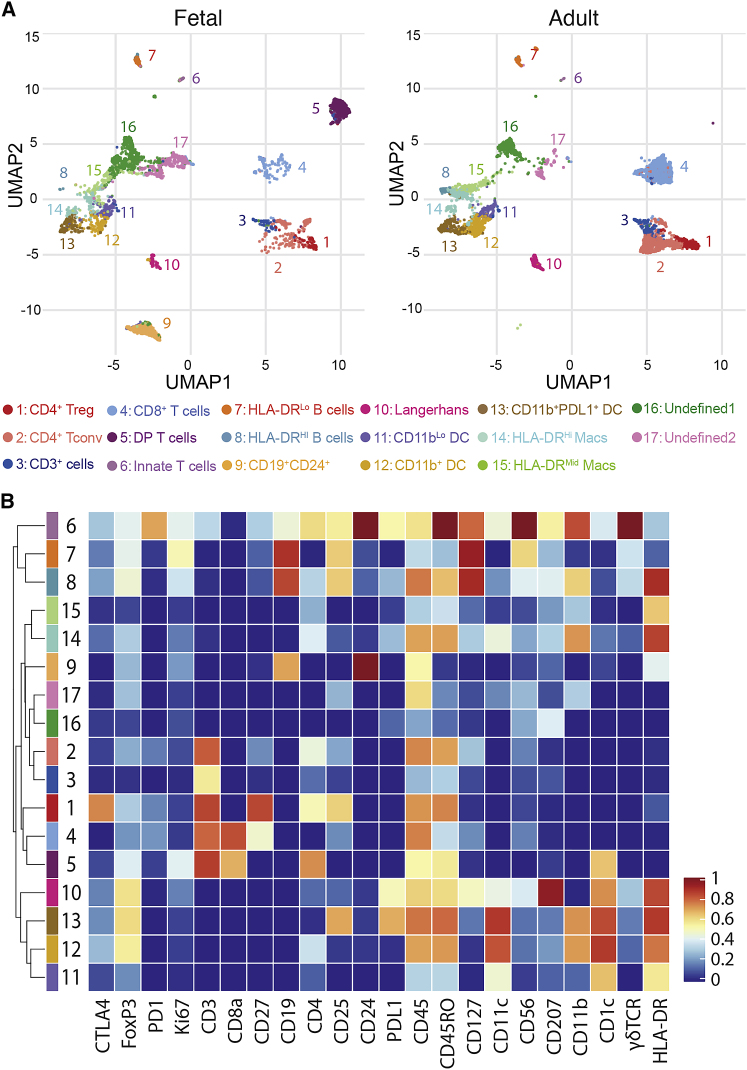
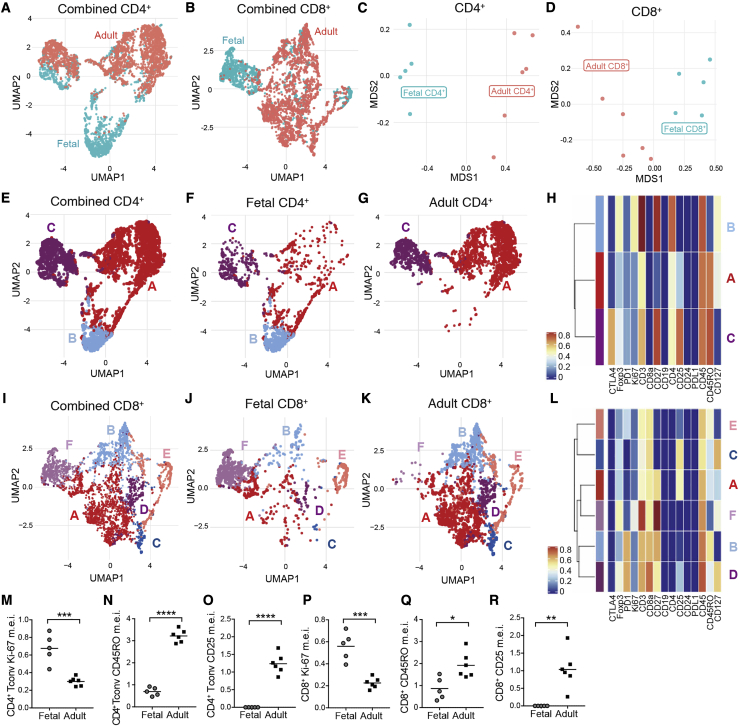
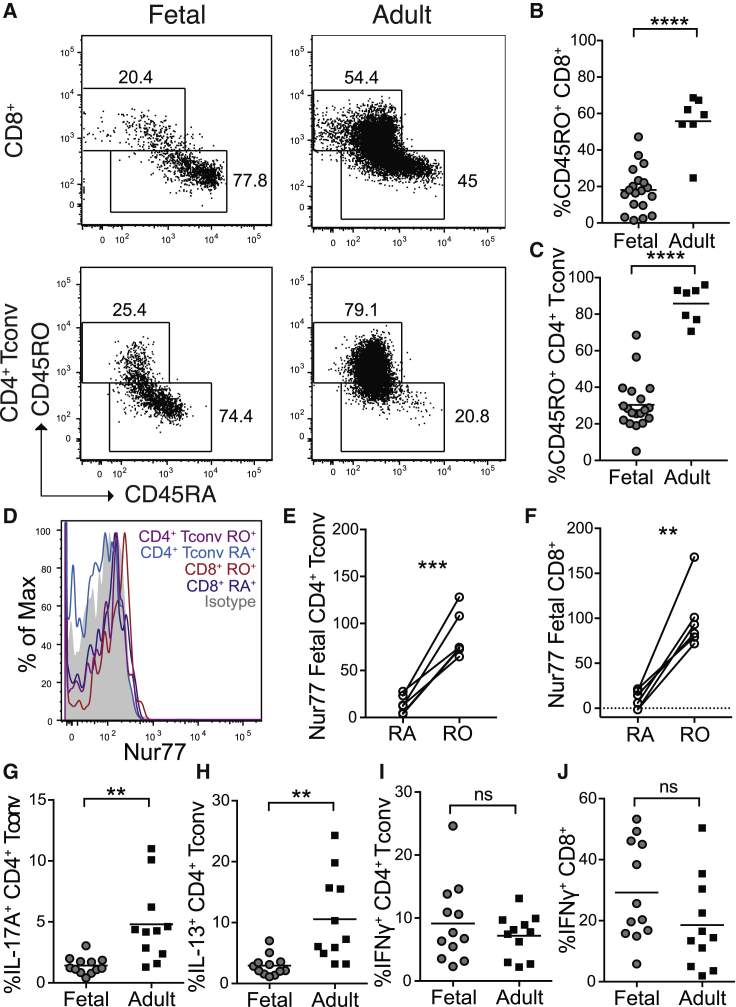
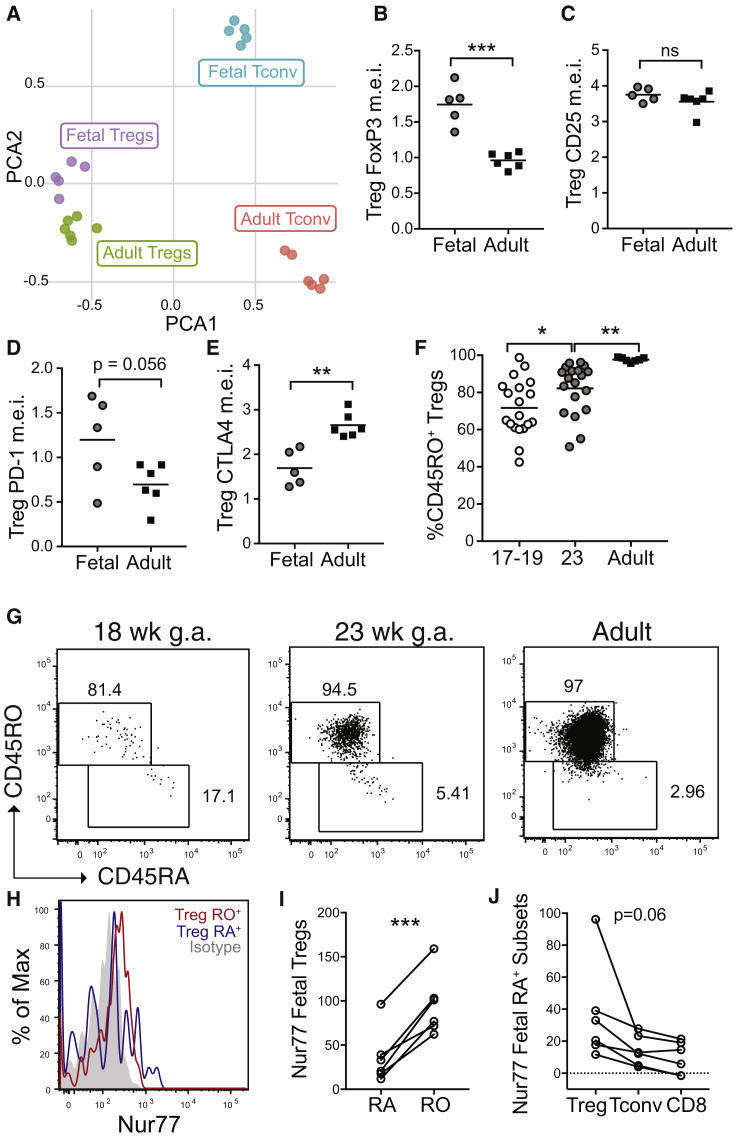
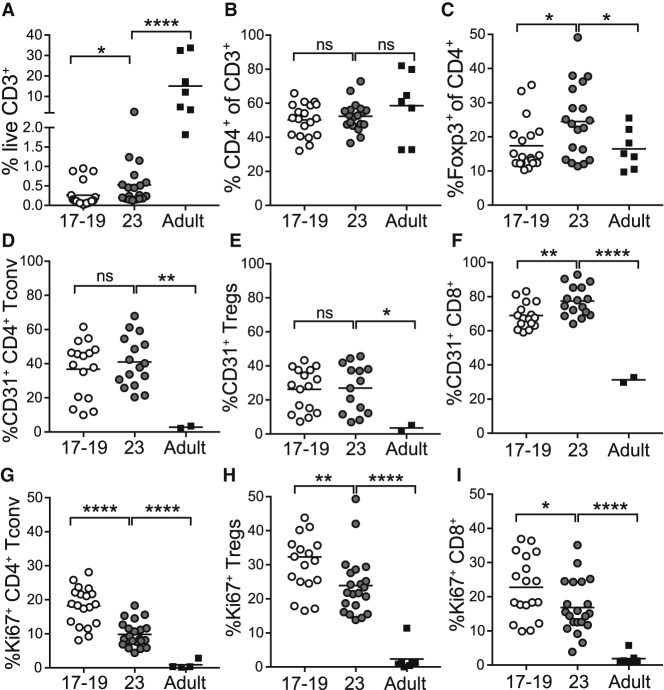
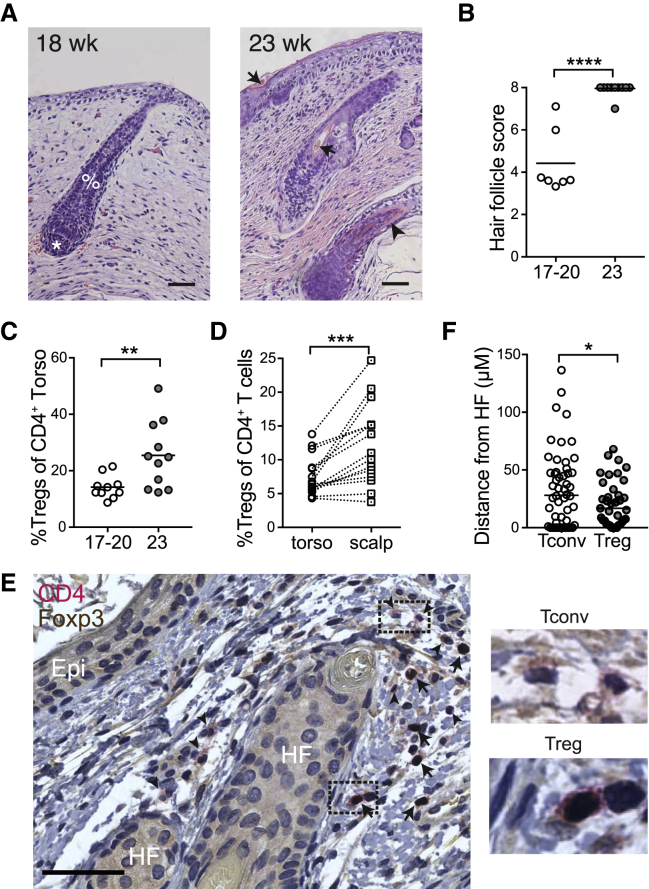
Lymphocytes in barrier tissues play critical roles in host defense and homeostasis. These cells take up residence in tissues during defined developmental windows, when they may demonstrate distinct phenotypes and functions. Here, we utilized mass and flow cytometry to elucidate early features of human skin immunity. Although most conventional αβ T (Tconv) cells in fetal skin have a naive, proliferative phenotype, a subset of CD4+ Tconv and CD8+ cells demonstrate memory-like features and a propensity for interferon (IFN)γ production. Skin regulatory T cells dynamically accumulate over the second trimester in temporal and regional association with hair follicle development. These fetal skin regulatory T cells (Tregs) demonstrate an effector memory phenotype while differing from their adult counterparts in expression of key effector molecules. Thus, we identify features of prenatal skin lymphocytes that may have key implications for understanding antigen and allergen encounters in utero and in infancy.

Keywords: Tregs; fetal; hair follicle development; human skin; lymphocytes; memory T cells; skin development.


Conflict of interest statement

M.D.R. is a founder and consultant for TRex Bio and Sitryx Bio and receives research funding from Abbvie, TRex, and LEO Pharma. K.T. is currently an employee of Amgen. E.G.L. is currently an employee of SentiBio. All other authors declare no competing interests.

Figures

None
Graphical abstract
Figure 1
Figure 1
Mass Cytometry Reveals Immune Cell Heterogeneity between Fetal and Adult Skin Twenty-three weeks gestational age (g.a.) fetal torso skin along with healthy adult skin torso samples were analyzed in parallel for 22 markers using mass cytometry. (A) Uniform manifold approximation and projection (UMAP) plots of viable CD45+ cells in fetal versus adult skin, cells colored by cluster identity, and plots annotated with cluster numbers and assigned identities. (B) Heatmap demonstrating relative expression by cluster of 22 markers in panel, inclusive of both fetal and adult cells.
Figure 2
Figure 2
Conventional αβ T Cells in Fetal Skin Largely Demonstrate a Naive, Proliferative Phenotype Live, CD4+, and CD8+ single-positive cells from 23 weeks fetal skin and adult skin processed for CyTOF were identified by surface markers and analyzed as follows. (A–D) UMAP plots of combined fetal and adult (A) CD4+ and (B) CD8+ T cells colored by skin age. Principal component analysis (PCA) plots demonstrating the distribution of all (C) CD4+ and (D) CD8+ T cells from each individual sample by age. (E) UMAP plots of CD4+ T cells from fetal and adult skin, combined. Cells are labeled and colored by cluster, with clusters A and B constituting conventional CD4+ T cells and cluster C representing Tregs. (F and G) Analogous UMAP plots containing only (F) fetal or (G) adult CD4+ T cells. (H) Heatmap demonstrating relative expression of key markers by CD4+ clusters A, B, and C. (I–K) combined and separated UMAP plots of fetal and adult skin CD8+ T cells, colored by cluster. (L) Heatmap demonstrating relative expression of key markers by each CD8+ cluster. (M–R) Median expression intensity (m.e.i.) of Ki-67 (M and P), CD45RO (N and Q), and CD25 (O and R) for fetal versus adult CD4+ Tconv and CD8+ T cells as revealed by mass cytometric analyses. Each point in (C), (D), and (M)–(R) represents data from an individual donor. ∗p < 0.05; ∗∗p < 0.01; ∗∗∗p < 0.001; ∗∗∗∗p < 0.0001.
Figure 3
Figure 3
Subsets of Fetal Skin CD4+ Tconv and CD8+ T Cells Display a Memory Phenotype and Demonstrate Capacity for IFNγ Production Cells were isolated from second trimester fetal skin (scalp and/or torso) as well as adult (torso) skin and analyzed by flow cytometry. (A) Representative plots demonstrating CD45RO expression by fetal CD8+ T cells (gated on live CD3+CD8+CD4neg) and CD4+ Tconv (gated on live CD3+CD4+CD8negFoxp3negCD25lo). (B and C) Percentage of CD45RO+ (B) CD8+ T cells and (C) CD4+ Tconv in fetal versus adult skin. (D–F) Representative histogram (D) and quantification (E and F) of Nur77 MFI on fetal skin CD45RO+ versus CD45RA+ CD4+ Tconv and CD8+ cells. (G–J) Percentage of CD4+ Tconv producing (G) IL-17A, (H) IL-13, and (I) IFNγ after PMA/ionomycin re-stimulation, and (J) percentage of IFNγ-producing CD8+ T cells. Each point in (B)–(G) represents data from an individual tissue sample; for some fetal samples data from scalp and torso skin from the same fetal donor are included as separate points. ns, not significant (p > 0.05); ∗p < 0.05; ∗∗p < 0.01; ∗∗∗p < 0.001; ∗∗∗∗p < 0.0001.
Figure 4
Figure 4
Tregs in Human Fetal Skin Demonstrate an Effector Memory Phenotype Twenty-three weeks g.a. fetal torso skin and healthy adult torso skin samples were analyzed for 22 markers using mass cytometry. (A) PCA plot of Tregs (cluster C, Figure 2) and CD4+ Tconv (clusters A & B, Figure 2) from 23 week fetal skin versus adult skin based on relative expression of key markers as assessed by mass cytometry. (B–E) Graphs showing median expression intensity (m.e.i.) of (B) Foxp3, (C) CD25, (D) PD-1, and (E) CTLA4 by mass cytometry on fetal versus adult skin Tregs. (F and G) Cells were isolated from 17–23 weeks g.a. fetal skin (scalp and/or torso) as well as adult (torso) skin and analyzed by flow cytometry. (F) Percentage of CD45RO+ Tregs in skin by age and (G) accompanying representative flow plots. (H) Representative histogram and (i) quantification of Nur77 MFI on fetal skin CD45RO+ versus CD45RA+ Tregs. (J) Nur77 in fetal skin CD45RA+ CD8+, CD4+ Tconv, and Tregs. Each point in (A)–(E) represents data from an individual donor. Points in (F), (I), and (J) point represent data from an individual tissue sample; for some fetal samples data from scalp and torso skin from the same fetal donor are included as separate points. ns, not significant (p > 0.05); ∗p < 0.05; ∗∗p < 0.01; ∗∗∗p < 0.001.
Figure 5
Figure 5
Lymphocytes Progressively Accumulate in Fetal Skin via a Combination of Thymic Egress and Local Proliferation Cells were isolated from 17–23 weeks g.a. fetal skin (scalp and/or torso) as well as adult (torso) skin and analyzed by flow cytometry. (A–C) Percentage of live CD3+ lymphocytes (A), percentage of CD4+ T cells (B), and percentage of Foxp3+ Tregs (C) by age. (D–F) Percentage of CD31+ cells among CD4+ Tconv cells (D), Tregs (E), and CD8+ T cells (F) by age. (G–I) Percentage Ki-67+ cells among CD4+ Tconv cells (G), Tregs (H), and CD8+ T (I) cells by age. Points represent data from an individual tissue sample; for some fetal samples data from scalp and torso skin from the same fetal donor are included as separate points. ns, not significant (p > 0.05); ∗p < 0.05; ∗∗p < 0.01; ∗∗∗p < 0.001; ∗∗∗∗p < 0.0001.
Figure 6
Figure 6
Treg Accumulation in Human Fetal Skin Coincides Spatiotemporally with Second Trimester Hair Follicle Development Fetal skin samples ranging from 17–23 weeks g.a. were processed for histology. (A) Representative images of tissue sections stained with H&E from 18 and 23 weeks g.a. skin. %, developing fetal hair peg with beginning inner root sheath; ∗, dermal papilla; arrows, hair shafts; arrowhead, outer root sheath. Scale bar, 50 μm. (B) Hair follicles were scored and graphed with each data point representing cumulative scores from an individual donor. (C) Percentage Tregs in fetal skin at gestational age 17–20 weeks versus 23 weeks as assessed by flow cytometry. (D) Percentage Tregs in paired torso versus scalp skin from fetal donors of less than 20 weeks g.a. Each matched set of data points originates from a different fetal skin donor. (E) Multiplex immunohistochemistry for CD4 (red chromogen, membranous staining) and Foxp3 (brown chromogen, nuclear staining) of human fetal skin. Tregs are indicated by positive brown nuclear and red membranous staining (arrows). Tconv are indicated by negative nuclear staining and positive red membranous staining (arrowheads). Images to the right of the main image represent high-power views of the corresponding dashed boxes. Epi, epidermis; HF, hair follicle. Scale bar, 50 μm. (F) Graphical results of quantitative image analysis of the distance of Treg or Tconv to the nearest hair follicle epithelial surface. Data represent enumeration of 20 high-power fields (400×) per slide. ∗p < 0.05; ∗∗p < 0.01; ∗∗∗p < 0.001; ∗∗∗∗p < 0.0001.

References

    1. Clark R.A., Chong B., Mirchandani N., Brinster N.K., Yamanaka K.-I., Dowgiert R.K., Kupper T.S. The vast majority of CLA+ T cells are resident in normal skin. J. Immunol. 2006;176:4431–4439. - PubMed
    1. Ali N., Zirak B., Rodriguez R.S., Pauli M.L., Truong H.-A., Lai K., Ahn R., Corbin K., Lowe M.M., Scharschmidt T.C. Regulatory T Cells in Skin Facilitate Epithelial Stem Cell Differentiation. Cell. 2017;169:1119–1129. - PMC - PubMed
    1. Harrison O.J., Linehan J.L., Shih H.-Y., Bouladoux N., Han S.-J., Smelkinson M., Sen S.K., Byrd A.L., Enamorado M., Yao C. Commensal-specific T cell plasticity promotes rapid tissue adaptation to injury. Science. 2019;363:eaat6280. - PMC - PubMed
    1. Hoath S.B., Maibach H.I. CRC Press; 2003. Neonatal Skin: Struture and Function.
    1. Schuster C., Vaculik C., Fiala C., Meindl S., Brandt O., Imhof M., Stingl G., Eppel W., Elbe-Bürger A. HLA-DR+ leukocytes acquire CD1 antigens in embryonic and fetal human skin and contain functional antigen-presenting cells. J. Exp. Med. 2009;206:169–181. - PMC - PubMed

Publication types

MeSH terms

Substances