

Metabolic Network Analysis Reveals Altered Bile Acid Synthesis and Metabolism in Alzheimer's Disease
- PMID: 33294859
- PMCID: PMC7691449
- DOI: 10.1016/j.xcrm.2020.100138
Metabolic Network Analysis Reveals Altered Bile Acid Synthesis and Metabolism in Alzheimer's Disease
Abstract
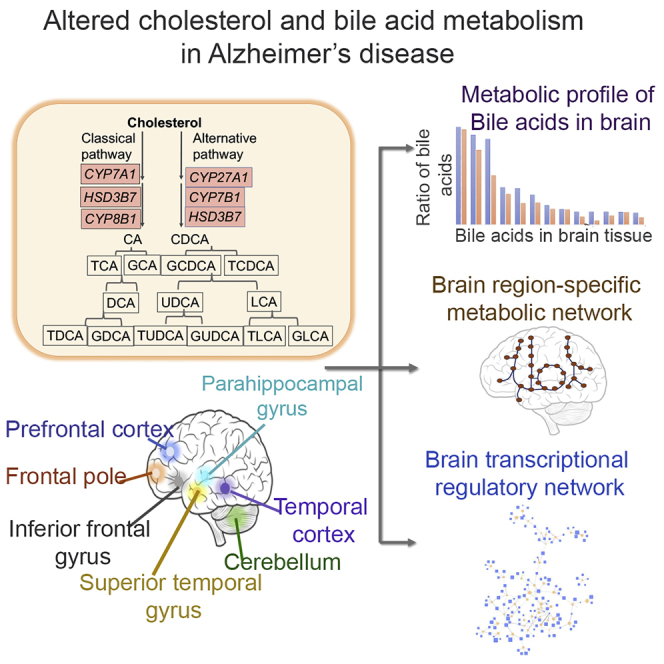
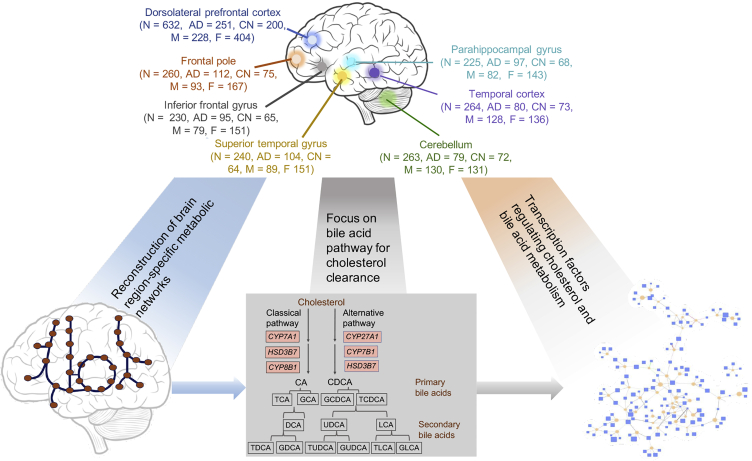
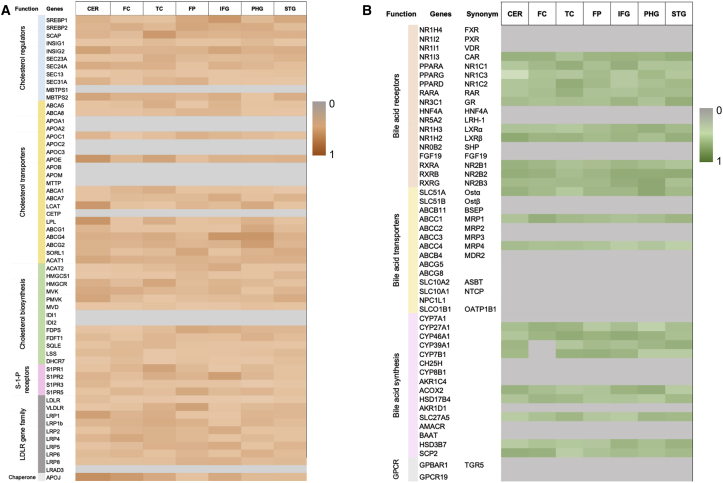
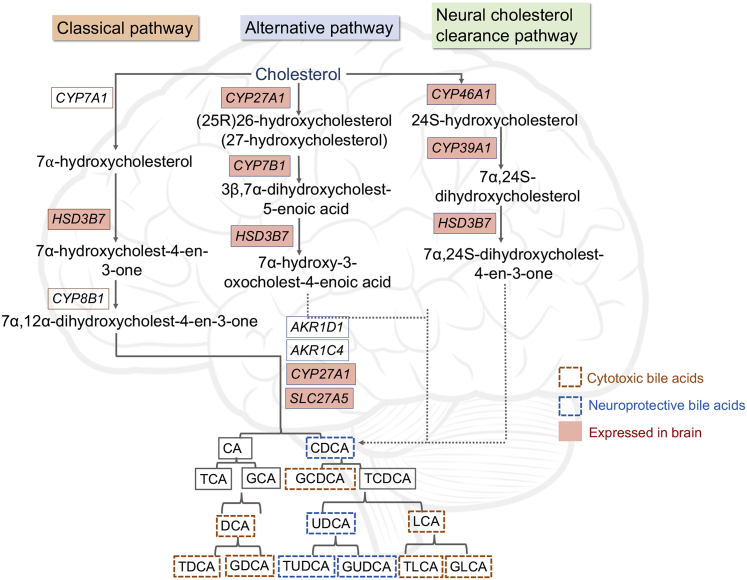
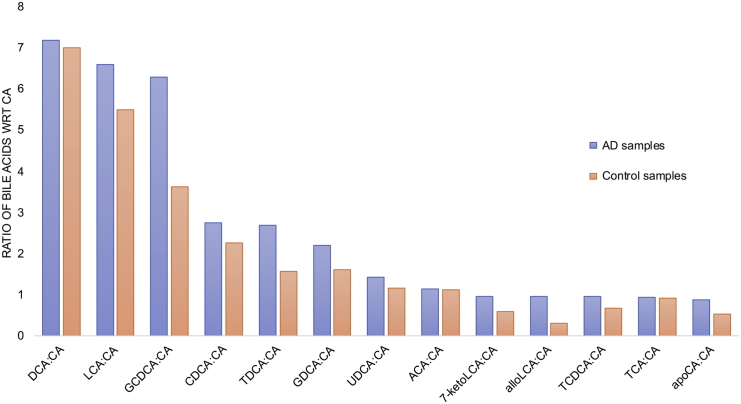
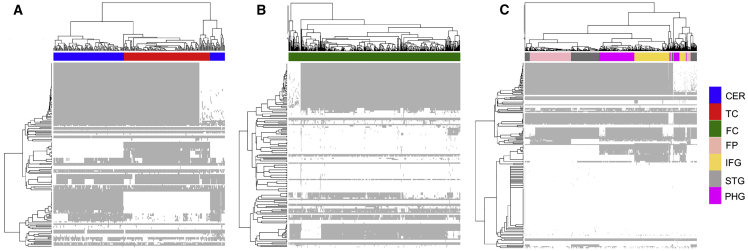
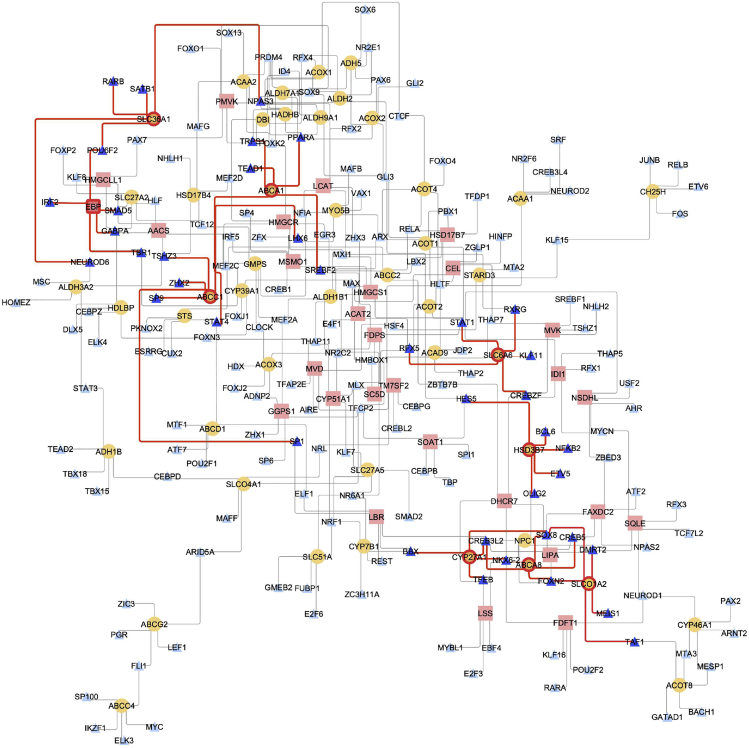
Increasing evidence suggests Alzheimer's disease (AD) pathophysiology is influenced by primary and secondary bile acids, the end product of cholesterol metabolism. We analyze 2,114 post-mortem brain transcriptomes and identify genes in the alternative bile acid synthesis pathway to be expressed in the brain. A targeted metabolomic analysis of primary and secondary bile acids measured from post-mortem brain samples of 111 individuals supports these results. Our metabolic network analysis suggests that taurine transport, bile acid synthesis, and cholesterol metabolism differ in AD and cognitively normal individuals. We also identify putative transcription factors regulating metabolic genes and influencing altered metabolism in AD. Intriguingly, some bile acids measured in brain tissue cannot be explained by the presence of enzymes responsible for their synthesis, suggesting that they may originate from the gut microbiome and are transported to the brain. These findings motivate further research into bile acid metabolism in AD to elucidate their possible connection to cognitive decline.
Keywords: Alzheimer's disease; bile acids; cholesterol metabolism; genome-scale metabolic models; metabolomics; transcriptional regulatory networks; transcriptomics.
© 2020 The Authors.
Conflict of interest statement
The authors declare no competing interests.
Figures
References
-
- Vogel J.W., Vachon-Presseau E., Pichet Binette A., Tam A., Orban P., La Joie R., Savard M., Picard C., Poirier J., Bellec P., Alzheimer’s Disease Neuroimaging Initiative and the PREVENT-AD Research Group Brain properties predict proximity to symptom onset in sporadic Alzheimer’s disease. Brain. 2018;141:1871–1883. - PMC - PubMed
Publication types
MeSH terms
Substances
Grants and funding
- R01 AG046171/AG/NIA NIH HHS/United States
- RF1 AG051550/AG/NIA NIH HHS/United States
- P30 AG010161/AG/NIA NIH HHS/United States
- R01 AG015819/AG/NIA NIH HHS/United States
- R01 AG017917/AG/NIA NIH HHS/United States
- U01 AG046152/AG/NIA NIH HHS/United States
- RF1 AG058942/AG/NIA NIH HHS/United States
- R01 AG051752/AG/NIA NIH HHS/United States
- R01 LM012535/LM/NLM NIH HHS/United States
- R03 AG054936/AG/NIA NIH HHS/United States
- P30 AG010133/AG/NIA NIH HHS/United States
- R01 AG019771/AG/NIA NIH HHS/United States
- R01 CA129769/CA/NCI NIH HHS/United States
- BB/I001735/1/BB_/Biotechnology and Biological Sciences Research Council/United Kingdom
- BB/N015932/1/BB_/Biotechnology and Biological Sciences Research Council/United Kingdom
LinkOut - more resources
Full Text Sources
Other Literature Sources
Medical
