Clinical Trial
. 2020 Nov 17;1(8):100140.
doi: 10.1016/j.xcrm.2020.100140.

Osteopontin Links Myeloid Activation and Disease Progression in Systemic Sclerosis

Affiliations
Clinical Trial

Osteopontin Links Myeloid Activation and Disease Progression in Systemic Sclerosis

Xia Gao et al. Cell Rep Med. .

Abstract

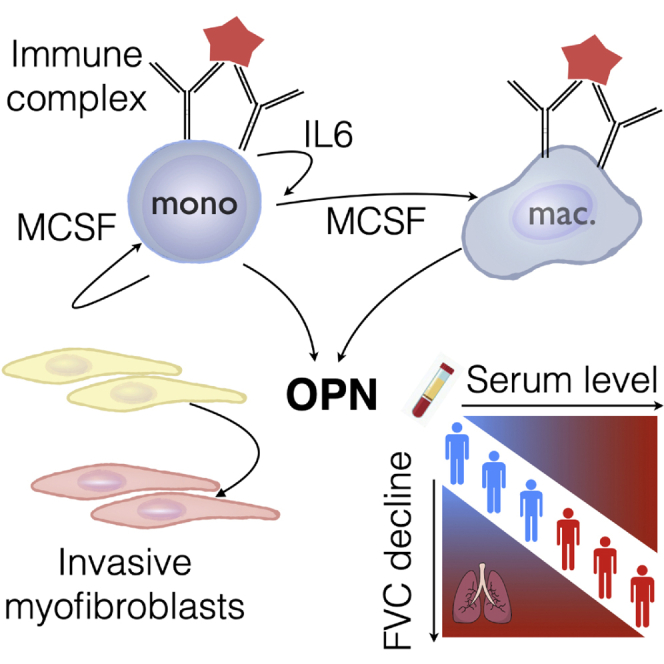
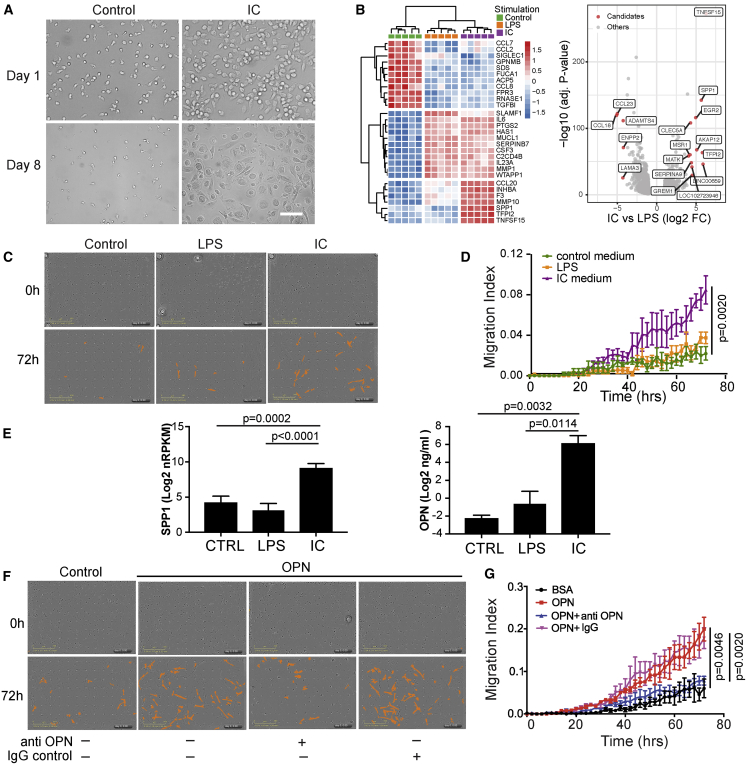
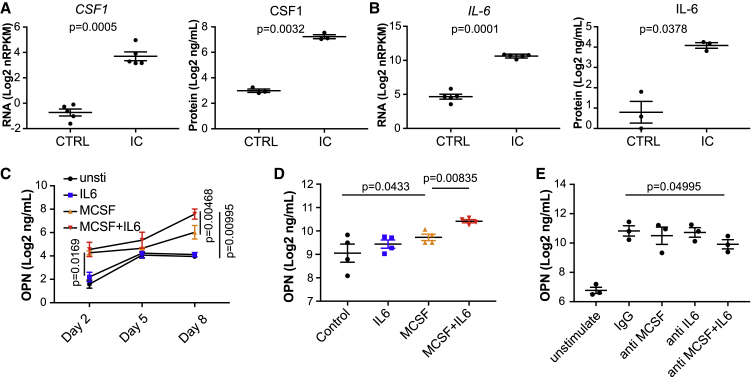
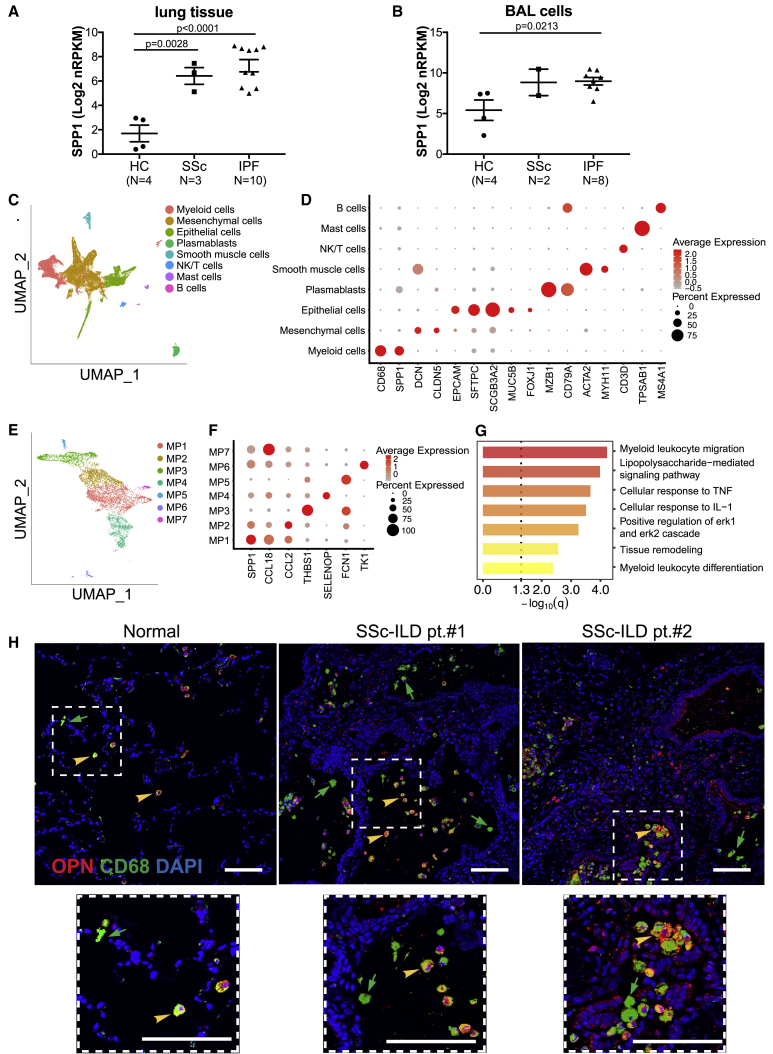
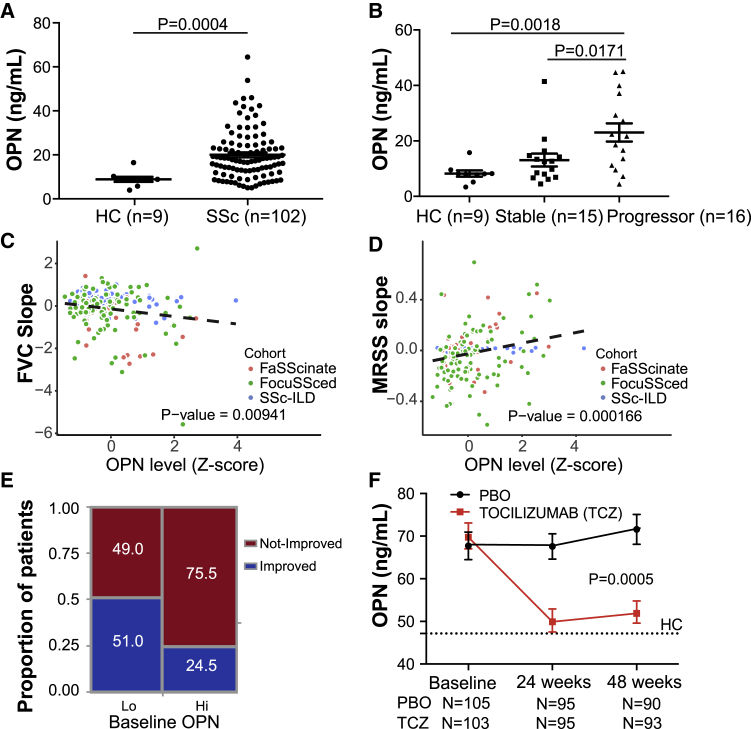
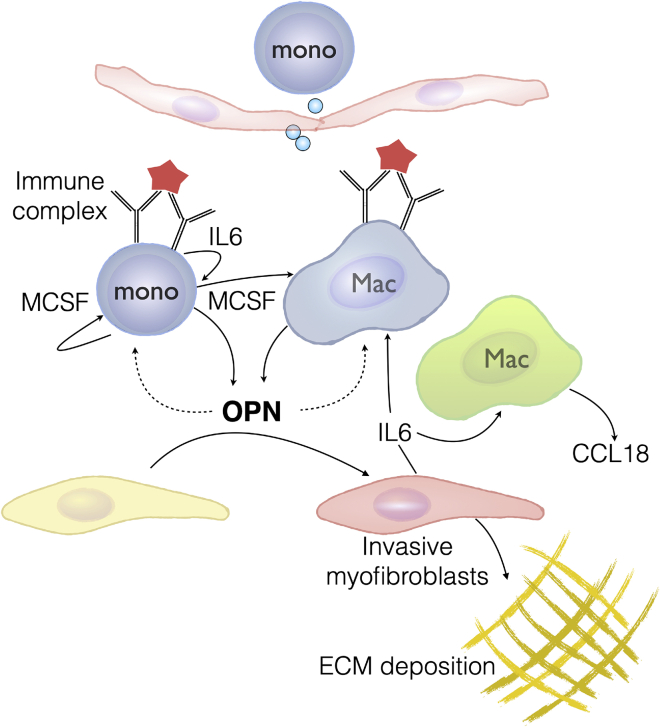
Progressive lung fibrosis is a major cause of mortality in systemic sclerosis (SSc) patients, but the underlying mechanisms remain unclear. We demonstrate that immune complexes (ICs) activate human monocytes to promote lung fibroblast migration partly via osteopontin (OPN) secretion, which is amplified by autocrine monocyte colony stimulating factor (MCSF) and interleukin-6 (IL-6) activity. Bulk and single-cell RNA sequencing demonstrate that elevated OPN expression in SSc lung tissue is enriched in macrophages, partially overlapping with CCL18 expression. Serum OPN is elevated in SSc patients with interstitial lung disease (ILD) and prognosticates future lung function deterioration in SSc cohorts. Serum OPN levels decrease following tocilizumab (monoclonal anti-IL-6 receptor) treatment, confirming the connection between IL-6 and OPN in SSc patients. Collectively, these data suggest a plausible link between autoantibodies and lung fibrosis progression, where circulating OPN serves as a systemic proxy for IC-driven profibrotic macrophage activity, highlighting its potential as a promising biomarker in SSc ILD.

Trial registration: ClinicalTrials.gov NCT01532869 NCT02453256.

Keywords: IL-6; ILD; SPP1; SSc; biomarker; fibrosis; immune complex; macrophages; osteopontin; systemic sclerosis.


Conflict of interest statement

All authors except P.J.W. and D.K. are current or past employees of Genentech, a member of the Roche group, and may hold Roche stock or stock options. D.K. is a consultant to Actelion, Acceleron, Arena, Bayer, Boehringer Ingelheim, Bristol-Myer Squibb, CSL Behring, Corbus, Cytori, GSK, Genentech/ Roche, Galapagos, Merck, Mitsubishi Tanabi, and UCB. He has received grants as part of investigator-initiated trials (to the University of Michigan) from Bayer, Bristol-Myer Squibb, and Pfizer and has stock options in Eicos Sciences, Inc. A.J. is a former employee of Genentech and is now employed by Gilead Sciences (Foster City, CA, USA).

Figures

None
Graphical abstract
Figure 1
Figure 1
IC Activation Elicits OPN Production in Monocytes (A) Morphology of primary human monocytes after 24-h immune complex (lC) stimulation on day 1 and day 8. Scale bar, 50 μm. (B) Heatmap of the top genes expressed variably between monocytes from 5 donors stimulated with IC or LPS compared with the unstimulated control. A volcano plot depicts all differentially expressed genes under IC versus LPS conditions (|log2 fold change| > 2, false discovery rate [FDR] p < 0.05). (C and D) Representative images of transmigrated primary human lung fibroblasts in response to conditioned medium from monocytes stimulated with IC or LPS. Cells migrated to the bottom surface were identified (colored orange) and (D) quantified (N = 3) by periodic imaging over 72 h of culture and automated analysis by IncuCyte software and expressed as migration index (described in STAR Methods). (E) OPN mRNA expression (N = 5) and protein secretion from human monocytes stimulated with IC or LPS (N = 3). Values are mean ± SEM, log transformed and analyzed by two-tailed paired t test. (F and G) Representative images and quantification of transmigrated primary human lung fibroblasts (N = 3) in response to rhOPN (10 μg/mL) and with or without neutralizing anti-OPN antibody (Ab). Statistical significance in (D) and (G) was assessed using a Kolmogorov-Smirnov test.
Figure 2
Figure 2
Autocrine MCSF and IL-6 Amplify OPN Production in Monocytes/Macrophages (A and B) CSF1 (MCSF) and (B) IL6 expression in primary human monocytes (N = 5) and their protein levels (N = 3) in supernatant after stimulation with IC. Values are mean ± SEM, log transformed and analyzed by two-tailed paired t test. (C) Monocyte production of OPN in response to MCSF and/or IL-6 on days 2, 5, and 8 (N = 3). OPN in supernatants were measured by ELISA. (D) OPN production by monocyte-derived macrophages stimulated with MCSF and/or IL-6 at 24 h (N = 4). (E) 24-h IC-stimulated monocytes were tested for OPN production in the presence or absence of neutralizing Abs to CSF1R and/or IL-6R on day 9 after stimulation. Values are mean ± SEM, log transformed and analyzed by one-tailed paired t test. All experiments were repeated from 3–5 different donors as specified.
Figure 3
Figure 3
Expression of OPN in Human Fibrotic Lungs (A and B) OPN RNA expression in (A) lung tissue biopsy (N = 17) and (B) BAL cells (N = 14) from healthy control (HC) subjects and individuals with SSc or IPF, measured by RNA-seq. Values are mean ± SEM and were analyzed by one-way ANOVA. (C) Cell clusters identified using canonical markers in single-cell RNA-seq data from cell suspensions of digested lung explants from individuals with SSc ILD (N = 3), visualized using a UMAP plot. (D) Expression pattern for SPP1 and other selected canonical cell type marker genes among the clusters. (E) Subclustering of the macrophages into seven discrete subtypes (MP1–MP7). (F) Expression profile of SPP1 and CCL18 among various macrophage subsets typified by a top marker gene. (G) Gene Ontology biological process enrichment among genes that are differentially expressed in SPP1-enriched and CCL18-enriched clusters (MP1 versus MP7). (H) Representative immunofluorescent staining of OPN (red), CD68 (green), and DAPI (blue) in a normal lung and two lungs from individuals with SSc ILD.
Figure 4
Figure 4
OPN Is a Prognostic Biomarker in SSc (A) Serum OPN protein levels in an observational cohort of individuals with SSc ILD (N = 102, Michigan cohort) and healthy donors (N = 9). (B) OPN levels in the Michigan cohort, clinically stratified by disease severity and progression status. Clinical demographic information and categorization definitions are provided in Table S5. Values are mean ± SEM and were analyzed by Mann-Whitney test. (C) Prognostic effect of serum OPN levels for future FVC change in three SSc cohorts. Shown is a linear regression model of percent predicted FVC (ppFVC) slope adjusted for cohorts, age, sex, and baseline ppFVC with available measurements during 1 (faSScinate, focuSSced) to 2 years (Michigan) of follow-up. Refer to Table S6 for individual cohort analyses. (D) Prognostic effect of baseline serum OPN levels for skin thickening (MRSS) change in the three SSc cohorts over time. Shown is a linear regression model of ppMRSS slope adjusted for cohorts, age, sex, and baseline MRSS with available measurements. Refer to Table S6 for individual cohort analyses. (E) Categorical CRISS response proportions of subjects from the focuSSced cohort (placebo arm), stratified by baseline serum OPN, split at median. Fisher’s exact test, 2-tailed, p = 0.0081. (F) Pharmacodynamic effect on OPN in SSc patients treated with TCZ or placebo (PBO) in the focuSSced cohort. A dotted line represents median OPN levels in age- and sex-matched HC subjects. Values are mean ± SEM. The p value was calculated based on a linear regression model, with the OPN level as response variable and time, treatment, and interaction of time and treatment as covariates.
Figure 5
Figure 5
Proposed Schematic of OPN Induction and Profibrotic Activity in SSc Tissue macrophages activated by IC trigger inflammation and OPN secretion. Infiltrating monocytes are activated by IC and differentiate into macrophages, aided by autocrine and paracrine MCSF, amplified by IL-6, and further contribute to OPN production. OPN facilitates tissue remodeling, in part by sensitizing and mobilizing fibroblasts toward other fibrogenic growth factors, and thereby contribute to fibrosis progression.

References

    1. Denton C.P., Khanna D. Systemic sclerosis. Lancet. 2017;390:1685–1699. - PubMed
    1. Steen V.D., Medsger T.A. Changes in causes of death in systemic sclerosis, 1972-2002. Ann. Rheum. Dis. 2007;66:940–944. - PMC - PubMed
    1. Furst D., Pope J., Seibold J., Bombardieri S., Denton C., Distler O., Kahaleh B., Kennedy A., Khanna D., Lafyatis R. Progress and priorities in systemic sclerosis: the next 10 years – report from the World Scleroderma Foundation. JSRD. 2016;1:7–9.
    1. Nihtyanova S.I., Denton C.P. Autoantibodies as predictive tools in systemic sclerosis. Nat. Rev. Rheumatol. 2010;6:112–116. - PubMed
    1. Walker U.A., Tyndall A., Czirják L., Denton C., Farge-Bancel D., Kowal-Bielecka O., Müller-Ladner U., Bocelli-Tyndall C., Matucci-Cerinic M. Clinical risk assessment of organ manifestations in systemic sclerosis: a report from the EULAR Scleroderma Trials And Research group database. Ann. Rheum. Dis. 2007;66:754–763. - PMC - PubMed

Publication types

Associated data