

Constructing a representative in-silico population for paediatric simulations: Application to HIV-positive African children
- PMID: 33294979
- PMCID: PMC8359354
- DOI: 10.1111/bcp.14694
Constructing a representative in-silico population for paediatric simulations: Application to HIV-positive African children
Abstract
Aims: Simulations are an essential tool for investigating scenarios in pharmacokinetics-pharmacodynamics. The models used during simulation often include the effect of highly correlated covariates such as weight, height and sex, and for children also age, which complicates the construction of an in silico population. For this reason, a suitable and representative patient population is crucial for the simulations to produce meaningful results. For simulation in paediatric patients, international growth charts from the World Health Organization (WHO) and the Centers for Disease Control and Prevention (CDC) provide a reference, but these may not always be representative for specific populations, such as malnourished children with HIV or acutely unwell children.
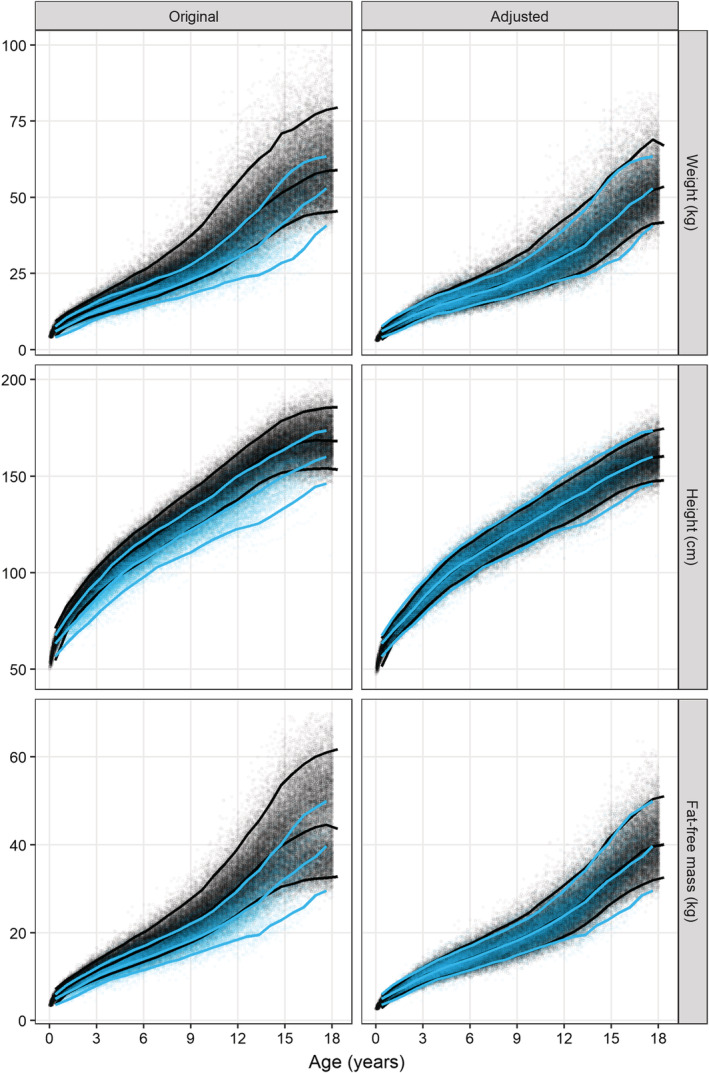
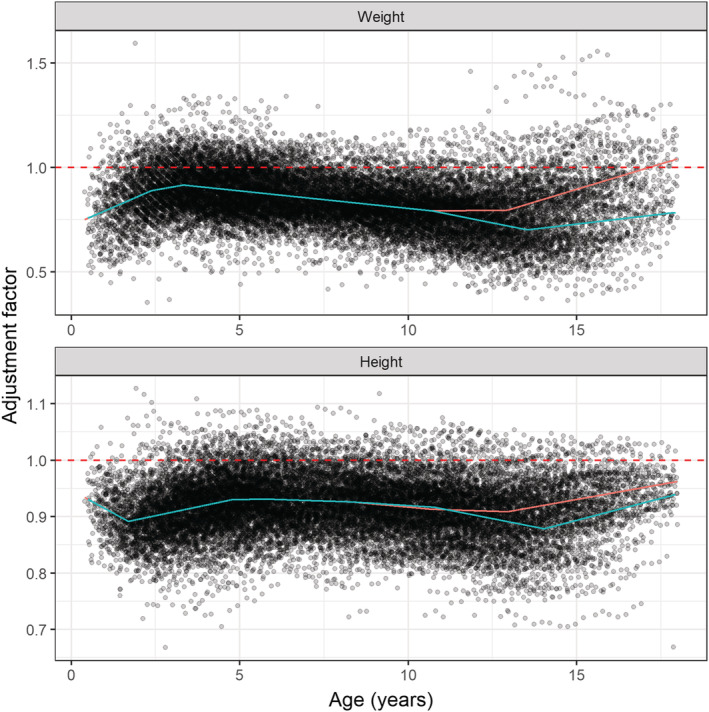
Methods: We present a workflow to construct a virtual paediatric patient population using WHO and CDC growth charts, suggest piecewise linear functions to adjust the median of the growth charts by sex and age, and suggest visual diagnostics to compare with the target population. We applied this workflow in a population of 1206 HIV-positive African children, consisting of 19 742 observations with weight ranging from 3.8 to 79.7 kg, height from 55.5 to 180 cm, and an age between 0.40 and 18 years.
Results: Before adjustment, the WHO and CDC charts produced weights and heights higher compared to the observed data. After applying our methodology, we could simulate weight, height, sex and age combinations in good agreement with the observed data.
Conclusion: The methodology presented here is flexible and may be applied to other scenarios where WHO and CDC growth standards might not be appropriate. In addition we provide R scripts and a large ready-to-use paediatric population.
Keywords: modelling; paediatric population; pharmacokinetics-pharmacodynamics; simulation; underweight; weight-for-age.
© 2020 The Authors. British Journal of Clinical Pharmacology published by John Wiley & Sons Ltd on behalf of British Pharmacological Society.
Conflict of interest statement
R.W. and P.D. are supported by PediCAP, which is part of the EDCTP programme supported by the European Union (grant number RIA2017MC‐2023). E.M.S. is supported by PanACEA, which is part of the EDCTP programme supported by the European Union (grant number TRIA2015‐1102‐PanACEA). A.S.W. and M.C. are supported by core support from the Medical Research Council UK to the MRC Clinical Trials Unit (MC_UU_12023/22) through a concordat with the Department for International Development. A.S.W. is also an National Institute for Health Research (NIHR) Senior Investigator. The views expressed are those of the author(s) and not necessarily those of the NHS, the NIHR, the Department of Health or Public Health England (PHE). P.D. receives support from the National Research Foundation (NRF) of South Africa (NRF grant 109 056).
Figures


References
-
- World Health Organization . WHO Child Growth Standards Length/Height‐for‐Age, Weight‐for‐Age, Weight‐for‐Length, Weight‐for‐Height and Body Mass Index‐for‐Age: Methods and Development. France: World Health Organization; 2006;369:1‐312. https://www.who.int/publications/i/item/924154693X
Publication types
MeSH terms
Grants and funding
LinkOut - more resources
Full Text Sources
Other Literature Sources
Medical
