. 2020 Dec 9;115(6):78.
doi: 10.1007/s00395-020-00838-4.

Inhibition of macrophage proliferation dominates plaque regression in response to cholesterol lowering

Affiliations

Inhibition of macrophage proliferation dominates plaque regression in response to cholesterol lowering

Carmen Härdtner et al. Basic Res Cardiol. .

Abstract

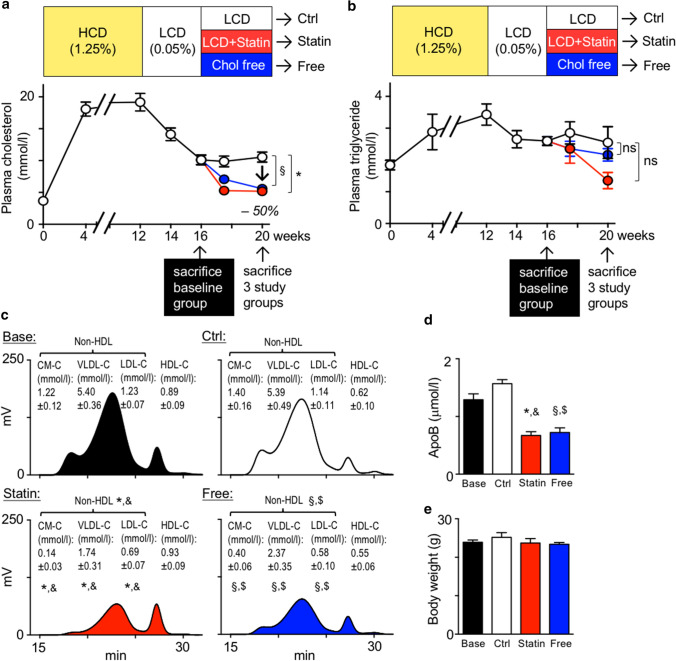
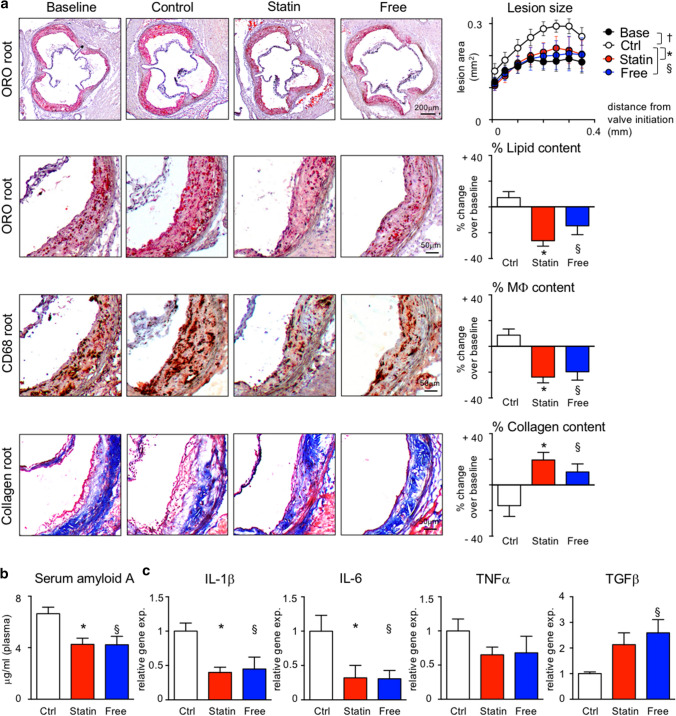
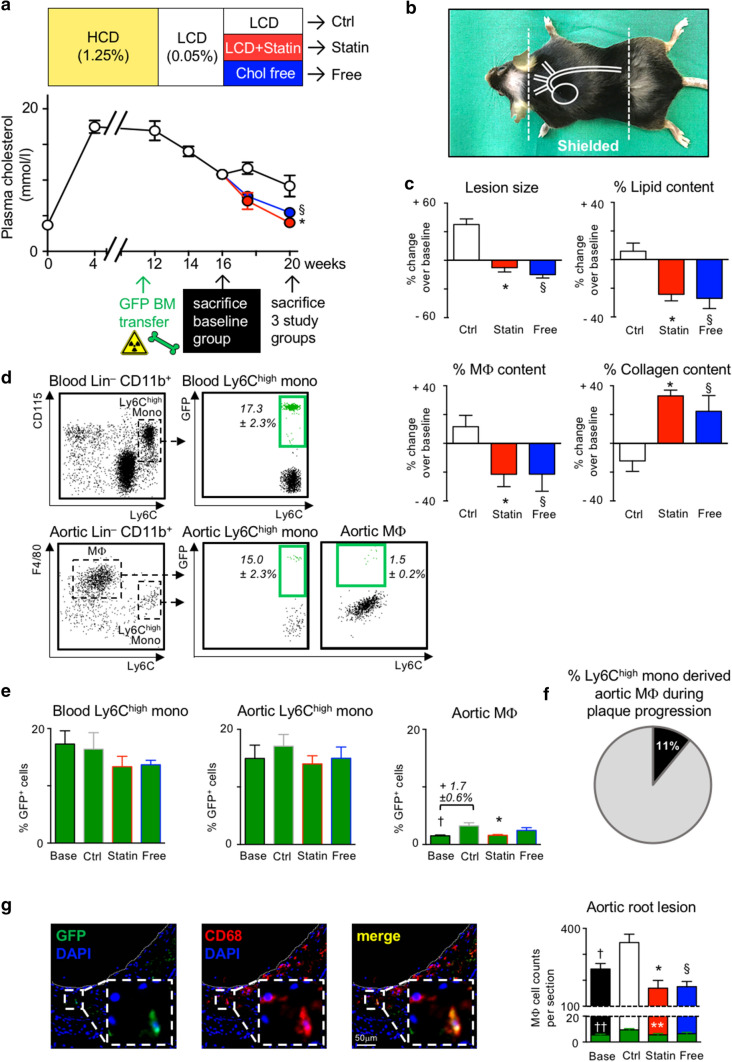
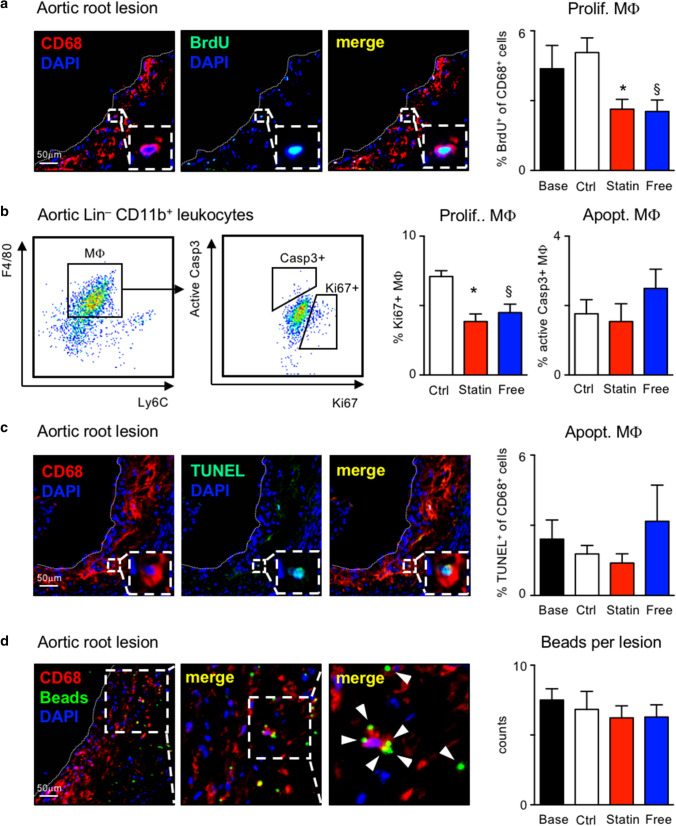
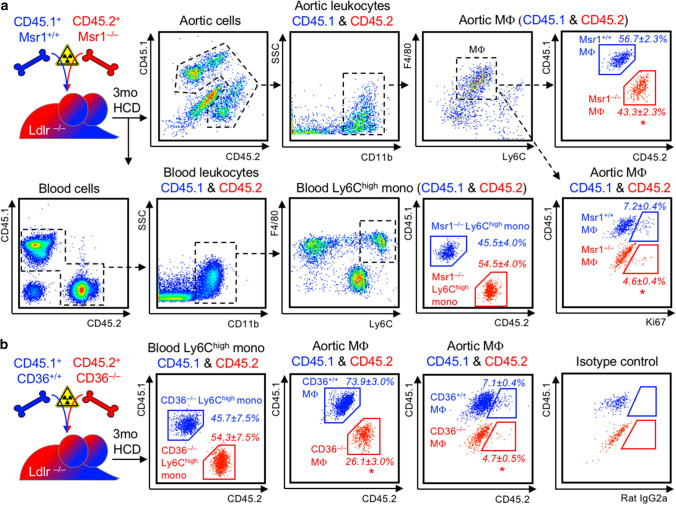
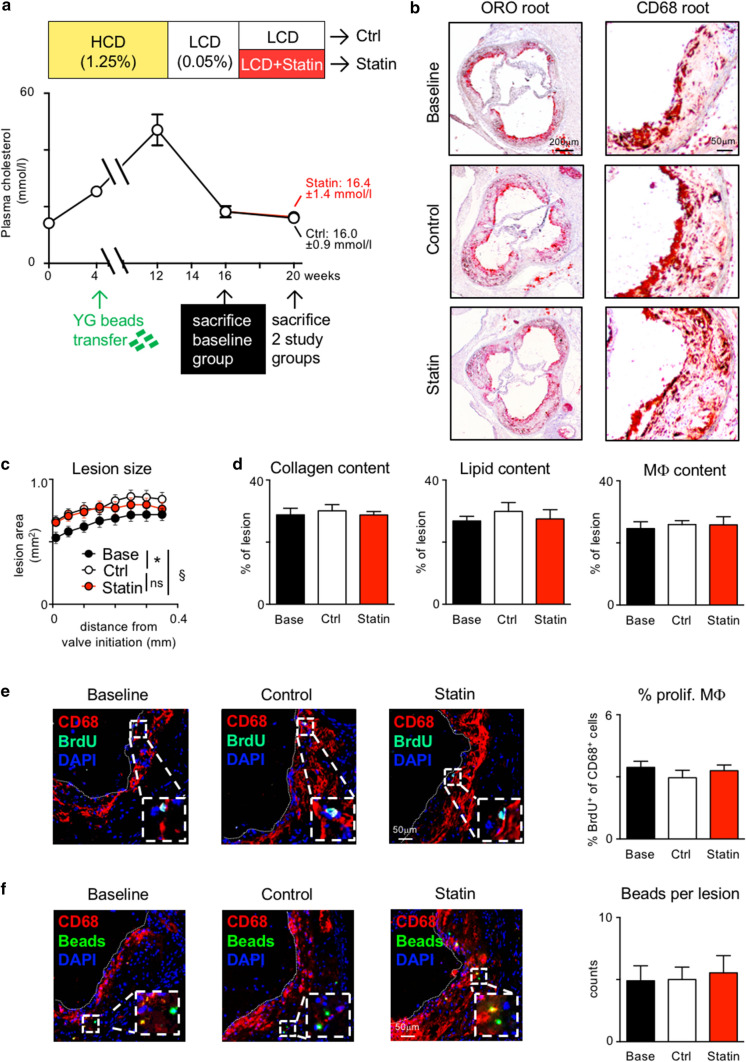
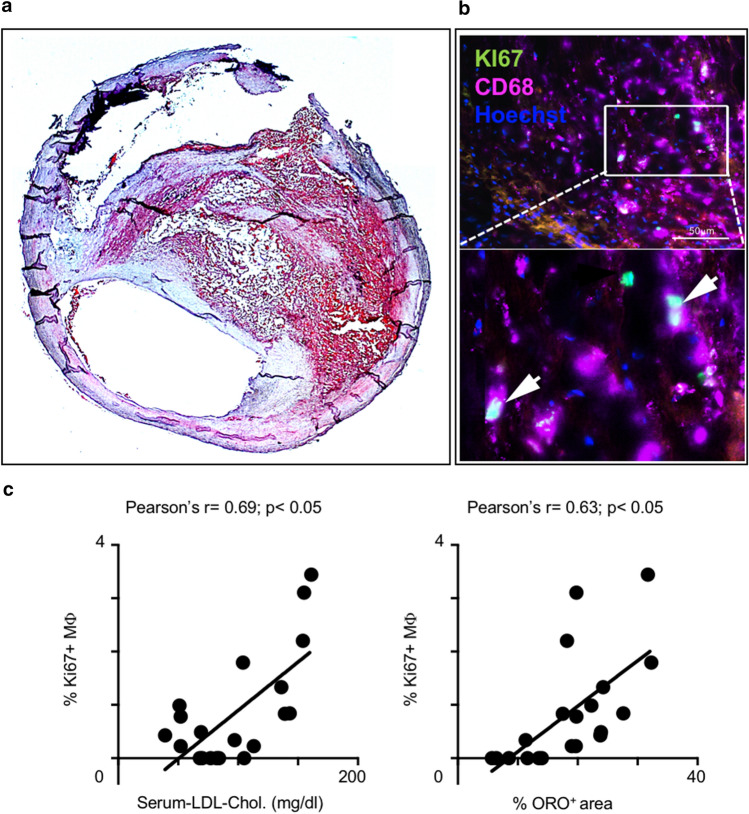
Statins induce plaque regression characterized by reduced macrophage content in humans, but the underlying mechanisms remain speculative. Studying the translational APOE*3-Leiden.CETP mouse model with a humanized lipoprotein metabolism, we find that systemic cholesterol lowering by oral atorvastatin or dietary restriction inhibits monocyte infiltration, and reverses macrophage accumulation in atherosclerotic plaques. Contrary to current believes, none of (1) reduced monocyte influx (studied by cell fate mapping in thorax-shielded irradiation bone marrow chimeras), (2) enhanced macrophage egress (studied by fluorescent bead labeling and transfer), or (3) atorvastatin accumulation in murine or human plaque (assessed by mass spectrometry) could adequately account for the observed loss in macrophage content in plaques that undergo phenotypic regression. Instead, suppression of local proliferation of macrophages dominates phenotypic plaque regression in response to cholesterol lowering: the lower the levels of serum LDL-cholesterol and lipid contents in murine aortic and human carotid artery plaques, the lower the rates of in situ macrophage proliferation. Our study identifies macrophage proliferation as the predominant turnover determinant and an attractive target for inducing plaque regression.

Keywords: Atherosclerosis; Macrophage; Plaque regression; Proliferation.


Conflict of interest statement

The authors declare no conflict of interest.

Figures

Fig. 1
Fig. 1
Experimental plaque regression study using atorvastatin and cholesterol-free diet. a, b Study design and diet scheme depicting plasma total cholesterol (a) and triglyceride (b) levels measured while feeding APOE*3-Leiden.CETP mice a high-cholesterol diet (HCD, 1.25% w/w cholesterol) for 12 weeks, followed by 4 weeks of low-cholesterol diet (LCD, 0.05% w/w cholesterol). At 16 weeks, the baseline group (Base) was sacrificed and the remaining mice were randomized to three study groups, continued LCD (control, Ctrl), LCD supplemented with 0.01% (w/w) atorvastatin (Statin), and a diet free of cholesterol (Free) for another 4 weeks. Data are presented as mean ± SEM. *,§ p < 0.05 denote statistically significant differences between the Control and Statin (*) or Control and Free (§) groups at the time of killing (week 20), n = 6 per group, one-way ANOVA. c Representative chromatograms and quantification of cholesterol in 4 major lipoprotein classes by gel-filtration HPLC. Data are presented as mean ± SEM. *,&,§,$ p < 0.05 denote statistically significant differences between the Base and Statin (&) or Base and Free ($) groups, and between Control and Statin (*) or Control and Free (§) groups at the time of sacrifice, n = 6 per group, one-way ANOVA. d ApoB plasma levels at the time of sacrifice. Results are presented as mean ± SEM, *,&,§,$ p < 0.05 denote statistically significant differences between the Base and Statin (&) or Base and Free ($) groups, and between Control and Statin (*) or Control and Free (§) groups at the time of sacrifice, n = 6 per group, one-way ANOVA. e Final body weight in all 4 groups at time of killing (Base n = 6, n = 8 other groups)
Fig. 2
Fig. 2
Serum cholesterol lowering leads to phenotypic plaque regression in APOE*3-Leiden.CETP mice. a Representative images of aortic root sections stained with Oil-red O (ORO), anti-CD68 (for macrophages, Mϕ) and Masson’s Trichrome (for collagen) on the left. On the right, lesion area was measured on 8 aortic root sections at 50 m intervals starting from valve initiation. Plaque composition was analyzed by quantifying the percent ORO+, CD68+ and collagen+ areas within lesions. Data are presented as mean ± SEM percent change over values in the baseline group to visualize relative changes during plaque progression and regression. *,§,† p < 0.05 denote statistically significant differences between the Ctrl and Base (†), Statin (*) and Free (§) groups, respectively, baseline n = 6, other 3 groups n = 8 per group, one-way ANOVA. (b) Serum amyloid A plasma levels at the time of sacrifice. Results are presented as mean ± SEM, *,§p < 0.05 denote statistically significant differences between the Ctrl and Statin (*) or Free (§) groups, n = 8 per group, one-way ANOVA. c Cytokine expression in atherosclerotic aortas. Results are presented as mean ± SEM fold change over control group values, *,§p < 0.05 denote statistically significant differences between the Ctrl and Statin (*) or Free (§) groups, n = 8 per group, one-way ANOVA
Fig. 3
Fig. 3
Serum cholesterol lowering reduces lesional macrophage accumulation in established disease, mostly independent of monocyte infiltration in APOE*3-Leiden.CETP mice. a, b Study design and diet scheme in analogy to Fig. 1a, modified by APOE*3-Leiden.CETP mice undergoing lethal irradiation at week 11 of HCD feeding while shielding the heart and aorta b with lead followed by GFP+ bone marrow cell transplantation. Plasma cholesterol levels at indicated time points are presented as mean ± SEM. *,§ p  <  0.05 denote statistically significant differences between the Ctrl and Statin (*) or Free (§) groups at the time of sacrifice (week 20), n  =  8 per group and time point, one-way ANOVA. c Quantification of atherosclerotic lesion size and plaque composition in the aortic root. Data are presented as mean ± SEM percent change over values in the baseline group to visualize relative changes during plaque progression and regression. *,§ p  <  0.05 denote statistically significant differences between the Ctrl and Statin (*) or Free (§) groups, baseline n =  6, all other 3 groups n =  8 per group, one-way ANOVA. Representative images are shown in Supplemental Fig. 4d. d Representative images of flow cytometric dot plots showing CD11b+ leukocytes in the aorta and blood at baseline, 5 weeks after GFP+ bone marrow cell transplantation. Data for GFP chimerism among Ly6Chigh monocyte and Mϕ are presented as mean ± SEM. e Flow cytometry based quantification of the GFP chimerism among Ly6Chigh monocytes and macrophages (Mϕ) in the blood and aortic cell suspensions, respectively, in all four groups. Results are presented as mean ± SEM, *,† p  <  0.05 denote statistically significant differences between the Ctrl and Base (†) or Statin (*) groups, n  =  6 (baseline) and n = 8 all other groups, one-way ANOVA. f Estimation of the Ly6Chigh monocyte contribution to the pool of aortic Mϕ based on the changes in GFP chimerism during plaque progression (weeks 16–20). g Immunofluorescence histology-based quantification of GFP+ (green) cells among all CD68+ Mϕ in aortic root lesions on the right, and representative images of GFP, CD68 and DAPI co-stainings on the left. Results are presented as mean ± SEM, *,§,† p  <  0.05 denote statistically significant differences in all CD68+ Mϕ cell numbers between the Ctrl and Statin (*), Free (§) or Base (†) groups. **,††p < 0.05 denote statistically significant differences in GFP+ CD68+ Mϕ cell numbers between the Ctrl and Base (††) or Statin (**)groups, n  =  6–8 per group, one-way ANOVA. Representative images for all groups are shown in Supplemental Fig. 4d
Fig. 4
Fig. 4
Serum cholesterol lowering inhibits lesional macrophage proliferation in APOE*3-Leiden.CETP mice. a Representative images of aortic root lesions stained for CD68, BrdU on the left, and quantification on the right, and b representative flow cytometry dot plots (left), and quantification (right) of proliferating aortic Mϕ expressing Ki67+ and apoptotic aortic Mϕ expressing active Caspase 3 (Casp3+). c, d Representative images of aortic root lesions stained for CD68, TUNEL c, and YG-fluorescent beads d on the left, and quantification on the right. Results are presented as mean ± SEM, *,§p < 0.05 denote statistically significant difference between the Ctrl and Statin (*) or Free (§) groups, n = 8 per group for histology and n = 6 per group for flow cytometry readouts, one-way ANOVA
Fig. 5
Fig. 5
Cholesterol-rich modified LDL-uptake-mediating scavenger receptors Msr1 and CD36 directly propagate MF proliferation in plaques. a Ldlr–/– mice were irradiated and reconstituted with a 1:1 mixture of CD45.1 Msr1+/+ and CD45.2 Msr1–/– bone marrow cells for 6 weeks before starting a high-cholesterol diet (HCD) for 3 months. Msr1+/+ and Msr1–/– Ly6Chigh monocytes (mono) in blood and macrophages (Mϕ) in enzymatically digested atherosclerotic aortas were distinguished based on exclusive CD45.1 and CD45.2 expression, as depicted in the representative dot plots and gating strategies. The chimerism of Msr1+/+ and Msr1–/– within blood Ly6Chigh monocytes and aortic Mϕ was quantified based on CD45.1 and CD45.2 staining, and the fraction of proliferating cells was assessed based on intracellular Ki67 staining in Msr1+/+ and Msr1–/– MF. Results are presented as mean percent ± SEM cell chimerism and Ki67+ fraction of the respective population, n = 4 per group, *p < 0.05 denotes statistically significant differences between Msr1+/+ and Msr1–/– Ly6Chigh monocyte or Mϕ population, Mann–Whitney test. b Mixed CD45.1 CD36+/+ and CD45.2 CD36–/–irradiation bone marrow chimeras were generated in Ldlr–/– mice and analyzed in analogy to Msr1+/+/Msr1–/– chimeras, as described above. Results are presented as mean percent ± SEM cell chimerism and Ki67+ fraction of the respective population, n = 4 per group, *p < 0.05 denotes statistically significant differences between CD36+/+ and CD36–/– Ly6Chigh monocyte or Mϕ population, Mann–Whitney test
Fig. 6
Fig. 6
Atorvastatin fails to induce plaque regression without cholesterol lowering in Apoe–/– mice. a Study design and diet scheme similar to Fig. 1a with Apoe–/– mice fed a high-cholesterol diet (1.25% cholesterol) for 12 weeks, followed by 4 weeks of low-cholesterol diet (LCD, 0.05% cholesterol) (Baseline, Base), and 4 weeks of continued LCD (Control, Ctrl) versus LCD supplemented with 0.01% (w/w) atorvastatin (Statin). bd Lesion size was measured on 8 aortic root sections at 50-µm intervals starting from valve initiation c, and plaque composition was analyzed by quantifying the percent ORO+, CD68+ and collagen+ areas within lesions (d). Representative images of aortic root sections are show in (b) and Supplemental Fig. 8. Data are presented as mean ± SEM. *,§p < 0.05 denote statistically significant differences between the Ctrl and Base (*) or Statin (§) groups, Base group n = 7, Ctrl and Statin groups n = 8 each, one-way ANOVA. e, f Quantification of Mϕ proliferation based on BrdU incorporation e and of Mϕ egress based on bead retention f in aortic root lesions. Results are presented as mean ± SEM on the right, Base group n = 7, Ctrl and Statin groups n = 8 each, one-way ANOVA. Representative images are shown on the left
Fig. 7
Fig. 7
LDL-cholesterol correlates with local macrophage proliferation in human atherosclerotic plaques. a Representative image of a carotid artery section with plaque, where lipids are stained with Oil-red O. b Representative images of CD68 (Mϕ, KI67 (proliferation), Hoechst (nuclei) co-staining in the plaque. Arrows mark triple-positive, proliferating Mϕ c Correlation of plaque Mϕ proliferation rate with serum LDL-cholesterol levels and plaque lipid content (ORO+ area), respectively. Each point represents an individual patient (n = 20), r: Pearson’s correlation coefficient, p < 0.05 denotes significant correlation

Similar articles

Cited by

References

    1. Albarrán-Juárez J, Kaur H, Grimm M, Offermanns S, Wettschureck N. Lineage tracing of cells involved in atherosclerosis. Atherosclerosis. 2016;251:445–453. doi: 10.1016/j.atherosclerosis.2016.06.012. - DOI - PubMed
    1. Babelova A, Sedding DG, Brandes RP. Anti-atherosclerotic mechanisms of statin therapy. Curr Opin Pharmacol. 2013;13:260–264. doi: 10.1016/j.coph.2013.01.004. - DOI - PubMed
    1. Bea F, Blessing E, Bennett B, Levitz M, Wallace EP, Rosenfeld ME. Simvastatin promotes atherosclerotic plaque stability in apoE-deficient mice independently of lipid lowering. Arterioscler Thromb Vasc Biol. 2002;22:1832–1837. doi: 10.1161/01.ATV.0000036081.01231.16. - DOI - PubMed
    1. Boada C, Zinger A, Tsao C, Zhao P, Martinez JO, Hartman K, Naoi T, Sukhoveshin R, Sushnitha M, Molinaro R, Trachtenberg B, Cooke JP, Tasciotti E. Rapamycin-loaded biomimetic nanoparticles reverse vascular inflammation. Circ Res. 2020;126:25–37. doi: 10.1161/CIRCRESAHA.119.315185. - DOI - PubMed
    1. Bonetti PO, Lerman LO, Napoli C, Lerman A. Statin effects beyond lipid lowering—are they clinically relevant. Eur Heart J. 2003;24:225–248. doi: 10.1016/S0195-668X0200419-0. - DOI - PubMed

Publication types

MeSH terms