

18F-C2Am: a targeted imaging agent for detecting tumor cell death in vivo using positron emission tomography
- PMID: 33296043
- PMCID: PMC7726082
- DOI: 10.1186/s13550-020-00738-7
18F-C2Am: a targeted imaging agent for detecting tumor cell death in vivo using positron emission tomography
Abstract
Introduction: Trialing novel cancer therapies in the clinic would benefit from imaging agents that can detect early evidence of treatment response. The timing, extent and distribution of cell death in tumors following treatment can give an indication of outcome. We describe here an 18F-labeled derivative of a phosphatidylserine-binding protein, the C2A domain of Synaptotagmin-I (C2Am), for imaging tumor cell death in vivo using PET.
Methods: A one-pot, two-step automated synthesis of N-(5-[18F]fluoropentyl)maleimide (60 min synthesis time, > 98% radiochemical purity) has been developed, which was used to label the single cysteine residue in C2Am within 30 min at room temperature. Binding of 18F-C2Am to apoptotic and necrotic tumor cells was assessed in vitro, and also in vivo, by dynamic PET and biodistribution measurements in mice bearing human tumor xenografts treated with a TRAILR2 agonist or with conventional chemotherapy. C2Am detection of tumor cell death was validated by correlation of probe binding with histological markers of cell death in tumor sections obtained immediately after imaging.
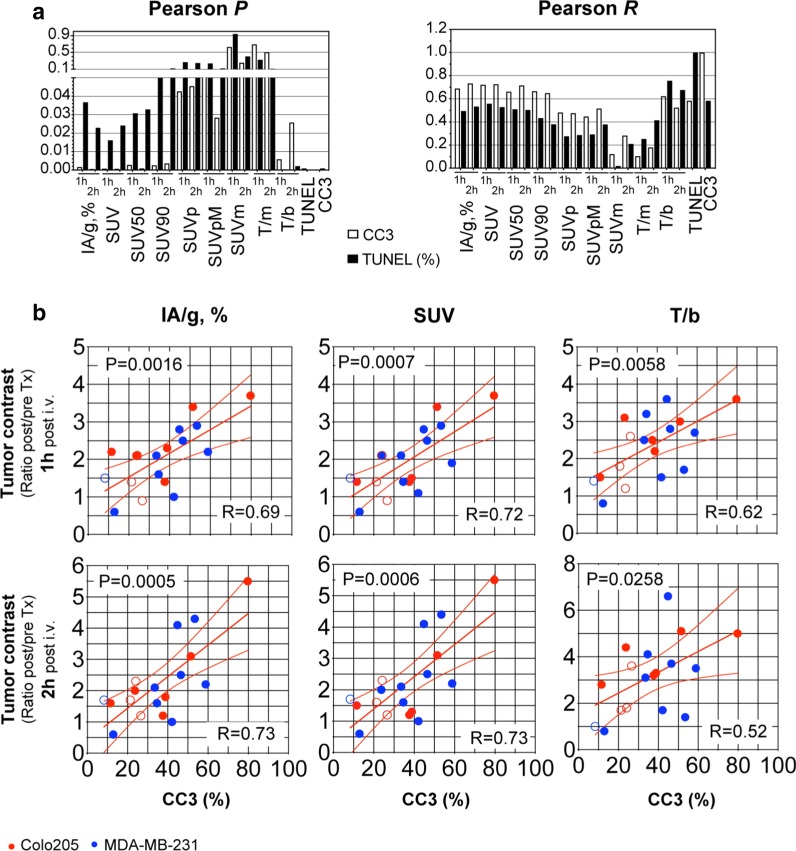
Results: 18F-C2Am showed a favorable biodistribution profile, with predominantly renal clearance and minimal retention in spleen, liver, small intestine, bone and kidney, at 2 h following probe administration. 18F-C2Am generated tumor-to-muscle (T/m) ratios of 6.1 ± 2.1 and 10.7 ± 2.4 within 2 h of probe administration in colorectal and breast tumor models, respectively, following treatment with the TRAILR2 agonist. The levels of cell death (CC3 positivity) following treatment were 12.9-58.8% and 11.3-79.7% in the breast and colorectal xenografts, respectively. Overall, a 20% increase in CC3 positivity generated a one unit increase in the post/pre-treatment tumor contrast. Significant correlations were found between tracer uptake post-treatment, at 2 h post-probe administration, and histological markers of cell death (CC3: Pearson R = 0.733, P = 0.0005; TUNEL: Pearson R = 0.532, P = 0.023).
Conclusion: The rapid clearance of 18F-C2Am from the blood pool and low kidney retention allowed the spatial distribution of cell death in a tumor to be imaged during the course of therapy, providing a rapid assessment of tumor treatment response. 18F-C2Am has the potential to be used in the clinic to assess early treatment response in tumors.
Keywords: C2Am; Cell death; PET; Synaptotagmin-I; TRAILR2; Tumor.
Conflict of interest statement
C2Am is under a licensing agreement with Cambridge Enterprise, and has been patented (US2011/0038798). Some of the authors of this study (André A. Neves and Kevin M. Brindle) are coinventors on this patent. No other potential conflict of interest relevant to this article was reported.
Figures


Similar articles
-
Preclinical PET Imaging of Tumor Cell Death following Therapy Using Gallium-68-Labeled C2Am.Cancers (Basel). 2023 Mar 2;15(5):1564. doi: 10.3390/cancers15051564. Cancers (Basel). 2023. PMID: 36900353 Free PMC article.
-
Rapid Imaging of Tumor Cell Death In Vivo Using the C2A Domain of Synaptotagmin-I.J Nucl Med. 2017 Jun;58(6):881-887. doi: 10.2967/jnumed.116.183004. Epub 2017 Feb 16. J Nucl Med. 2017. PMID: 28209913
-
Optoacoustic Detection of Early Therapy-Induced Tumor Cell Death Using a Targeted Imaging Agent.Clin Cancer Res. 2017 Nov 15;23(22):6893-6903. doi: 10.1158/1078-0432.CCR-17-1029. Epub 2017 Aug 18. Clin Cancer Res. 2017. PMID: 28821560
-
111In/68Ga-Labeled anti-epidermal growth factor receptor, native chemical ligation cyclized Affibody ZHER2:342min.2013 Apr 3 [updated 2013 May 23]. In: Molecular Imaging and Contrast Agent Database (MICAD) [Internet]. Bethesda (MD): National Center for Biotechnology Information (US); 2004–2013. 2013 Apr 3 [updated 2013 May 23]. In: Molecular Imaging and Contrast Agent Database (MICAD) [Internet]. Bethesda (MD): National Center for Biotechnology Information (US); 2004–2013. PMID: 23700641 Free Books & Documents. Review.
-
111In-Labeled anti-epidermal growth factor receptor Affibody PEP09239.2013 Mar 28 [updated 2013 May 2]. In: Molecular Imaging and Contrast Agent Database (MICAD) [Internet]. Bethesda (MD): National Center for Biotechnology Information (US); 2004–2013. 2013 Mar 28 [updated 2013 May 2]. In: Molecular Imaging and Contrast Agent Database (MICAD) [Internet]. Bethesda (MD): National Center for Biotechnology Information (US); 2004–2013. PMID: 23638490 Free Books & Documents. Review.
Cited by
-
Current trends in luminescence-based assessment of apoptosis.RSC Adv. 2023 Oct 30;13(45):31641-31658. doi: 10.1039/d3ra05809c. eCollection 2023 Oct 26. RSC Adv. 2023. PMID: 37908656 Free PMC article. Review.
-
Apoptosis Imaging in Oncology by Means of Positron Emission Tomography: A Review.Int J Mol Sci. 2021 Mar 9;22(5):2753. doi: 10.3390/ijms22052753. Int J Mol Sci. 2021. PMID: 33803180 Free PMC article. Review.
-
Improved Multimodal Tumor Necrosis Imaging with IRDye800CW-DOTA Conjugated to an Albumin-Binding Domain.Cancers (Basel). 2022 Feb 9;14(4):861. doi: 10.3390/cancers14040861. Cancers (Basel). 2022. PMID: 35205609 Free PMC article.
-
Preclinical PET Imaging of Tumor Cell Death following Therapy Using Gallium-68-Labeled C2Am.Cancers (Basel). 2023 Mar 2;15(5):1564. doi: 10.3390/cancers15051564. Cancers (Basel). 2023. PMID: 36900353 Free PMC article.
-
Radionuclide imaging of apoptosis for clinical application.Eur J Nucl Med Mol Imaging. 2022 Mar;49(4):1345-1359. doi: 10.1007/s00259-021-05641-4. Epub 2021 Dec 7. Eur J Nucl Med Mol Imaging. 2022. PMID: 34873639 Free PMC article. Review.
References
-
- Nonnenmacher L, Hasslacher S, Zimmermann J, Karpel-Massler G, La Ferla-Brühl K, Barry SE, Burster T, Siegelin MD, Brühl O, Halatsch ME, Debatin KM, Westhoff MA. Cell death induction in cancer therapy—past, present, and future. Crit Rev Oncog. 2016;21:253–267. doi: 10.1615/CritRevOncog.2016016987. - DOI - PubMed
Grants and funding
LinkOut - more resources
Full Text Sources
