. 2020 Dec 9;15(12):e0242010.
doi: 10.1371/journal.pone.0242010. eCollection 2020.

Learning from urban form to predict building heights

Affiliations

Learning from urban form to predict building heights

Nikola Milojevic-Dupont et al. PLoS One. .

Abstract

Understanding cities as complex systems, sustainable urban planning depends on reliable high-resolution data, for example of the building stock to upscale region-wide retrofit policies. For some cities and regions, these data exist in detailed 3D models based on real-world measurements. However, they are still expensive to build and maintain, a significant challenge, especially for small and medium-sized cities that are home to the majority of the European population. New methods are needed to estimate relevant building stock characteristics reliably and cost-effectively. Here, we present a machine learning based method for predicting building heights, which is based only on open-access geospatial data on urban form, such as building footprints and street networks. The method allows to predict building heights for regions where no dedicated 3D models exist currently. We train our model using building data from four European countries (France, Italy, the Netherlands, and Germany) and find that the morphology of the urban fabric surrounding a given building is highly predictive of the height of the building. A test on the German state of Brandenburg shows that our model predicts building heights with an average error well below the typical floor height (about 2.5 m), without having access to training data from Germany. Furthermore, we show that even a small amount of local height data obtained by citizens substantially improves the prediction accuracy. Our results illustrate the possibility of predicting missing data on urban infrastructure; they also underline the value of open government data and volunteered geographic information for scientific applications, such as contextual but scalable strategies to mitigate climate change.


Conflict of interest statement

D.d.B.S and F.A are employed by the commercial company Nam.R. This does not alter our adherence to PLOS ONE policies on sharing data and materials.

Figures

Fig 1
Fig 1. Building heights in the different geographical areas used in this study.
(A) Height distributions for the state of Brandenburg in Germany, the Netherlands, the region of Friuli-Venezia Giulia in Italy and five French urban areas. These distributions correspond to the final dataset, after removing buildings with a height below 2 m and buildings with a footprint area below 10 m2, see S4 Appendix. (B) Location of the four areas representing Northern and Southern European regions, and urban and rural contexts. (C) Example of building heights in the city of Udine in Italy. This map shows a mid-size city with higher buildings in the historical center and along a main axis, and lower buildings in residential areas.
Fig 2
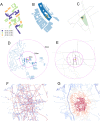
Fig 2. Illustrations of the urban form features used.
(A) Individual building footprint geometries. The convexity values of buildings’ footprint polygon are displayed in the legend. Convexity ranges between 0 and 1. (B) Block of adjacent buildings. The block in which a building of interest is located is depicted in dark blue. (C) Street-based block, in green, surrounding a building of interest. (D) Buildings within a circular buffer of 50, 200 and 500 m around a building of interest. (E) Streets within a circular buffer of 50, 200 and 500 m around a building of interest. (F) Betweeness centrality shows main streets and secondary streets. We use as features for example the betweeness centrality of the closest street, or the average within a buffer. (G) Closeness centrality shows where streets are converging. Both centrality measures give information on the structure of the city and relative position of a street in the city street network.
Fig 3
Fig 3. Map of the three experiments on the test set of Brandenburg.
(A) Experiment 1: No local data are available, and the model is trained only on data from other countries. (B) Experiment 2: Scarce local data are available—we add 2% of the test set to the training set, to test the hypothesis that these data provide relevant data for training the model. (C) Experiment 3: The main city of the area is available—we add this city to the training. The areas in blue are the training set and the area in red is the test set.
Fig 4
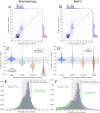
Fig 4. Results of the predictions for the test regions, Brandenburg (left) and Berlin (right).
(A–B) Joint plot of predicted values over target values for Experiment 1 (No local data), both in meters, with the marginal distributions as barplots. The intensity of the bins’ color represent the density of data points in the bin. On the thick diagonal grey line, points are perfectly predicted. Points above the line are under-predicted and those below the line are over-predicted. (C–D) Error distribution of different target height ranges, for Experiment 1 in Brandenburg and for Experiment 2 (2% local sample) in Berlin. The shaded areas represents an error range of +/− 2.5 meters, which roughly corresponds to the height of one floor. (E–F) Error distributions for Experiments 1 and 2. The shaded areas represents an error range of +/− 2.5 meters.
Fig 5
Fig 5. Prediction errors in Berlin for Experiments 1 (no local data) and Experiment 2 (2% of local data).
The errors (in meters) are aggregated on a grid for better readability, and depicted by a color gradient. The presence of local data in Experiment 2 starkly reduces the errors and the occurrences of under-prediction, especially in the center of Berlin.

References

    1. Zhu Z, Zhou Y, Seto KC, Stokes EC, Deng C, Pickett ST, et al. Understanding an urbanizing planet: Strategic directions for remote sensing. Remote Sensing of Environment. 2019;228:164–182. 10.1016/j.rse.2019.04.020 - DOI
    1. Bai X, Dawson RJ, Ürge-Vorsatz D, Delgado GC, Barau AS, Dhakal S, et al. Six research priorities for cities and climate change; 2018. - PubMed
    1. Silva M, Oliveira V, Leal V. Urban form and energy demand: A review of energy-relevant urban attributes. Journal of Planning Literature. 2017;32(4):346–365. 10.1177/0885412217706900 - DOI
    1. Creutzig F, Agoston P, Minx JC, Canadell JG, Andrew RM, Le Quéré C, et al. Urban infrastructure choices structure climate solutions. Nature Climate Change. 2016;6(12):1054–1056. 10.1038/nclimate3169 - DOI
    1. Creutzig F, Javaid A, Soomauroo Z, Lohrey S, Milojevic-Dupont N, Ramakrishnan A, et al. Fair street space allocation: ethical principles and empirical insights. Transport Reviews. 2020; p. 1–23.

Publication types