. 2020 Dec 8;33(10):108474.
doi: 10.1016/j.celrep.2020.108474.

The Master Regulator Protein BAZ2B Can Reprogram Human Hematopoietic Lineage-Committed Progenitors into a Multipotent State

Affiliations

The Master Regulator Protein BAZ2B Can Reprogram Human Hematopoietic Lineage-Committed Progenitors into a Multipotent State

Karthik Arumugam et al. Cell Rep. .

Abstract

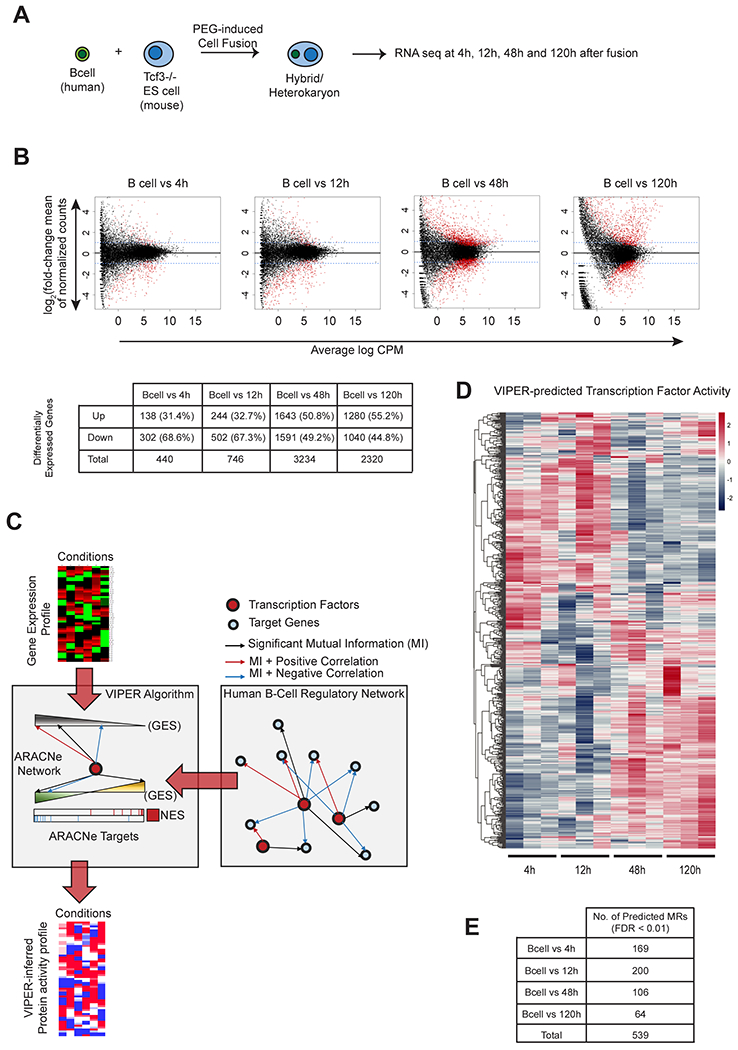
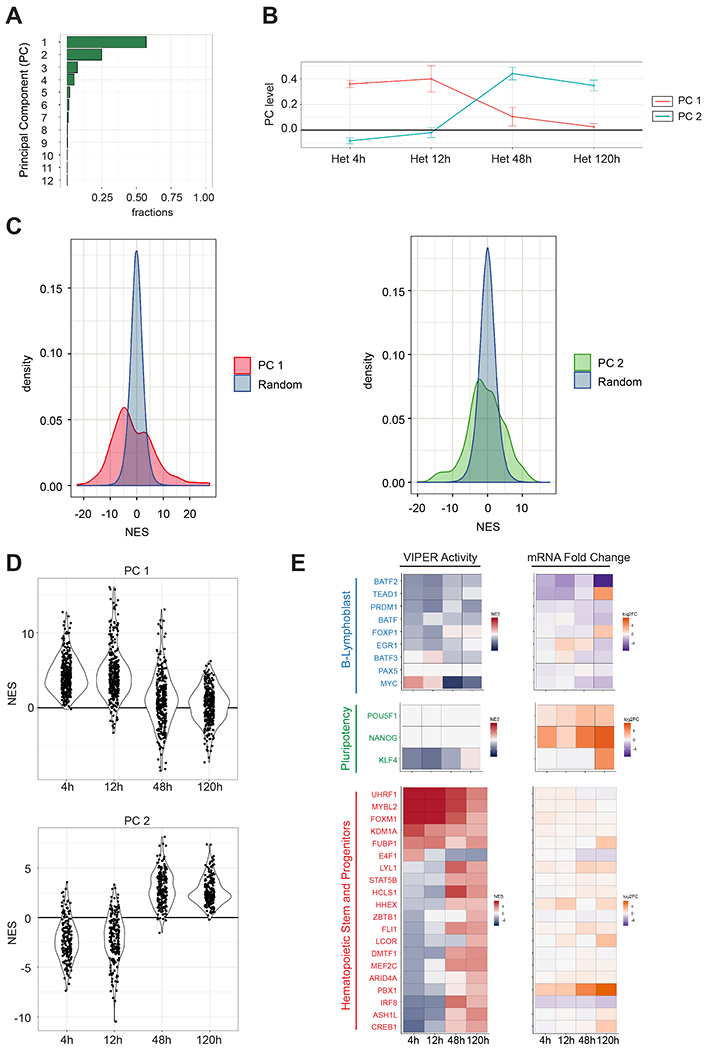
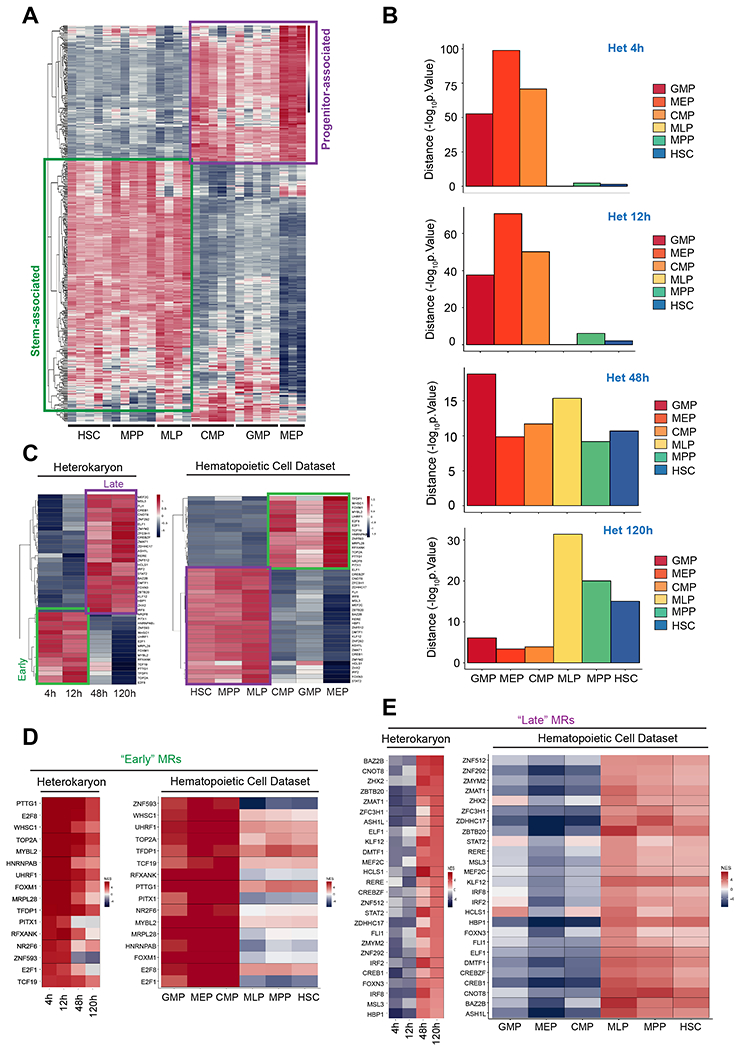
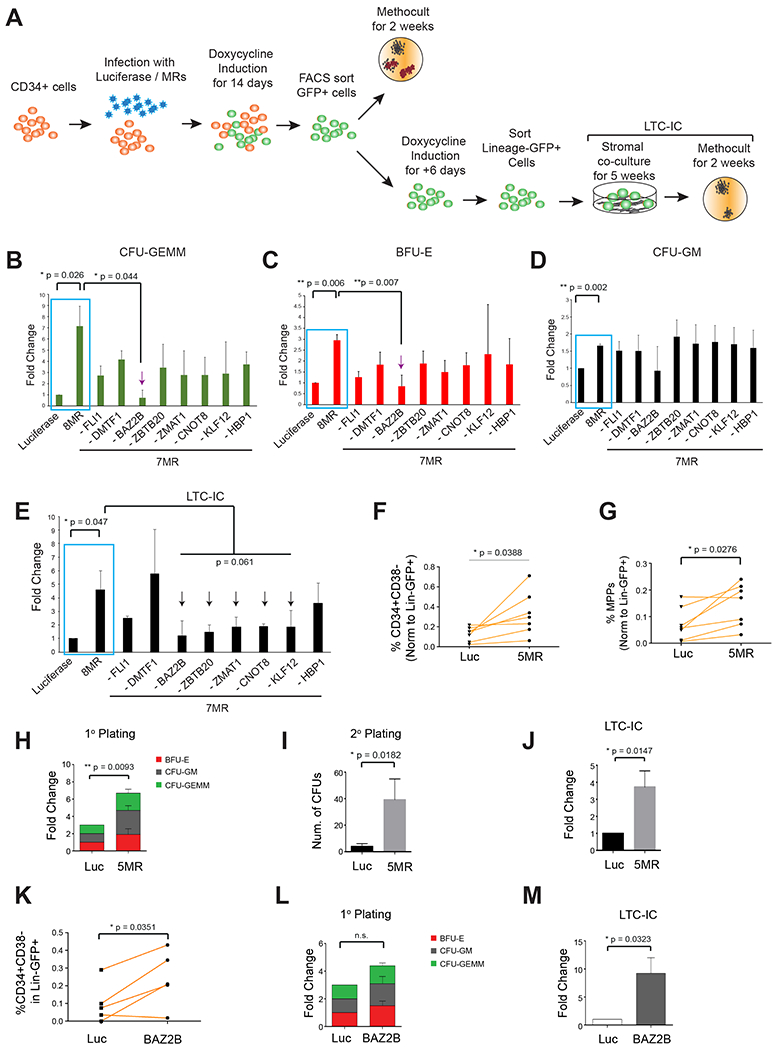
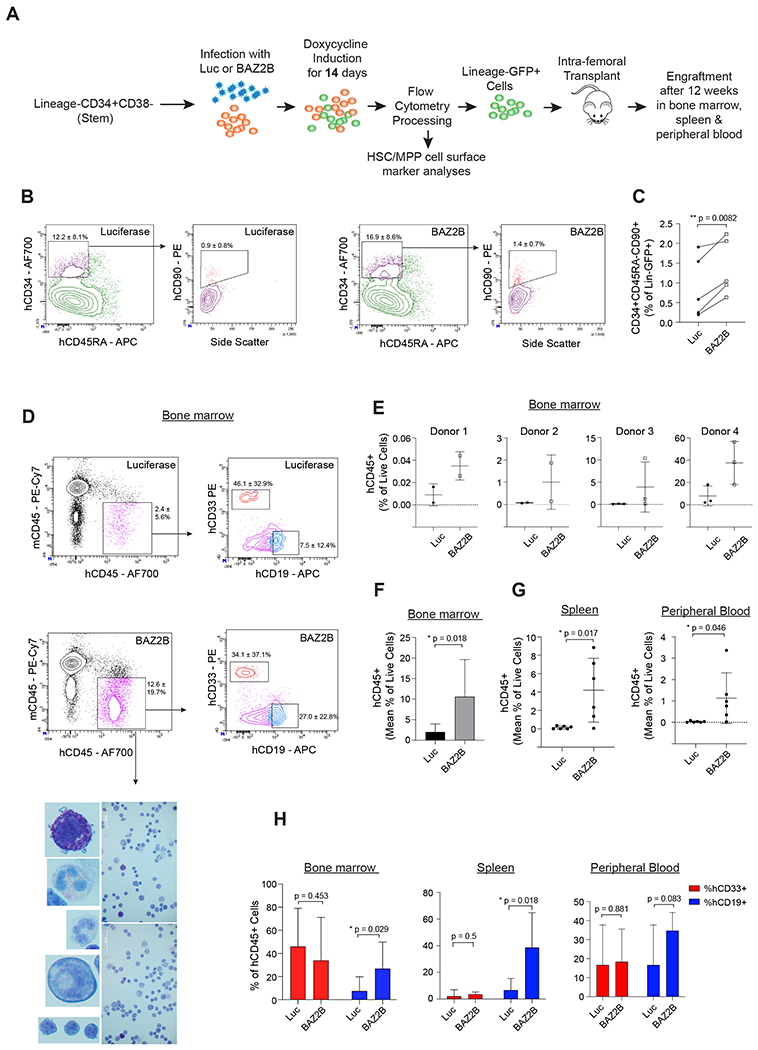
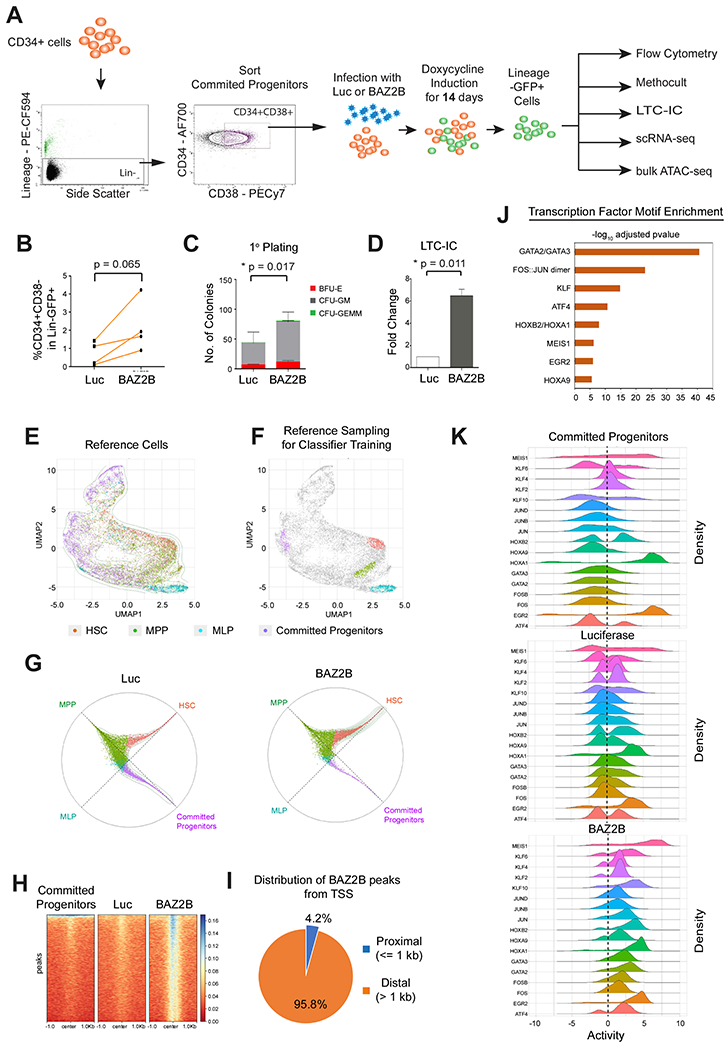
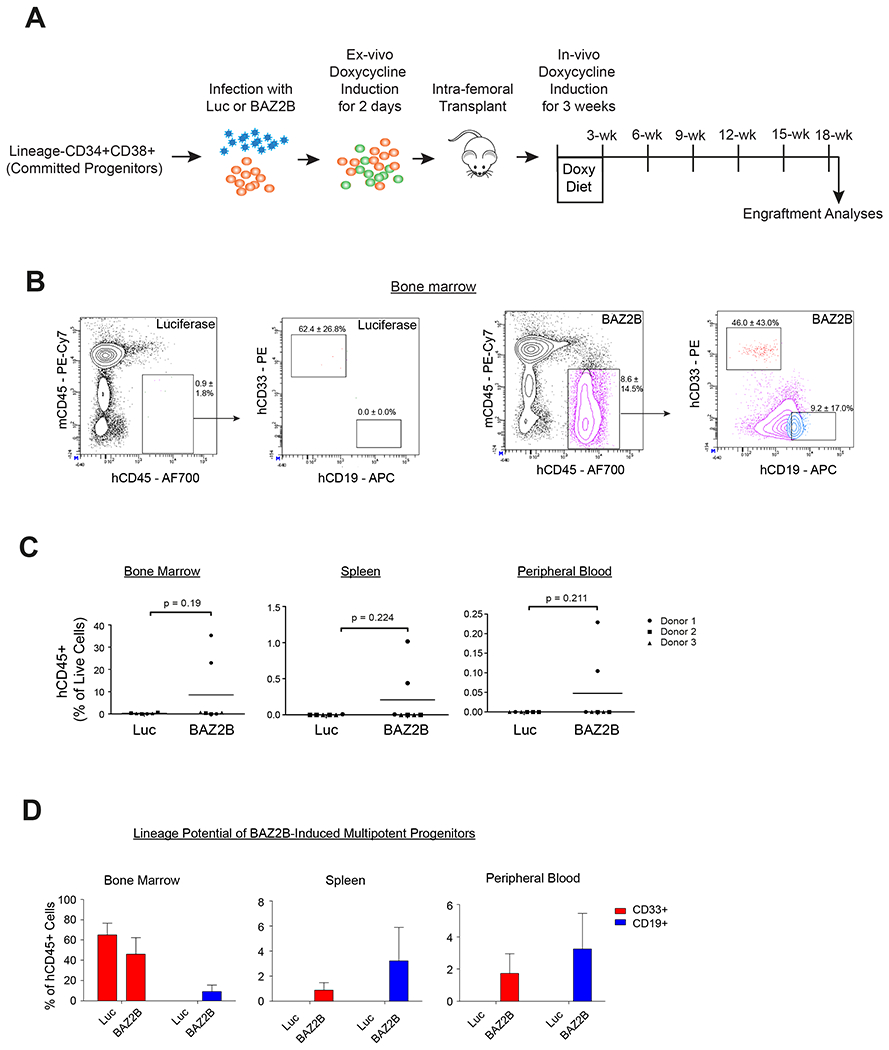
Bi-species, fusion-mediated, somatic cell reprogramming allows precise, organism-specific tracking of unknown lineage drivers. The fusion of Tcf7l1-/- murine embryonic stem cells with EBV-transformed human B cell lymphocytes, leads to the generation of bi-species heterokaryons. Human mRNA transcript profiling at multiple time points permits the tracking of the reprogramming of B cell nuclei to a multipotent state. Interrogation of a human B cell regulatory network with gene expression signatures identifies 8 candidate master regulator proteins. Of these 8 candidates, ectopic expression of BAZ2B, from the bromodomain family, efficiently reprograms hematopoietic committed progenitors into a multipotent state and significantly enhances their long-term clonogenicity, stemness, and engraftment in immunocompromised mice. Unbiased systems biology approaches let us identify the early driving events of human B cell reprogramming.

Keywords: BAZ2B; cell fusion; chromatin remodeling; gene regulatory network; hematopoietic stem cells; master regulators; reprogramming; single cell sequencing; systems biology.


Conflict of interest statement

Declaration of Interests A.C. is founder, equity holder, consultant, and director of DarwinHealth Inc., a company that has licensed some of the algorithms used in this article from Columbia University. Columbia University is also an equity holder in DarwinHealth Inc. A provisional US patent application (US 63/086,265) has been filed related to this work, with M.P.C., A.C., and K.A. as inventors. A US patent (10,790,040) has been awarded related to this work with A.C. as an inventor, assigned to Columbia University.

Figures

Figure 1.
Figure 1.. Fusion of mouse ESCs with human EBV-B lymphocytes, induces genome-wide transcriptional changes in the human nuclei.
(A) Schematic for generation of heterokaryons and paired-end sequencing. (B) Differential expression of human genes after fusion of murine Tcf7l1−/− ESCs with human EBV-B lymphocytes. x-axis : Log2 fold-change of normalized counts and y-axis : mean of normalized counts. Blue-dashed line indicates fold-change of 1. Genes with significant (FDR < 0.05) change in expression are shown in red. Average log CPM (Count Per Million) values were calculated from 3 biological replicates for each time-point. Table shows upregulated and downregulated genes. See also Figure S1. (C) Schematic for the generation of protein activity profile using the VIPER algorithm and ARACNe network (See STAR Methods for details). (D) Heatmap of VIPER-predicted Normalized Enrichment Score values (NES values) of 539 MRs that had significant predicted activities (FDR < 0.01) in the heterokaryon samples. NES values were calculated using the VIPER algorithm by comparing each heterokaryon sample against the unfused PEG-treated B-cells. Positive NES values indicating active MRs are shown in red, and negative NES values indicating silenced MRs are shown in blue. (E) Number of MRs predicted in each timepoint (FDR < 0.01).
Figure 2.
Figure 2.. Two distinct clusters of transcription factors are sequentially activated in a time-dependent manner in the human EBV-B nuclei in the heterokaryons.
(A) Single Value Decomposition (SVD) analysis. PC are plotted on the y-axis and the proportion of variance of VIPER activity in the heterokaryon dataset is plotted on the x-axis. (B) PC levels across the sample time points for the top-2 PCs of the heterokaryon dataset. (C) Genes contributing significantly to the PCs 1 and 2 by comparing their PC coefficients with PC coefficients calculated from randomly shuffled VIPER activity levels. The random distributions are shown in blue and the coefficients PC 1 and PC 2 in red and green, respectively (p < 0.05). (D) Violin plots for VIPER-predicted activity levels represented by average NES for the 105 transcription factors (upper panel) significantly (p < 0.05) associated with PC 1 and for 64 transcription factors (lower panel) significantly associated with PC 2. VIPER-predicted activities were calculated comparing the heterokaryon samples of each time point against the unfused EBV-B cells. (E) VIPER-predicted activity and differential expression of a representative set of human genes during reprogramming. Positive NES values indicating active MRs are shown in red, and negative NES values indicating silenced MRs are shown in blue. mRNA Fold Change (Log2FC) was calculated using EdgeR by comparing the heterokaryon samples with unfused B-cells. Upregulated genes are shown in orange, and downregulated genes are shown in dark purple.
Figure 3.
Figure 3.. The human EBV-B nuclei are reprogrammed to a multipotent hematopoietic stem progenitor-like state 5 days after fusion.
(A) Heatmap of predicted activity for significant hematopoietic Master Regulators (MRs). Heatmap shows NES values of 445 MRs that were significant (FDR < 0.01) in each sample from the Laurenti et al., dataset compared to unfused B-cell samples. (B) Correlation of transcription factor with positive activity (FDR < 0.05) between heterokaryons and the human hematopoietic cells using Fisher’s Exact Test (FET). −Log10 of the p-values of the overlap are shown. (C) Heatmap of the early and late MR programs in the Heterokaryons and in the hematopoietic cell dataset. (D, E) Heatmap showing the activity of the “Early” MRs (D) and “Late” MRs (E) in the heterokaryon and the hematopoietic cell dataset. (A, C-E) Positive NES values indicating active MRs are shown in red, and negative NES values indicating silenced MRs are shown in blue.
Figure 4.
Figure 4.. A combination of the predicted MRs enhances the stemness and long-term clonogenicity of CD34+ human hematopoietic cells.
(A) Schematic showing the experimental workflow of the first screen with human CD34+ hematopoietic stem and progenitor cells. (B-D) Human CD34+ cells infected with 8 MRs, or 8 combinations of 7 MRs were plated on methocult assays to count colonies of lineages (B) CFU-GEMM, (C) BFU-E and (D) CFU-GM based on morphology. N = 3 donors. Data represented as mean ± SD. (E) Sorted Lineage-GFP+ cells plated on LTC-IC assay followed by counting of colonies. N = 3 donors. Data represented as mean ± SD. Luc vs 8-MR: two-tailed paired t-test **P<0.01, *P<0.05. 8-MR vs 7-MR combinations: two-tailed unpaired t-test with unequal variance. (F-J) Overexpression of a combination of 5 MRs in human CD34+ cells. Lineage-GFP+ cells were FACS analyzed or characterized by in vitro colony assays. (F) Quantification of Lin-CD34+CD38− Stem Progenitors represented for N = 7 donors. (G) Quantification of MPPs represented for N = 7 donors. (H) Quantification of colonies from primary CFC assay N = 6 donors. Data represented as mean ± SD. (I) Quantification of colonies from secondary CFC assay N= 5 donors. Data represented as mean ± SD. (J) Quantification of colonies from LTC-IC CFC assay N = 5 donors. Data represented as mean ± SD. (K-M) Human CD34+ cells transduced with Luciferase or BAZ2B for in vitro analysis. (K) Quantification of the CD34+CD38− multipotent stem progenitor within Lineage-GFP+ cells from N = 5 donors (L) Quantification of colonies from primary CFC assay N = 5 donors. Data represented as mean ± SD. (M) Quantification of colonies from LTC-IC CFC assay N= 5 donors. Data represented as mean ± SD. (B-M) Two-tailed paired t-test, unless specified otherwise **P<0.01, *P<0.05.
Figure 5.
Figure 5.. BAZ2B enhances renewal of Lin-CD34+CD38− stem progenitor fraction.
(A) Lin-CD34+CD38− cells were transduced with Luciferase or BAZ2B and intra-femoral transplanted into irradiated NSG mice (See STAR Methods, for details). (B-C) FACS analyses of the Lineage-GFP+ population after gene induction (B) Representative FACS plot showing the enrichment of CD34+CD45RA-CD90+ population in BAZ2B vs Luciferase-transduced cells. Percentage fractions for each gate normalized to Lineage-GFP+ fraction represented as mean ± SD from N = 5 donors. (C) Quantification of the CD34+CD45RA-CD90+ normalized to Lineage-GFP+ cells N = 5 donors. Two-tailed paired t-test **P<0.01, *P<0.05. (D-F) Bone marrow FACS analyses of the transplanted NSG mice after 12 weeks. (D) Representative FACS plot showing the enrichment of the engrafted human CD45+ cells in the BAZ2B vs Luciferase-transduced cells. Percentage fractions for hCD45 gate normalized to live cells represented as mean ± SD. CD33+ myeloid and CD19+ lymphoid gates show the lineage potential for the human CD45+ cells. Percentage fractions for hCD33/hCD19 gate normalized to hCD45+ cells represented as mean ± SD. N = 4 donors, 2-3 mice per donor. Bottom panel from top to bottom: basophils, eosinophils, neutrophils, monocytes and lymphocytes derived from human CD45+ cells stained with the Wright-giemsa method. Scale bar: 50 urn. (E) Quantification of engrafted human CD45+ cells within the total live cells of the mouse bone marrow. N= 4 donors; 2-3 mice transplanted per donor. (F) Mean bone marrow engraftment of human CD45+ cells. N = 4 donors. Two-tailed paired t-test **P<0.01, *P<0.05. (G) Quantification of engrafted human CD45+ cells in the spleen and peripheral blood of the transplanted NSG mice. N= 2 donors; 2-3 mice per donor. Two tailed unpaired t-test **P<0.01, *P<0.05. (H) Quantification of the CD33+ myeloid and CD19+ lymphoid fraction normalized to the total human CD45+ cells engrafted in the bone marrow, spleen and peripheral blood. Bone marrow N= 4 donors; 2-3 mice per donor. Spleen and peripheral blood N= 2 donors; 2-3 mice per donor. Two tailed unpaired t-test **P<0.01, *P<0.05.
Figure 6.
Figure 6.. BAZ2B induces reprogramming of lineage committed hematopoietic progenitors to multipotent state by chromatin remodeling.
(A) Lineage-CD34+CD38+ committed progenitors were transduced with Luciferase or BAZ2B for in vitro analysis. (B) Quantification of the CD34+CD38− multipotent stem progenitor within Lineage-GFP+ cells from N = 4 donors. (C) Quantification of colonies from primary CFC assay N = 3 donors. Data represented as mean ± SD. (D) Quantification of colonies from LTC-IC CFC assay N= 3 donors. Data represented as mean ± SD. (B-D) Two-tailed paired t-test **P<0.01, *P<0.05. (E) UMAP visualization of the four reference populations FISCs, MPPs, MLPs and Lineage Committed Progenitors in VIPER space. (F) Top 1% of the cells of the four reference populations used for the random forest model, based on their differential density in the UMAP space. (G) Circular visualization of the model classification for Luciferase and BAZ2B samples. Samples closer to the circumference have a definite classification, and the plotting angle for each sample is determined by the weighted average of the model’s classification votes. (H) Heatmap of ATAC-Seq peaks showing unique SAZ2S-induced chromatin-accessible regions. (I) Distribution of BAZ2B-induced unique ATAC-Seq peaks from the transcription start sites. (J) Transcription factors with enriched motifs in the BAZ2B-induced nucleosome-free regions and a predicted VIPER activity > 1. (K) Ridgeline density plots showing VIPER-activity from single-cell RNA-Seq samples for 17 transcription factors (VIPER activity > 1) with enriched motifs in BAZ2B-induced nucleosome-free regions.
Figure 7.
Figure 7.. BAZ2B-induced multipotent hematopoietic progenitors possess long-term engraftment potential.
(A) Lin-CD34+CD38+ committed progenitors were sorted and transduced with Luciferase or BAZ2B followed by NSG mice transplantation (See STAR Methods, for details). Human hematopoietic engraftment was analyzed after 16 weeks. (B) FACS plot showing engraftment of human CD45+ hematopoietic cells in the mouse bone marrow upon expression of BAZ2B or Luciferase in Lin-CD34+CD38+ committed progenitors. Percentage fractions for hCD45 gate normalized to live cells represented as mean ± SD. CD33+ myeloid and CD19+ lymphoid gates show the lineage potential for the human CD45+ cells. Percentage fractions for hCD33/hCD19 gate normalized to hCD45+ cells represented as mean ± SD. N = 3 donors with 2-3 mice per donor. (C) Quantification of the engraftment of human CD45+ cells with respect to total live cells in the bone marrow, spleen and peripheral blood. Two-tailed unpaired t-test. (D) Quantification of the CD33+ myeloid and CD19+ lymphoid cells with respect to the total human CD45+ hematopoietic cells from Luciferase or BAZ2B-induced multipotent hematopoietic progenitors.

References

    1. Altarche-Xifro W, di Vicino U, Munoz-Martin MI, Bortolozzi A, Bove J, Vila M, and Cosma MP (2016). Functional Rescue of Dopaminergic Neuron Loss in Parkinson’s Disease Mice After Transplantation of Hematopoietic Stem and Progenitor Cells. EBioMedicine 8, 83–95. - PMC - PubMed
    1. Alter O, Brown PO, and Botstein D (2000). Singular value decomposition for genomewide expression data processing and modeling. Proc Natl Acad Sci U S A 97, 10101–10106. - PMC - PubMed
    1. Alvarez MJ, Shen Y, Giorgi FM, Lachmann A, Ding BB, Ye BH, and Califano A (2016). Functional characterization of somatic mutations in cancer using network-based inference of protein activity. Nat Genet 48, 838–847. - PMC - PubMed
    1. Alvarez-Dolado M, Pardal R, Garcia-Verdugo JM, Fike JR, Lee HO, Pfeffer K, Lois C, Morrison SJ, and Alvarez-Buylla A (2003). Fusion of bone-marrow-derived cells with Purkinje neurons, cardiomyocytes and hepatocytes. nature 425, 968–973. - PubMed
    1. Bailey TL, Boden M, Buske FA, Frith M, Grant CE, Clementi L, Ren J, Li WW, and Noble WS (2009). MEME SUITE: tools for motif discovery and searching. Nucleic Acids Res 37, W202–208. - PMC - PubMed

Publication types

MeSH terms

Substances